3254
Neurochemical and cognitive changes precede structural abnormalities in the TgF344-AD rat model of Alzheimer’s disease
Caitlin F Fowler1,2, Dana Goerzen2, Gabriel A Devenyi2,3, Dan Madularu4, M Mallar F Chakravarty1,2,3, and Jamie Near2,5
1Biological and Biomedical Engineering, McGill University, Montreal, QC, Canada, 2Cerebral Imaging Centre, Douglas Mental Health University Institute, Verdun, QC, Canada, 3Psychiatry, McGill University, Montreal, QC, Canada, 4Center for Translational Neuroimaging, Northeastern University, Boston, MA, United States, 5Physical Studies Research Platform, Sunnybrook Research Institute, Toronto, ON, Canada
1Biological and Biomedical Engineering, McGill University, Montreal, QC, Canada, 2Cerebral Imaging Centre, Douglas Mental Health University Institute, Verdun, QC, Canada, 3Psychiatry, McGill University, Montreal, QC, Canada, 4Center for Translational Neuroimaging, Northeastern University, Boston, MA, United States, 5Physical Studies Research Platform, Sunnybrook Research Institute, Toronto, ON, Canada
Synopsis
Alzheimer’s disease is a progressive neurodegenerative disorder with a decades-long pre-symptomatic phase, substantiating the need for prodromal biomarker development and early intervention. We employed longitudinal magnetic resonance imaging and spectroscopy in conjunction with behavioural testing to characterize the chronological order of appearance and progression of multiple facets of disease pathology in the TgF344-AD rat model. The TgF344-AD rat demonstrated impaired spatial reference memory by 4 months of age, followed by neurochemical abnormalities by 10 months and major structural changes by 16 months, most of which recapitulated documented changes in brain structure and tissue chemistry in human Alzheimer’s disease patients.
Introduction
Alzheimer’s disease (AD) is a progressive neurodegenerative disorder with no effective treatments or biomarkers for definitive diagnosis. Observable changes in brain pathology can appear decades prior to clinical symptoms, substantiating the need for early detection and intervention.1,2 To this end, magnetic resonance imaging (MRI) and spectroscopy (MRS) offer a unique window into the brain; these neuroimaging techniques enable non-invasive, longitudinal assays of brain structure and tissue chemistry and are highly translatable from animal models to human subjects.3–5 To deconstruct the processes underlying disease progression and identify potential biomarkers, we performed longitudinal MRI, MRS, and behavioural testing in the TgF344-AD rat model, which recapitulates the full spectrum of Alzheimer’s neuropathology.6 Impaired spatial reference memory was present prior to the appearance of altered neurochemistry, both of which preceded major structural abnormalities.Methods
TgF344-AD rats (n=26, 14M/12F) and wildtype littermates (n=24, 12M/12F) underwent MRI, MRS, and behavioural testing at 4-, 10-, 16-, and 18-months of age.MRI acquisition and volume estimation: High-resolution 3D anatomical MR images were acquired using Rapid Acquisition with Relaxation Enhancement (TR/TE=325/10.8ms, 114µm isotropic resolution) on a 7 Tesla Bruker Biospec 70/30 scanner. As described previously,7 pre-processing was performed using minc-toolkit-v2.8 The Pydpiper toolkit9 co-registered pre-processed images into a common space, generating voxelwise Jacobian deformation fields. The local volume of 120 brain regions was estimated using the Fischer 344 rat atlas.101H-MRS acquisition and analyses: Automated localized shimming was performed using the FASTMAP method11 prior to acquisition using Point RESolved Spectroscopy (TR/TE=3000/11ms) in the left dorsal hippocampus. Spectral preprocessing was performed in MATLAB using the FID-A toolkit.12 Processed spectra were analyzed using LCModel13 with a neurochemical basis set consisting of 18 metabolites and 9 macromolecules14 (Fig2.inset). Concentrations are reported referenced to water (mM). Barnes Maze: Spatial reference memory was assessed using a five-trial training protocol with a one-session probe test.15,16 Percent (%) time spent in the target quadrant and target holes, % success, number of holes searched, and speed were recorded during the probe trial. Statistics: Volumes were predicted using a linear mixed effects (LME) model with an interaction between quadratic age and genotype, a fixed effect of sex, and a random intercept per subject. Concentrations were predicted using an LME with an interaction between linear age and genotype with sex and water linewidth covaried, a random intercept per subject, and a weighting factor of the inverse absolute CRLB for each metabolite. Four age-centered models were also used to examine the main effect of genotype at each time point. For all LMEs, the False Discovery Rate (FDR) method17 applied at 5% was used to account for multiple comparisons. % time in target quadrant and target holes were analyzed using one-sample t-tests against a mean of 25%. % success, number of holes searched, and speed (cm/s) were analyzed using a linear model with genotype as a fixed effect and sex covaried. Bonferroni correction was applied across all tests (P-value<0.05/7) at each time point.Results and Discussion
Volume changes are illustrated as t-statistic maps in Fig. 1A for voxel-wise (left) and regional (right) analyses. The strongest interactions were atrophy in the basal forebrain, caudoputamen, fimbria, hippocampus, and nucleus accumbens, unilateral atrophy in the right fornix, and hypertrophy in the dentate gyrus, as seen in Fig. 1B. Age-centered models indicated initial hypertrophy followed by significant atrophy at 16 and 18 months in several regions. Select linear model results are shown in Table 1. Models of human disease progression indicate tissue pathology and atrophy in many of these regions18,19 with additional reports of earlier volume increases,20,21 possibly as an initial compensatory response. As shown in Fig. 2, total choline and myo-inositol demonstrated positive age-by-genotype interactions but did not survive FDR correction. Age-centered models revealed decreased total creatine, taurine, and the ratio of N-acetylaspartate to myo-inositol, and increased Lactate and total choline in Tg rats at 10, 16, and 18 months. myo-inositol was higher in TgF344-AD rats at 16 and 18 months only. Select linear model results are shown in Table 2. These changes suggest dysfunction in mitochondrial bioenergetics, cell membrane turnover, gliosis, antioxidant capacity, and synaptic transmission, all of which are affected in human AD.22–24 TgF344-AD rats did not spend significantly more than a chance amount of time in the target quadrant or target holes at any time point (Fig. 3A,B), suggesting impaired long-term spatial reference memory by 4-months of age. TgF344-AD rats also demonstrated a lower % success rate and slower speed, and searched fewer holes overall (Fig. 3C-E). Deficits in hippocampus-dependent spatial memory are among the earliest complaints in AD subjects25 but typically appear later into disease progression than identified here.1 This may be due to inconsistencies in how cognitive dysfunction is tested or presents in humans versus rodents.Conclusion
These findings support the use of MRI and MRS for the development of non-invasive biomarkers of disease progression, clarify the timing of pathological feature presentation in this model, and contribute to the validation of the TgF344-AD rat as a highly relevant model for preclinical research.Acknowledgements
No acknowledgement found.References
1. Jack CR Jr, Knopman DS, Jagust WJ, et al. Tracking pathophysiological processes in Alzheimer’s disease: an updated hypothetical model of dynamic biomarkers. Lancet Neurol. 2013;12(2):207-216.2. Bateman RJ, Xiong C, Benzinger TLS, et al. Clinical and biomarker changes in dominantly inherited Alzheimer’s disease. N Engl J Med. 2012;367(9):795-804.3. Gao F, Barker PB. Various MRS application tools for Alzheimer disease and mild cognitive impairment. AJNR Am J Neuroradiol. 2014;35(6 Suppl):S4-S11.4. Frisoni GB, Fox NC, Jack CR Jr, Scheltens P, Thompson PM. The clinical use of structural MRI in Alzheimer disease. Nat Rev Neurol. 2010;6(2):67-77.5. Mueller SG, Schuff N, Weiner MW. Evaluation of treatment effects in Alzheimer’s and other neurodegenerative diseases by MRI and MRS. NMR Biomed. 2006;19(6):655-668.6. Cohen RM, Rezai-Zadeh K, Weitz TM, et al. A transgenic Alzheimer rat with plaques, tau pathology, behavioral impairment, oligomeric aβ, and frank neuronal loss. J Neurosci. 2013;33(15):6245-6256.7. Fowler C, Goerzen D, Madularu D, Devenyi GA, Chakravarty MM, Near J. LONGITUDINAL CHARACTERIZATION OF NEUROANATOMICAL CHANGES IN THE FISCHER 344 RAT BRAIN DURING NORMAL AGING AND BETWEEN SEXES. Neurobiol Aging. Published online October 16, 2021. doi:10.1016/j.neurobiolaging.2021.10.0038. Vincent RD, Neelin P, Khalili-Mahani N, et al. MINC 2.0: A Flexible Format for Multi-Modal Images. Front Neuroinform. 2016;10:35.9. Friedel M, van Eede MC, Pipitone J, Chakravarty MM, Lerch JP. Pydpiper: a flexible toolkit for constructing novel registration pipelines. Front Neuroinform. 2014;8:67.10. Goerzen D, Fowler C, Devenyi GA, et al. An MRI-Derived Neuroanatomical Atlas of the Fischer 344 Rat Brain. Sci Rep. 2020;10(1):6952.11. Gruetter R. Automatic, Localized in Vivo Adjustment of All First- and Second-Order Shim Coils. Journal of Magnetic Resonance in Medicine. 1993;29:804-811.12. Simpson R, Devenyi GA, Jezzard P, Hennessy TJ, Near J. Advanced processing and simulation of MRS data using the FID appliance (FID-A)-An open source, MATLAB-based toolkit. Magn Reson Med. 2017;77(1):23-33.13. Provencher SW. Automatic quantitation of localized in vivo 1H spectra with LCModel. NMR Biomed. 2001;14(4):260-264.14. Fowler CF, Madularu D, Dehghani M, Devenyi GA, Near J. Longitudinal quantification of metabolites and macromolecules reveals age- and sex-related changes in the healthy Fischer 344 rat brain. Neurobiol Aging. 2020;101:109-122.15. Attar A, Liu T, Chan W-TC, et al. A shortened Barnes maze protocol reveals memory deficits at 4-months of age in the triple-transgenic mouse model of Alzheimer’s disease. PLoS One. 2013;8(11):e80355.16. Pitts MW. Barnes Maze Procedure for Spatial Learning and Memory in Mice. Bio Protoc. 2018;8(5). doi:10.21769/bioprotoc.274417. Benjamini Y, Hochberg Y. Controlling the False Discovery Rate: A Practical and Powerful Approach to Multiple Testing. J R Stat Soc Series B Stat Methodol. 1995;57(1):289-300.18. Jack CR, Barkhof F, Bernstein MA, et al. Steps to standardization and validation of hippocampal volumetry as a biomarker in clinical trials and diagnostic criterion for Alzheimer’s disease. Alzheimers Dement. 2011;7(4):474-485.e4.19. Callen DJ, Black SE, Gao F, Caldwell CB, Szalai JP. Beyond the hippocampus: MRI volumetry confirms widespread limbic atrophy in AD. Neurology. 2001;57(9):1669-1674.20. Fortea J, Sala-Llonch R, Bartrés-Faz D, et al. Increased cortical thickness and caudate volume precede atrophy in PSEN1 mutation carriers. J Alzheimers Dis. 2010;22(3):909-922.21. Riudavets MA, Iacono D, Resnick SM, et al. Resistance to Alzheimer’s pathology is associated with nuclear hypertrophy in neurons. Neurobiol Aging. 2007;28(10):1484-1492.22. Mattson MP. Pathways towards and away from Alzheimer’s disease. Nature. 2004;430(7000):631-639.23. McKenna MC, Dienel GA, Sonnewald U, Waagepetersen HS, Schousboe A. Chapter 11 - Energy Metabolism of the Brain. In: Brady ST, Siegel GJ, Albers RW, Price DL, eds. Basic Neurochemistry (Eighth Edition). Academic Press; 2012:200-231.24. Camandola S, Mattson MP. Brain metabolism in health, aging, and neurodegeneration. EMBO J. 2017;36(11):1474-1492.25. Lithfous S, Dufour A, Després O. Spatial navigation in normal aging and the prodromal stage of Alzheimer’s disease: insights from imaging and behavioral studies. Ageing Res Rev. 2013;12(1):201-213.Figures
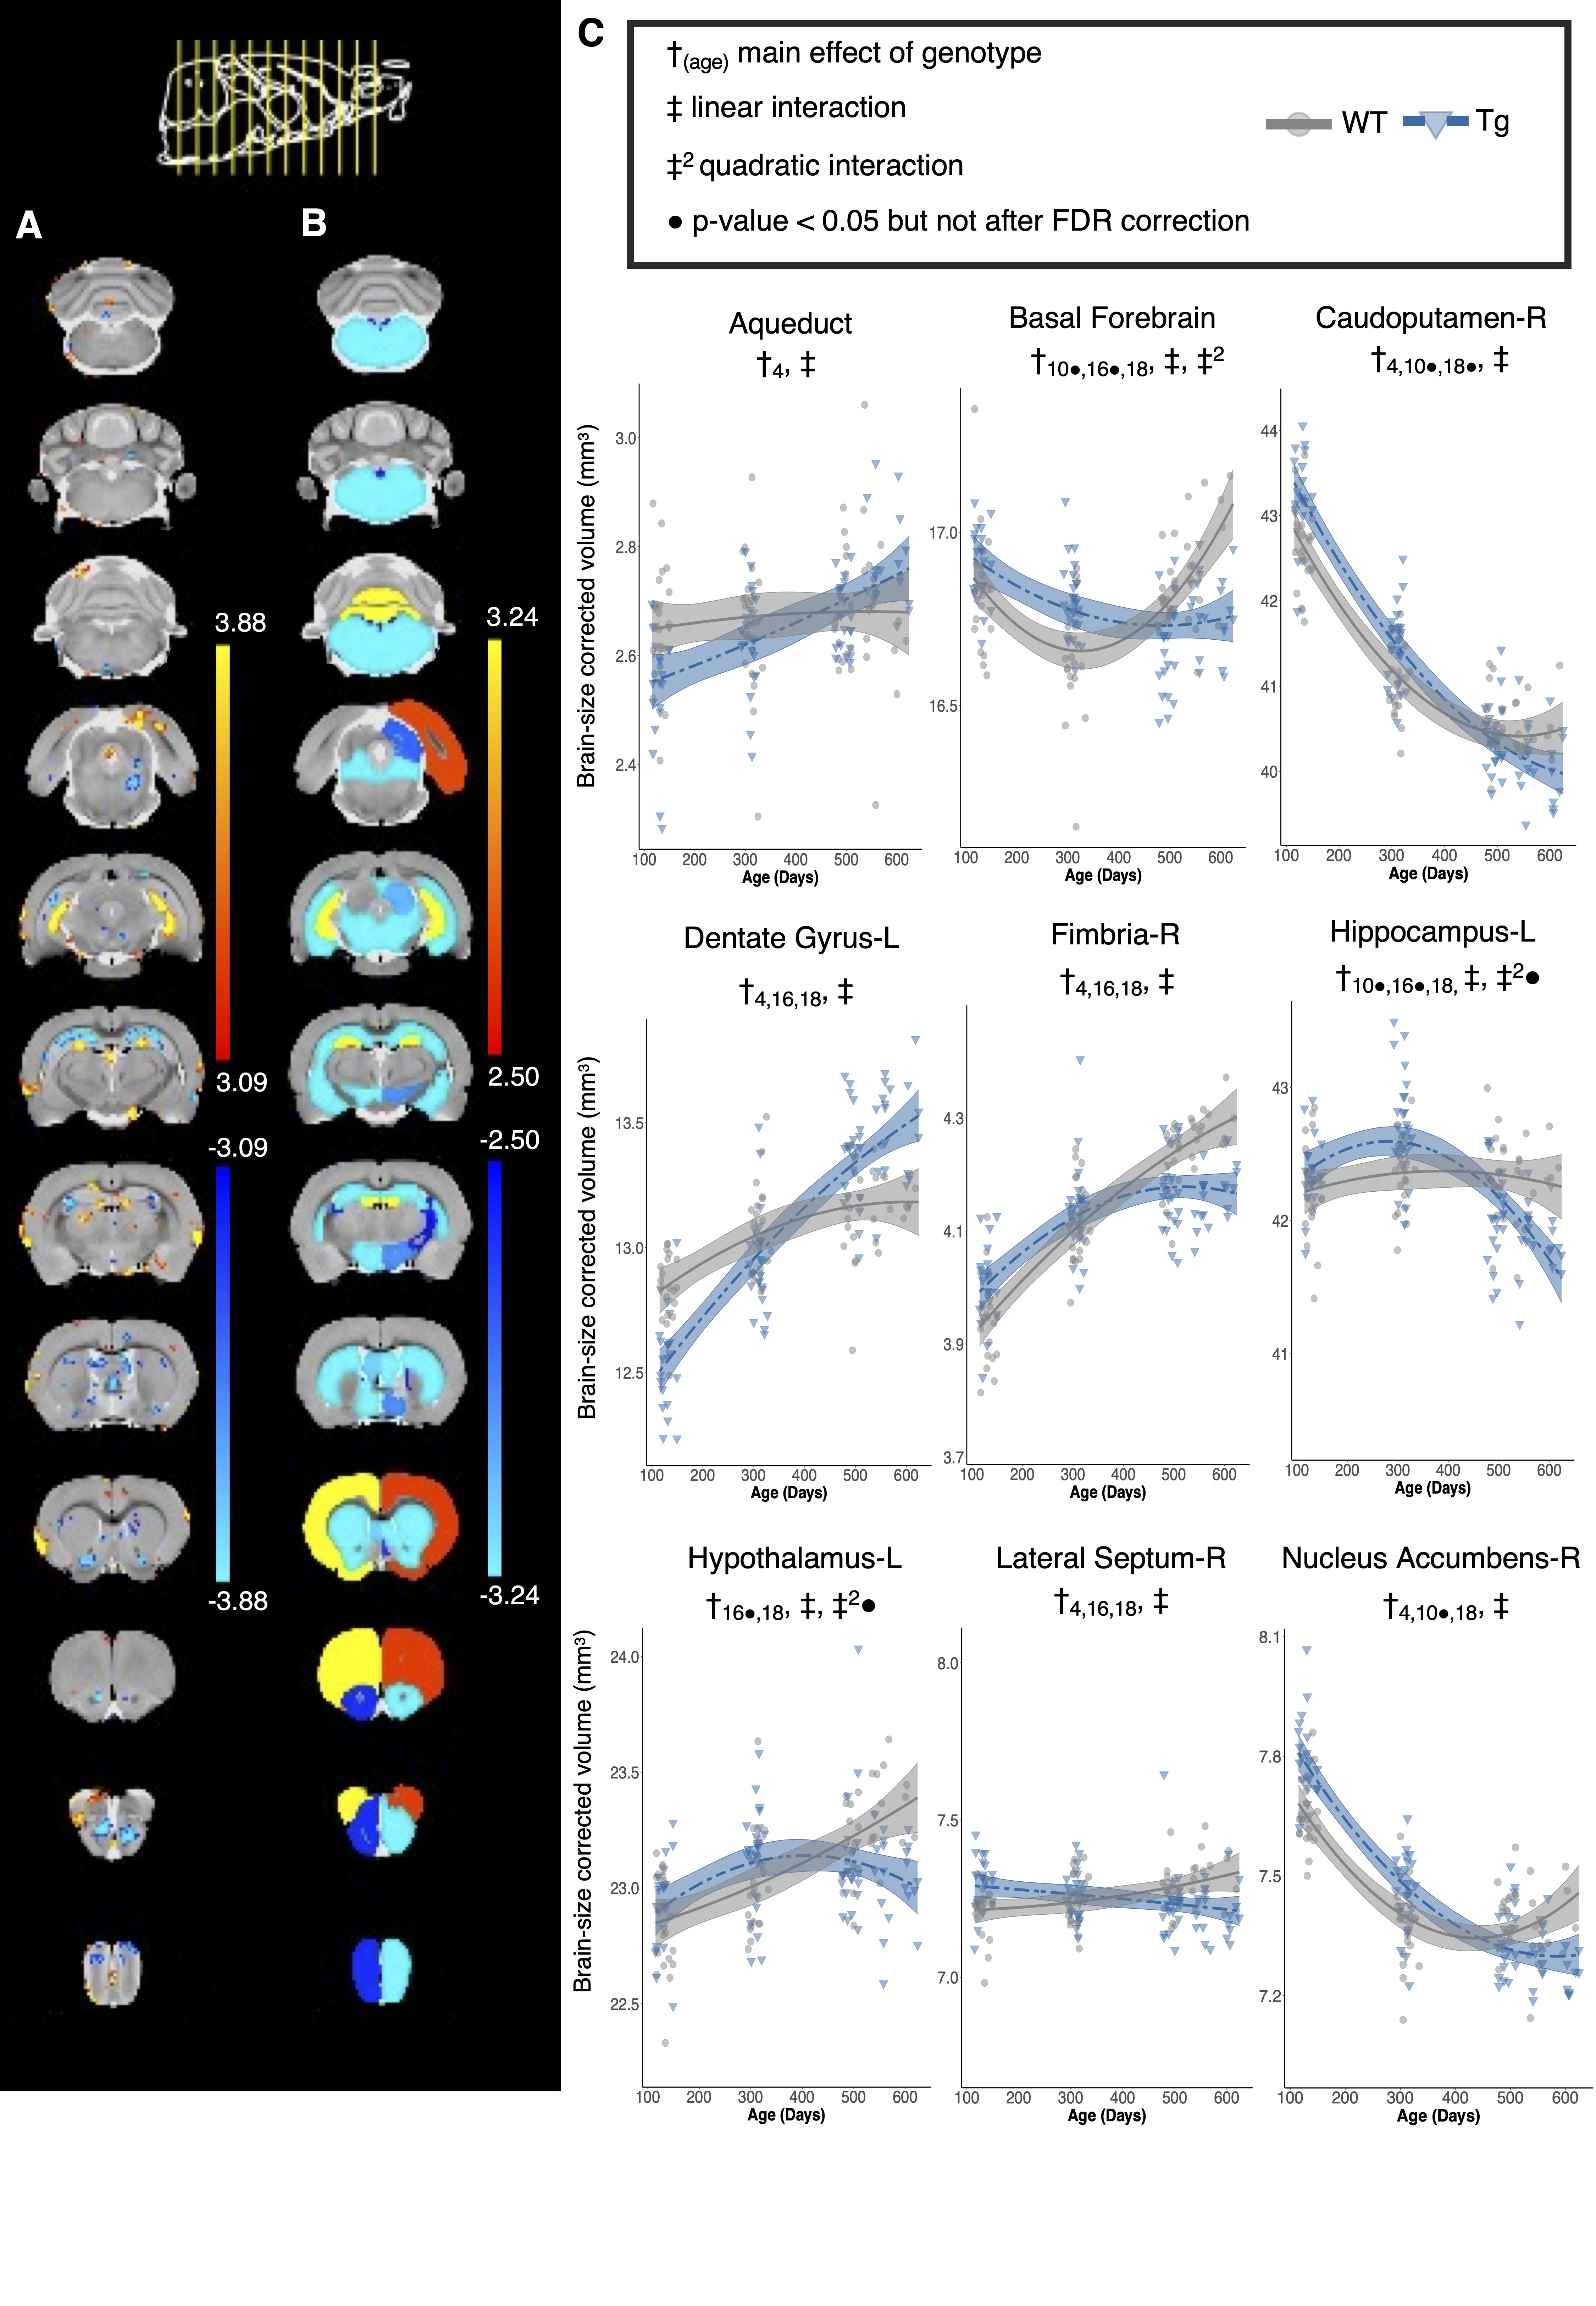
Figure 1: Genotype-dependent differences in local brain volume with age. A) Voxel-wise and B) regional statistical maps for the linear age by genotype interaction term. The plot range displays effects significant between 5 and 1% FDR, with t-values above 1% displayed at the 1% value. C) Volume trajectories in wildtype (WT) and TgF344-AD (Tg) rats. The model used to fit the data is represented by a line of best fit and 95% confidence interval.
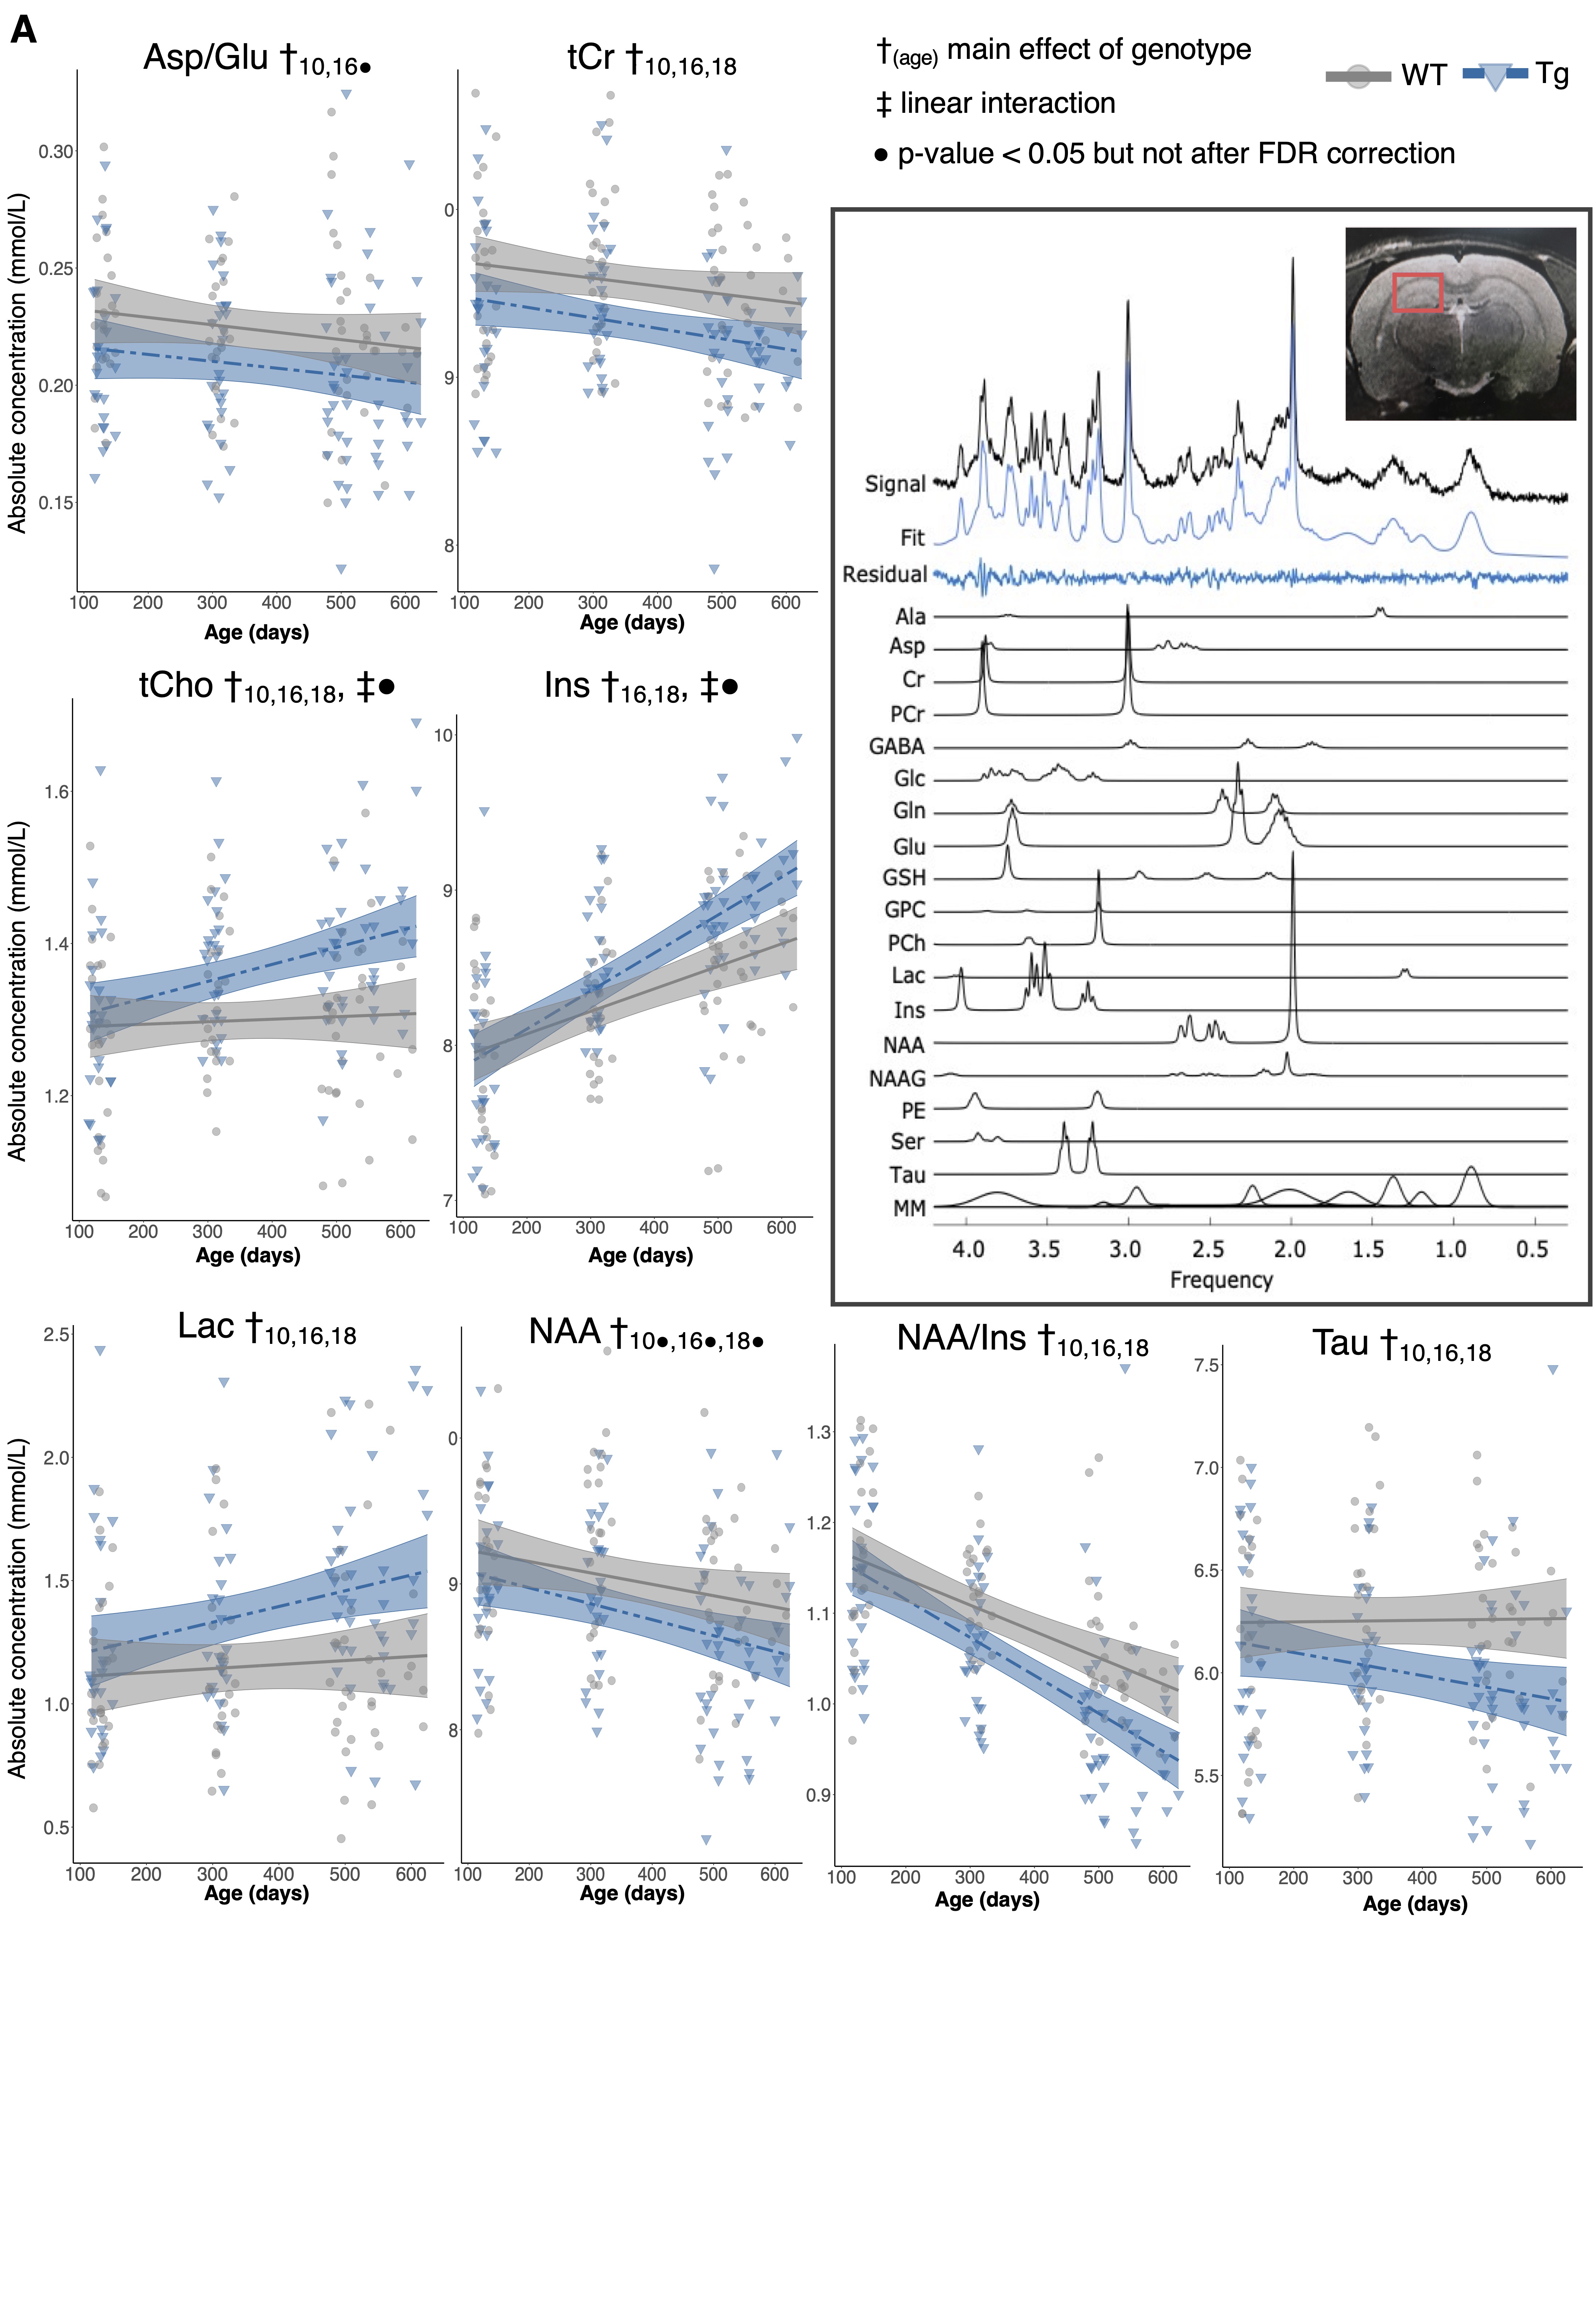
Figure 2: Neurochemical abnormalities exist by 10 months of age in the TgF344-AD rat. A) neurochemical concentration trajectories in wildtype (WT) and TgF344-AD (Tg) rats. The mixed effects model used to fit the data is represented by a line of best fit and 95% prediction interval (shaded). Inset: A representative MRS spectrum obtained from a female Tg rat at 4-months, with individual metabolite fit components shown below. Positioning of the voxel around the hippocampus is shown in red.
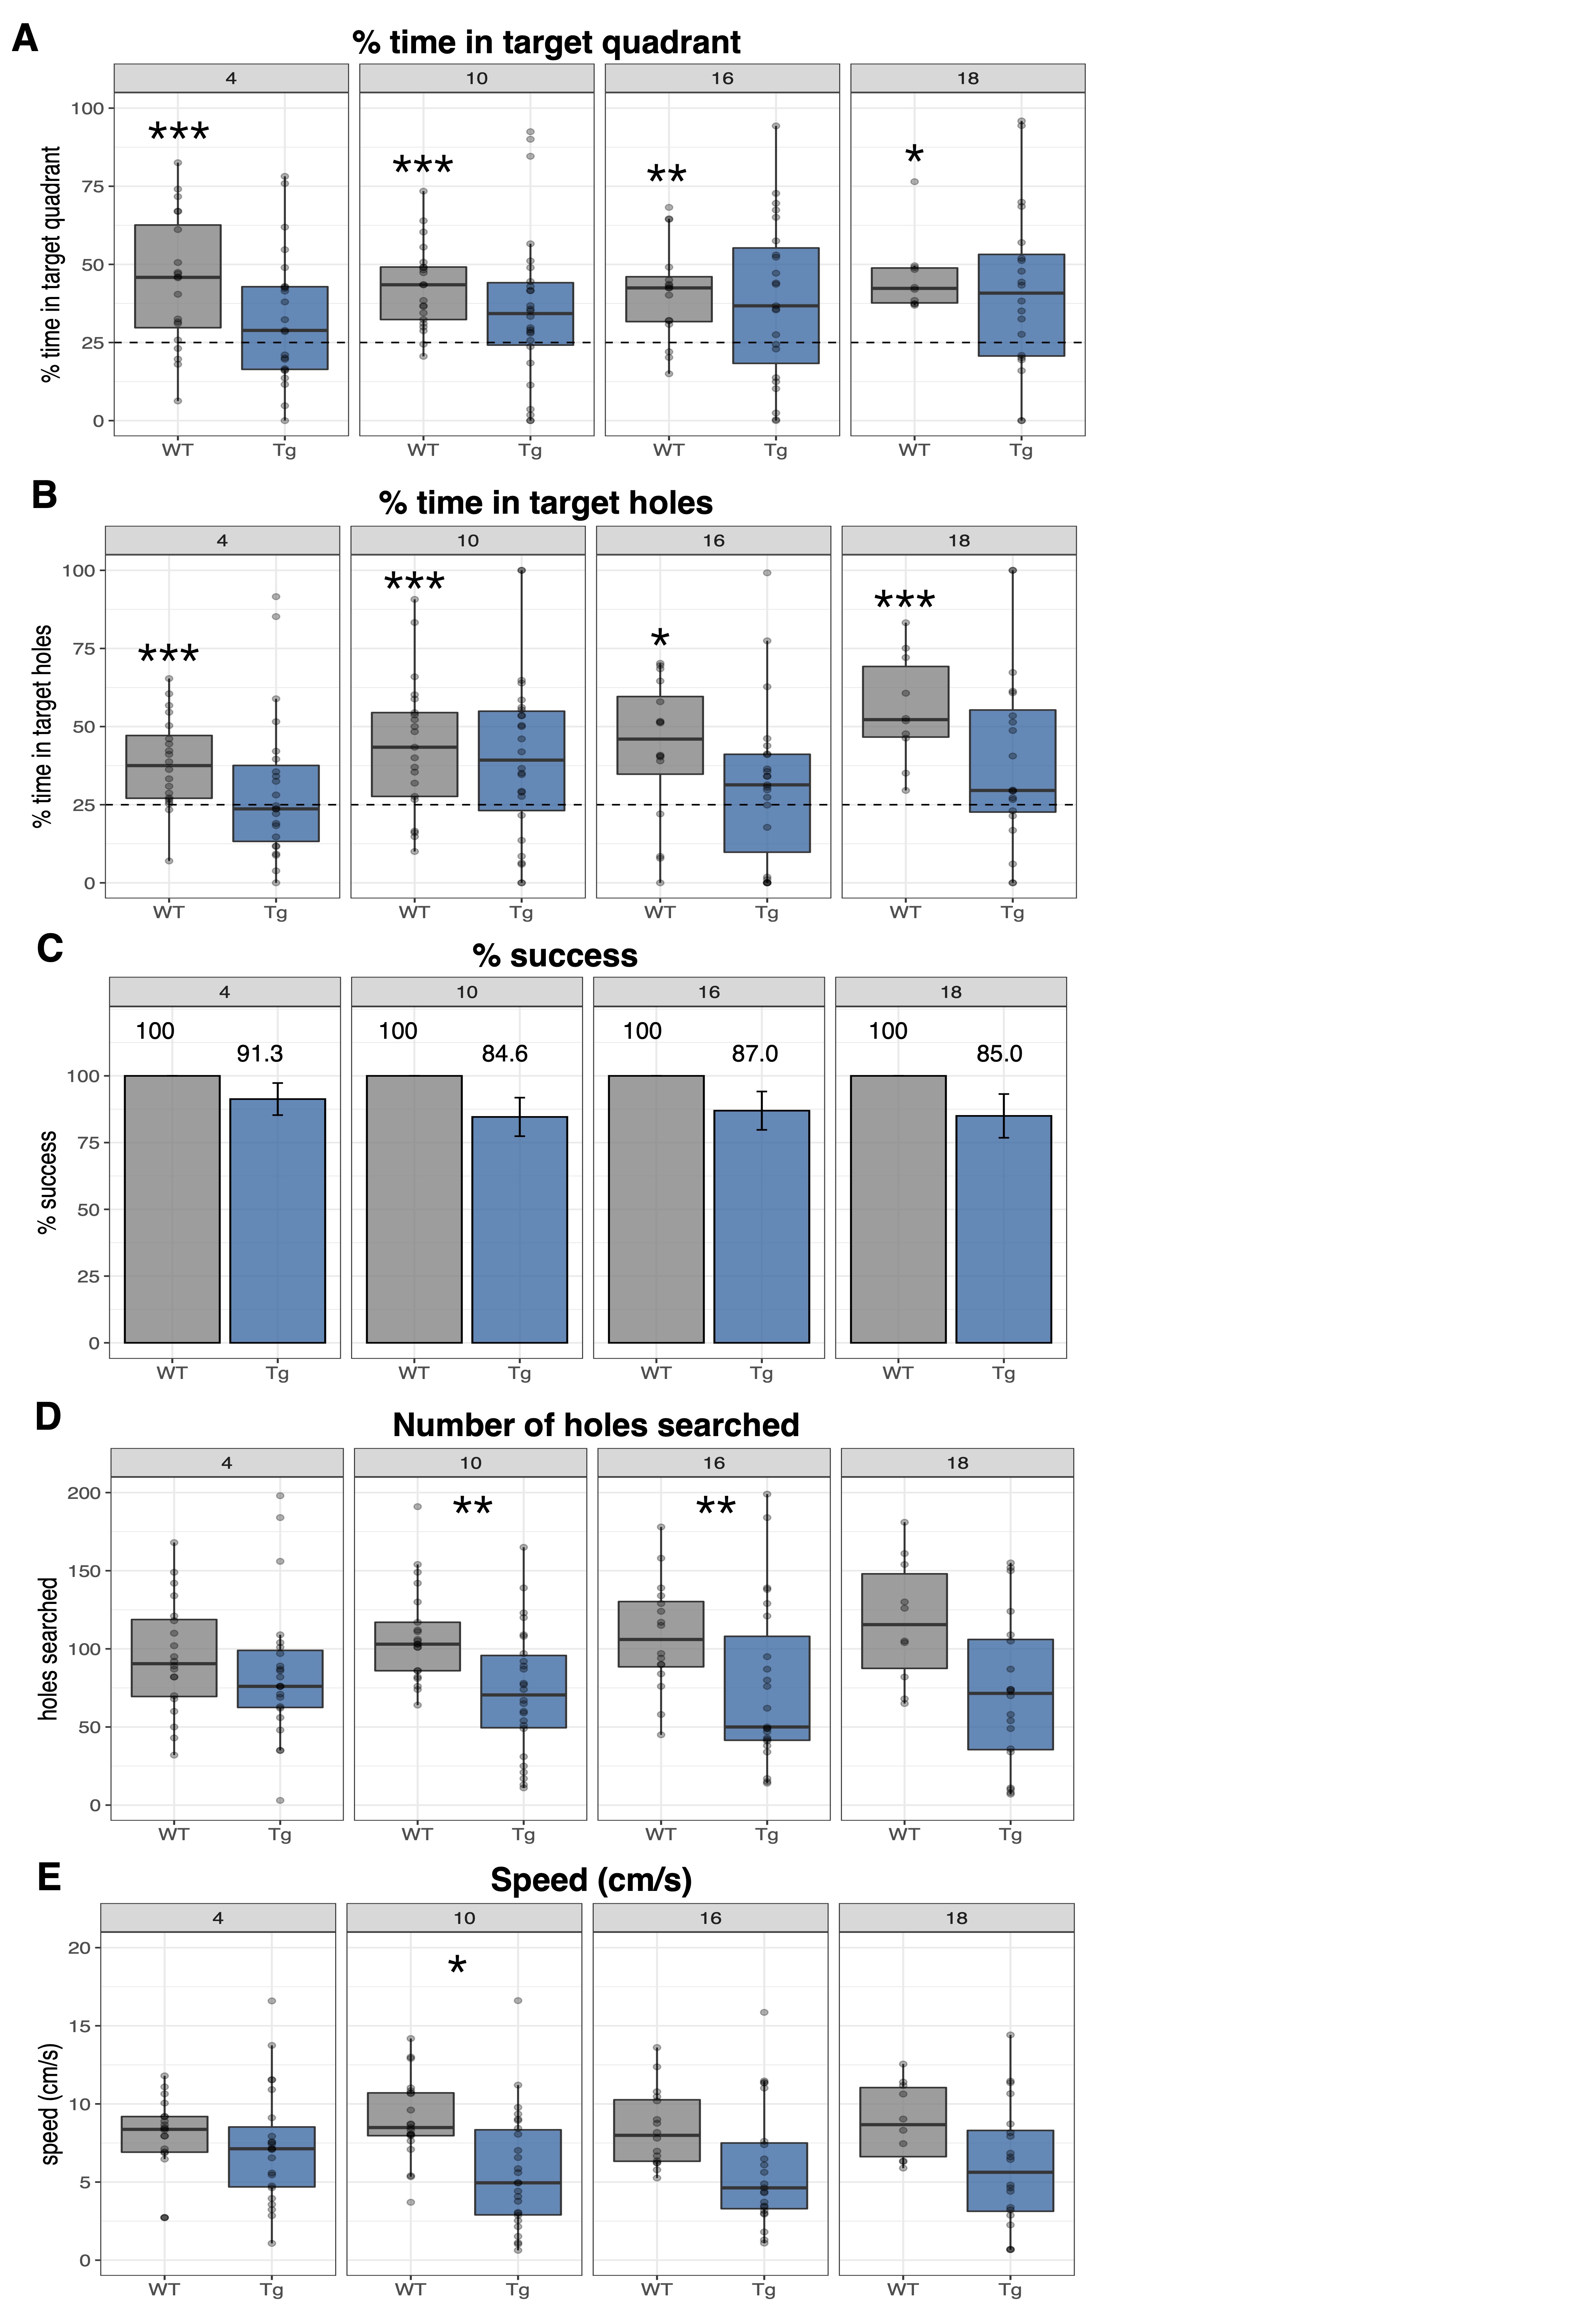
Figure 3: Barnes Maze probe trial data reveal cognitive impairment as early as 4-months of age. (A) % time spent in the target quadrant and (B) % time in target holes were analyzed via a one-sample t-test for each group against a mean of 25%. (C) % success, (D) number of holes searched, and (E) speed (cm/s) were analyzed via a linear model that included either a main effect of genotype, covarying for sex. *p<0.00714, **p<0.005, ***p<0.001.
DOI: https://doi.org/10.58530/2022/3254