3253
Association of Blood Biomarkers and Brain Tissue Volume Loss in Patients of Mild Cognitive Impairment and Alzheimer’s Disease1Radiology, Kyung Hee University Hospital at Gangdong, Seoul, Korea, Republic of, 2Radiology, Kyung Hee University Hospital, Seoul, Korea, Republic of, 3Surgery & Neurology, Bundang Hospital, Seongnam city, Korea, Republic of, 4Biomedical Engineering, Kyung Hee University, Yongin-si, Korea, Republic of, 5Neurology, Kyung Hee University Hospital at Gangdong, Seoul, Korea, Republic of
Synopsis
To report the values of a battery of blood inflammatory biomarkers from cognitive normal (CN) to Alzheimer’s disease (AD) in our reasonably sized patient cohort and to evaluate the association between gray matter volume (GMV) loss in AD and plasma levels of blood biomarkers, we included 38 elderly CN elderly, 40 mild cognitive impairment (MCI), and 33 AD subjects and obtained blood biomarkers and GMV. We found that GMV was negatively associated with the levels of IL1b, P-tau, and T-tau. There were no significant associations between brain tissue volumes and the levels of mAβ, NLRP3, miR155, oAβ, and Nogo-A.
Background
Activation of the inflammatory cascade is a known pathophysiologic process in Alzheimer’s disease (AD) with yet non-standardized scientific data regarding relationship to disease process. The understanding of the time course of expression of blood inflammatory biomarker levels from cognitive normal (CN) to AD is an important step toward using these biomarkers to predict disease progression and/or early management to the memory decline (1, 2). However, there are not many studies to determine the association between certain blood-based biomarkers and loss of brain tissue volumes in AD and MCI patients.Purpose
The objectives of the current study are 1) to report the time course and values of a battery of blood inflammatory biomarkers from CN to AD in our reasonably sized patient cohort and 2) to evaluate the association between GMV loss in AD and plasma levels of blood biomarkers. Targeted blood-based biomarkers used in this study were monomer Aβ (mAβ), oligomeric Aβ (oAβ), NLRP3, IL1b, miR155, neurite outgrowth inhibitor A (Nogo-A), P-tau, and T-tau. We hypothesized that GMV loss in AD may be associated with plasma levels of blood biomarkers.Methods
Participants: Our institutional review board approved this study and informed consent was obtained from all participants. The participants included 38 elderly CN, 40 mild cognitive impairment (MCI), and 33 AD subjects.Blood: We characterized the time course and values of a battery of blood inflammatory biomarkers, which are amyloid beta-monomer, amyloid beta-oligomer (3), interleukin-1 beta (IL-1β), micro RNA155 (miR155) (4), pyrin domain containing3 (NLRP3) (5), Nogo-A, protein total tau (p-tau) and phosphorylated tau protein (total tau, t-tau). Plasma images were taken by LSM710 confocal microscopy (Carl Zeiss, Jena, Germany). Using this method, we could accurately and simultaneously monitor miR155 and each antibody-QD525 level in the plasma in vitro.
MRI acquisition: MRI was performed using a 3.0 Tesla MRI system equipped with a 32-channel sensitivity encoding head coil (Achieva, Philips Medical Systems, Best, The Netherlands). To investigate the relationship between the blood biomarkers and the brain tissue volumes, a sagittal structural three-dimensional (3D) T1-weighted (T1W) image was acquired using a turbo field echo sequence which is similar to the magnetization-prepared rapid acquisition of gradient echo (MPRAGE) sequence.
Imaging processing: The following post-processing steps were performed using Statistical Parametric Mapping version 12 (SPM12) software (Wellcome Department of Imaging Neuroscience, University College, London, UK). The 3D T1W image was segmented into gray matter, white matter, and CSF, and spatially normalized into our dementia template (6). The spatially normalized gray matter and white matter volumes were smoothed using the Gaussian kernel of 8× 8× 8 mm3 fullwidth at half-maximum (FWHM) for the voxel-based statistical analyses.
Statistical analyses: To assess the relationship between GMV or WMV loss in all participants and each level of the blood biomarkers, the voxel-based multiple regression analysis was performed for GMV and WMV, separately. We evaluated the negative or positive association of GMV and WMV with the levels of each plasma biomarker. For the ROI-based analysis, atlas-based ROIs were defined at the bilateral hippocampi, parahippocampal gyrus, precuneus, middle temporal gyrus, middle frontal gyrus, and middle occipital gyrus using wfu_pickAtlas software (https://www.nitrc.org/projects/wfu_pickatlas/). To investigate the relationship of GMV and WMV values with the levels of the blood biomarker for each ROI, we performed a partial correlation analysis.
Results
The result shows that blood concentration of inflammatory biomarkers shows patterns among the groups (CN vs. MCI vs. AD, p-values < 0.05 for each marker). ABM and IL-1β showed increasing tendency in CN and MCI groups. NLRP3 showed decreasing tendency, otherwise, ABO and Nogo-A showed tending to opposite in late MCI and AD groups. P-tau and t-tau were significantly increased in the AD group. Increased expression of key biomarkers including IL-1β, p-tau, and t-tau were significant predictors of AD progression.GMV was negatively associated with the levels of IL1b, P-tau, and T-tau. WMV was negatively associated with the T-tau level. There were no significant associations between brain tissue volumes and the levels of mAβ, NLRP3, miR155, oAβ, and Nogo-A. The levels of IL1b, P-tau, and T-tau were significantly negatively correlated with GMV and WMV mainly at the hippocampus, parahippocampus, and precuneus.
Conclusion
This study shows that inflammatory biomarkers in blood are potential biomarkers of AD progression. So they could prove beneficial in the future assessment of AD severity and response to treatment after AD diagnosis. A single biomarker may not be adequate to delineate the pathophysiology of AD completely. Instead, a combination of multiple markers representing a different stage of disease progression is the best strategy. The levels of IL1b, P-tau, and T-tau were significantly negatively correlated with GMV and WMV mainly at the hippocampus, parahippocampus, and precuneus. Although the use of inflammatory mediators as peripheral AD biomarkers has yet to be established, further studies are needed given the link between inflammation and AD.Acknowledgements
This research was supported by a grant of the Korea Health Technology R&D Project through the Korea Health Industry Development Institute (KHIDI), funded by the Ministry of Health & Welfare and Ministry of Science and ICT, Republic of Korea (HU21C0086, GHJ).References
1)Greenberg, N., A. et al., Electrophoresis, 2009; 30: 1235-9. 2)Oresic, M., et al., Transl Psychiatry, 2011: 1: e57. 3) Koffie, R. M., M. et al., Proc Natl Acad Sci U S A, 2009; 106: 4012-7. 4) Song, J., and J. E. Lee. Front Aging Neurosci, 2015; 7: 61. 5) Halle, A., V. et al.. Nat Immunol, 2008; 9: 857-65. 6) Guo, X.Y., et al., Quant Imaging Med Surg 2021;11(6):2224-2244Figures
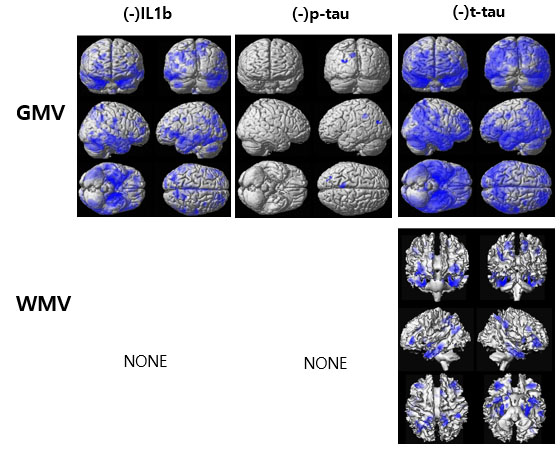
Figure 1. Results of the voxel-based multiple regression analyses between gray matter volume (GMV) or white matter volume (WMV) of all participants and the levels of the blood-based biomarkers adjusting for participant’s age and the education-year
The blue color indicates the negative relationship between the brain tissue volumes and the levels of IL1b, p-tau, and t-tau. There were no significant correlations between brain tissue volumes and the levels of monomer Aβ (mAβ), NLRP3, miR155, oligomer Aβ (oAβ), and Nogo-A.