3252
Evidence from dual-calibrated fMRI for raised mitochondrial oxygen tension in the MS brain1Department of Neuroscience, Imaging and Clinical Sciences, University G. D'Annunzio of Chieti Pescara, Chieti Scalo, Italy, 2CUBRIC, School of Psychology, Cardiff University, Cardiff, United Kingdom, 3Helen Durham Centre for Neuroinflammation, University Hospital of Wales, Cardiff, United Kingdom, 4MS Centre, Neurology Unit, “SS. Annunziata” University Hospital, Chieti, Italy, 5Division of Psychological Medicine and Clinical Neurosciences, University Hospital of Wales, Cardiff, United Kingdom, 6School of Physics and Astronomy, Cardiff University, Cardiff, United Kingdom
Synopsis
Dysfunction of energy supply or usage may be present in Multiple Sclerosis. We investigated the use of a simple oxygen diffusion model to infer mitochondrial oxygen tension from dual-calibrated fMRI (dc-fMRI) data. We observed a significant reduction of grey matter CBF and CMRO2 in people with MS but no significant difference in OEF or BOLD-sensitive blood volume. Assuming no substantial tissue or vascular remodelling in MS, these results imply, within a simple flow-diffusion model of oxygen from capillaries into the tissue, an elevated partial pressure of oxygen at the mitochondria which may indicate mitochondrial dysfunction.
Introduction
Multiple sclerosis (MS) is a chronic inflammatory disease of the central nervous system leading to demyelination, neurodegeneration and axonal loss. Dysfunction of energy supply or usage in brain tissue are possible disease mechanisms1 that are consistent with observations of reduced brain oxygen consumption2. Studies have reported mitochondrial dysfunction in MS that may contribute to damage and loss of both axons and neurons3,4. We currently lack non-invasive methods to assess mitochondrial function in the human brain. Here we investigate the use of a simple oxygen diffusion model to infer mitochondrial oxygen tension from dual-calibrated fMRI (dc-fMRI) data.We have previously conducted a dc-fMRI experiment in patients with MS and comparator healthy controls to estimate global grey matter (GM) CBF, CMRO2, OEF and deoxy-hemoglobin sensitive blood volume (CBVdHb)5. The method relies on modulating CBF and blood oxygenation with hypercapnia and hyperoxia while measuring resulting MR signals changes from combined ASL CBF and BOLD-sensitive fMRI6. Here, we develop further the biophysical signal model describing the diffusion of oxygen from the capillaries to mitochondria and use it to estimate capillary blood volume and mitochondrial partial pressure of oxygen.
Methods
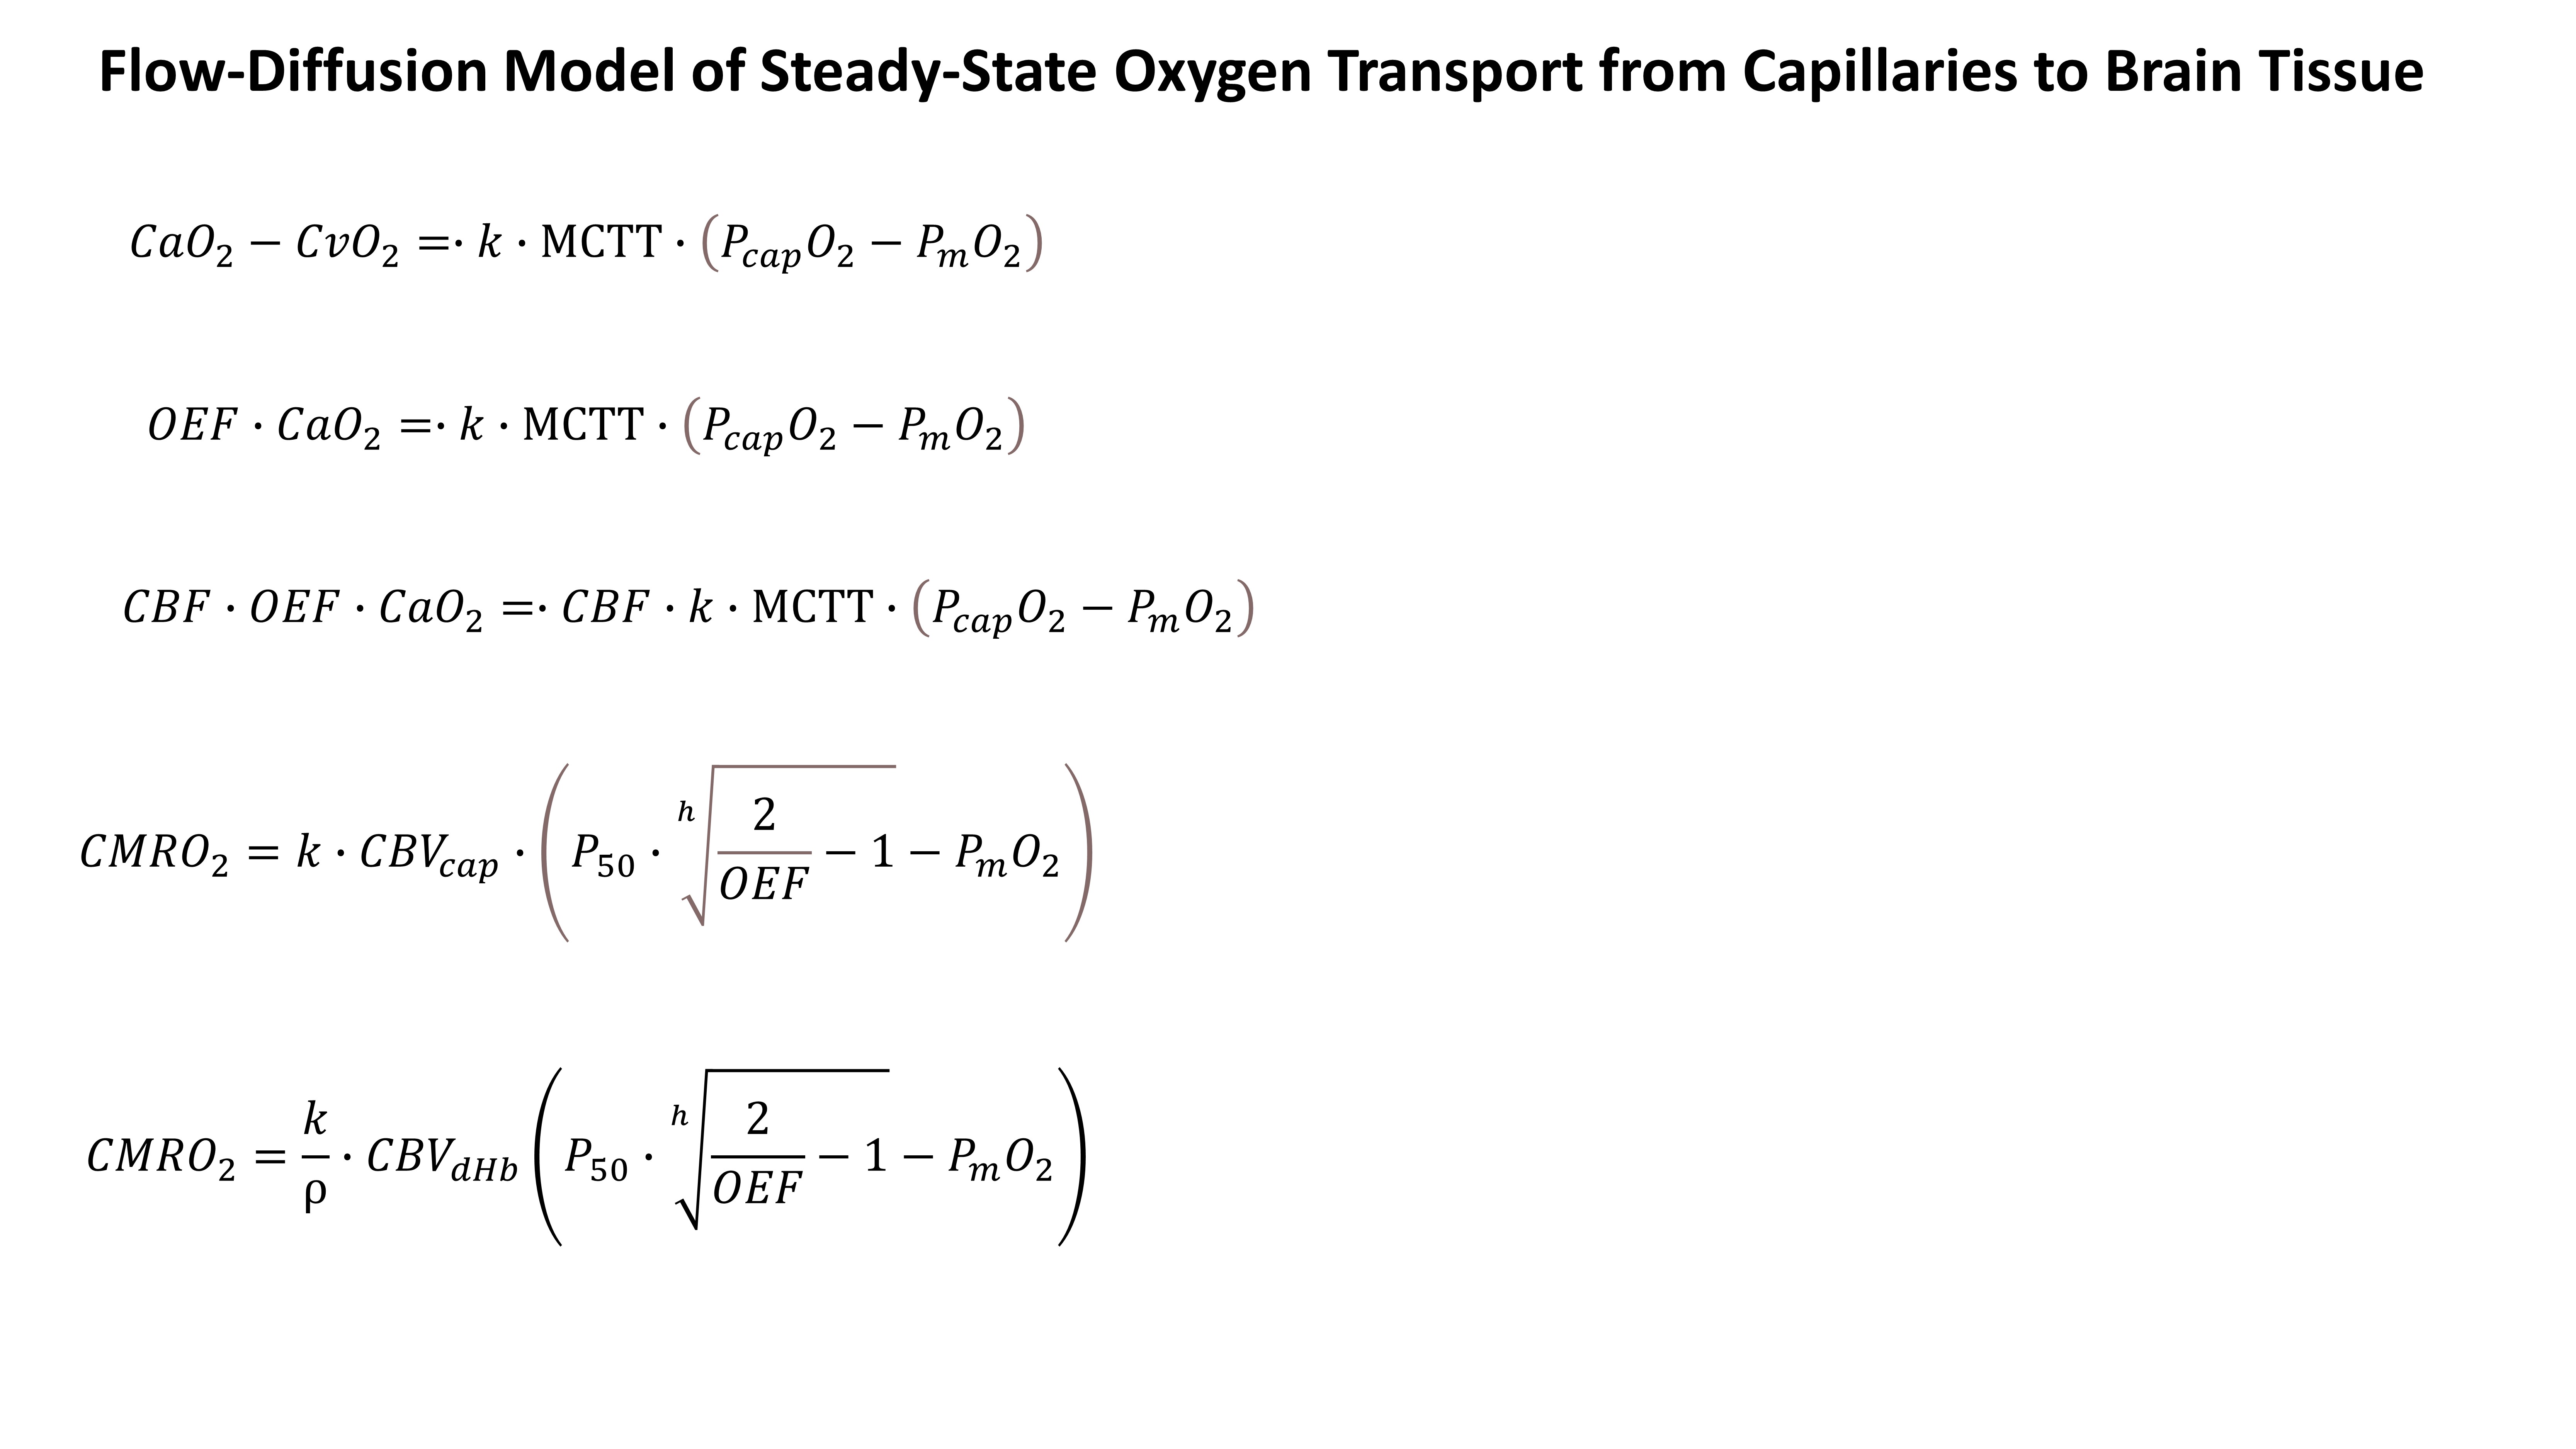
A simple model of oxygen transport7 (Figure 1) describes the steady-state oxygen diffusion from the capillaries into the tissue as proportional to the product of the mean capillary transit time (MCTT) and the pressure gradient between capillaries and mitochondria, with a proportionality constant k (effective oxygen permeability of the tissue). The partial pressure of oxygen at the capillaries (PcapO2) can be expressed as a function of OEF and the Hill coefficient (h) of oxygen binding to haemoglobin . The MCTT is simply the ratio of the capillary CBV (CBVcap) and cerebral perfusion (CBF), where CBVcap can be expressed as a fraction of the deoxyheamoglobin weighted blood volume (CBVdHb, ρ=CBVdHb/CBVcap). By making these substitutions we arrive at a model which is composed of variables estimated through the dc-fMRI experiment (CBF, CMRO2, OEF, CBVdHb, oxygen concentration in arteries, CaO2 and oxygen pressure in blood at 50% Hb saturation, P50) and two unknowns, one proportionality constant (k/ρ) and the mitochondrial oxygen pressure (PmO2).In-vivo data, after local ethical committee approval, were acquired in 22 patients with relapsing-remitting MS and 20 matched controls (HC), using a Siemens MAGNETOM Prisma 3T scanner with a 32-channel head coil. An 18 minute dc-fMRI scan was performed using a pCASL acquisition with a dual-excitation readout8,9 (τ=1.5 s, PLD=1.5s, GRAPPA factor= 3, TE1 = 10 ms, TE2 = 30 ms, effective TR= 4.4 s, res. 3.4 ×3.4 mm2, FOV = 208×208 mm2, 15 slices, slice thickness 7 mm, 20% gap) with 3 periods of hypercapnia alternated with 2 periods of hyperoxia and medical air10. End-tidal CO2 and O2 were recorded. A MPRAGE was acquired. CaO2 and P50 were evaluated from end-tidal O2 and CO210. dc-fMRI was analyzed using a machine learning procedure and global GM values were computed as average values within the GM mask11. GM PmO2 was estimated through a grid search approach using the oxygen transport model.To estimate GM PmO2, h was set equal to h=2.8 and k and ρ were assumed equal between MS and HC and were fixed to k=3 μmol/mmHg/ml/min and ρ=212.
Results
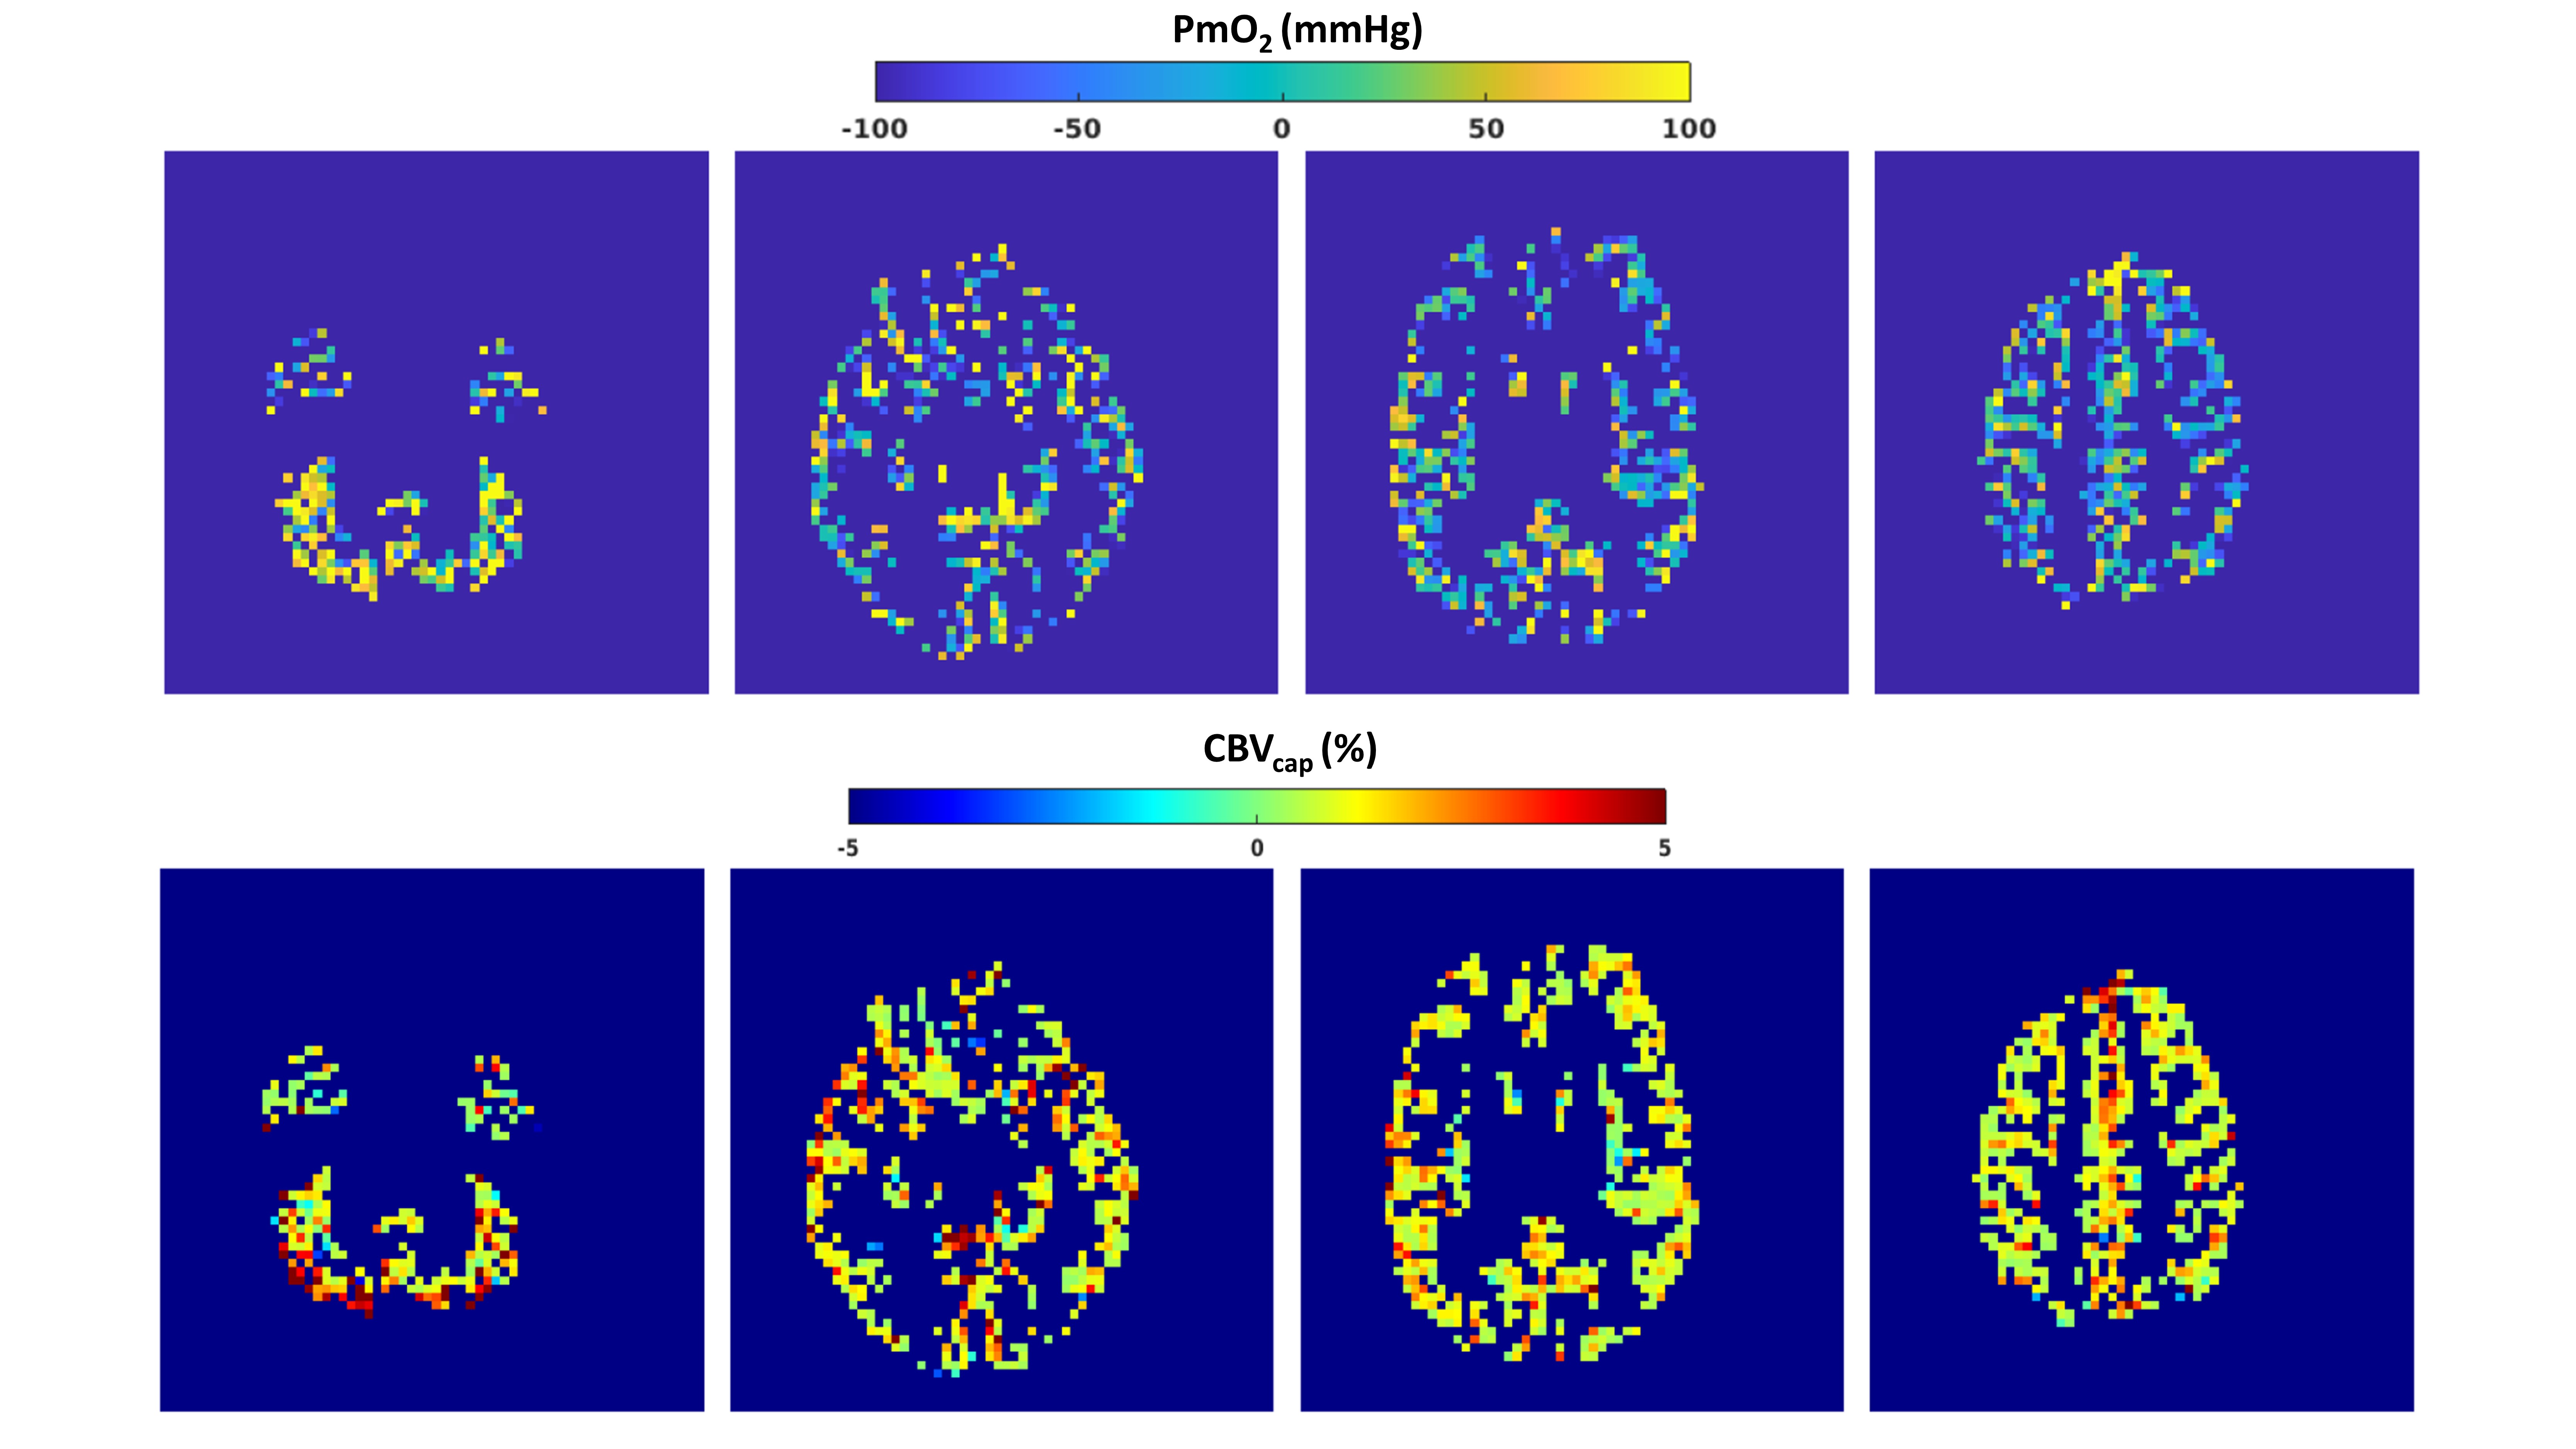
Figure 2 replicates and expands results reported in5 and shows the boxplots comparing dc-fMRI outcome between HC and MS. MS patients had significantly lower CBF (t=-2.84, df=40, p=6.9∙10-3) and CMRO2 (t=-3.48, df=40, p=1.2∙10-3) compared to HC. However, OEF and CBVdHb values were not significantly different in MS compared to HC (t=-1.11, df=40, p=0.27; t=-0.35, df=40, p=0.72).Figure 3 reports exemplar GM PmO2 and CBVcap maps obtained using dc-fMRI combined with the steady-state oxygen diffusion model for a participant of the study.
Figure 4 reports the boxplots comparing, between HC and MS patients, the results obtained with the steady-state oxygen diffusion model. MS patients had significantly higher PmO2 (t=2.2, df=40, p=0.03).
Discussion and Conclusion
From a dc-fMRI experiment, we observed a significant reduction of GM CBF and CMRO2 in people with MS but no significant difference in OEF or CBVdHb. We assume no substantial microvascular remodelling in GM in MS, namely, an unaltered ratio between CBVdHb and capillary CBVcap as well as no alteration to tissue permeability to oxygen. Under these assumptions and given the dc-fMRI results, the diffusion model suggests an elevated partial pressure of oxygen at the mitochondria which may indicate mitochondrial dysfunction. In the MS brain, mitochondrial dysfunction may be associated with the production of reactive oxygen species (ROS) and nitric oxide (NO) by continuously activated microglia in the cortex that lead to inhibition of oxidative phosphorylation and damage to mitochondrial DNA. The damage could reduce ATP production, inducing a state of “virtual hypoxia”, which may eventually fully compromise mitochondrial functional and lead to neuronal cell death4,13,14. Our MRI-based approach may offer a marker of early physiological alterations in MS in the form of mitochondrial dysfunction.Acknowledgements
This project was supported by the UK Engineering and Physical Sciences Research Council (grant numbers EP/K020404/1 and EP/S025901/1). HLC and MG were funded by a Wellcome Strategic Award to CUBRIC, ‘Multi-scale and multi-modal assessment of coupling in the healthy and diseased brain’, grant reference 104943/Z/14/Z. RS, CF and EP were supported by a Wellcome PhD studentships. We thank the patients with MS and their families, along with the healthy volunteers, for their time and support that made this research possible.References
1. Paling D, Golay X, Wheeler-Kingshott C, Kapoor R, Miller D. Energy failure in multiple sclerosis and its investigation using MR techniques. J Neurol 2011; 258: 2113–2127.
2. Ge Y, Zhang Z, Lu H, Tang L, Jaggi H, Herbert J et al. Characterizing brain oxygen metabolism in patients with multiple sclerosis with T2-relaxation-under-spin-tagging MRI. J Cereb Blood Flow Metab Off J Int Soc Cereb Blood Flow Metab 2012; 32: 403–412.
3. Beal MF. Aging, energy, and oxidative stress in neurodegenerative diseases. Ann Neurol 1995; 38: 357–366.
4. Witte ME, Mahad DJ, Lassmann H, van Horssen J. Mitochondrial dysfunction contributes to neurodegeneration in multiple sclerosis. Trends Mol Med 2014; 20: 179–187.
5. Chandler HL, Stickland RC, Germuska M, Patitucci E, Foster C, Bhome-Dhaliwal S et al. Using dual-calibrated functional MRI to map brain oxygen supply and consumption in multiple sclerosis. bioRxiv 2021; : 2021.01.07.425819.
6. Germuska M, Wise RG. Calibrated fMRI for mapping absolute CMRO2: Practicalities and prospects. NeuroImage 2019; 187: 145–153.
7. Gjedde A. Cerebral Blood Flow Change in Arterial Hypoxemia Is Consistent with Negligible Oxygen Tension in Brain Mitochondria. NeuroImage 2002; 17: 1876–1881.
8. Okell TW, Chappell MA, Kelly ME, Jezzard P. Cerebral Blood Flow Quantification Using Vessel-Encoded Arterial Spin Labeling. J Cereb Blood Flow Metab 2013; 33: 1716–1724.
9. Schmithorst VJ, Hernandez-Garcia L, Vannest J, Rajagopal A, Lee G, Holland SK. Optimized Simultaneous ASL and BOLD Functional Imaging of the Whole Brain. J Magn Reson Imaging JMRI 2014; 39: 1104–1117.
10. Germuska M, Chandler HL, Stickland RC, Foster C, Fasano F, Okell TW et al. Dual-calibrated fMRI measurement of absolute cerebral metabolic rate of oxygen consumption and effective oxygen diffusivity. NeuroImage 2019; 184: 717–728.
11. Germuska M, Chandler HL, Okell T, Fasano F, Tomassini V, Murphy K et al. A Frequency-Domain Machine Learning Method for Dual-Calibrated fMRI Mapping of Oxygen Extraction Fraction (OEF) and Cerebral Metabolic Rate of Oxygen Consumption (CMRO2). Front Artif Intell 2020; 3. doi:10.3389/frai.2020.00012.
12. Germuska M, Stickland RC, Chiarelli AM, Chandler HL, Wise RG. Quantitative mapping of cerebral oxygen metabolism using breath-hold calibrated fMRI. bioRxiv 2021; : 2021.04.08.438939.
13. Witte ME, Geurts JJG, de Vries HE, van der Valk P, van Horssen J. Mitochondrial dysfunction: a potential link between neuroinflammation and neurodegeneration? Mitochondrion 2010; 10: 411–418.
14. Trapp BD, Stys PK. Virtual hypoxia and chronic necrosis of demyelinated axons in multiple sclerosis. Lancet Neurol 2009; 8: 280–291.
Figures