3248
Morphological 5T MRI of hip in comparison to 3T: An initial study1Shanghai Institute of Medical Imaging, Shanghai, China, 2United Imaging Healthcare, Shanghai, China, 3Department of Radiology, Zhongshan Hospital, Fudan University, Shanghai, China
Synopsis
Imaging the hip cartilage using magnetic resonance imaging (MRI) is more challenging compared with other joints. The utilize of higher magnetic field strengths (>3T) is able to improve the assessment of cartilage structures in the hip. In this study we evaluated morphological 5T hip MRI in healthy subjects and compared image quality at 5T with 3T MRI. The results revealed that morphological 5T hip MRI in healthy subjects was superior to 3T MRI in image quality, visibility of the anatomical structures and contrast ratios.
Introduction
Because of the spherical shape of the joint, the close contact between acetabular and femoral cartilage surface, and the deep anatomical region, imaging the hip cartilage using magnetic resonance imaging (MRI) is more challenging compared with other joints [1]. One solution to improve the assessment of cartilage structures in the hip is the use of higher magnetic field strengths. The application of ultrahigh field MR scanners (7T) has already shown superiority over lower field strengths in imaging the musculoskeletal system, especially improvement in signal gain and spatial resolution [2-4]. Meanwhile, there are some considerable problems associated with ultrahigh field MR scanners, including radiofrequency (RF) deposition and B1 inhomogeneity [5]. The purposes of this study were to evaluate morphological 5T hip MRI in healthy subjects and to compare image quality with 3T MRI.Methods
This prospective study was approved by the institution's ethics committee. Twelve healthy subjects (9 men and 3 women, age 50.3±3.1) were enrolled. All subjects were scanned at 3T (uMR790, United Imaging Healthcare, Shanghai, China) and at 5T (uMR Jupiter, United Imaging Healthcare, Shanghai, China) using optimal coil setups for both field strengths. The 5T hip imaging protocol was adopted to be as equivalent as possible to 3T scanner to ensure a maximum of comparability. The measurement protocol for both field strengths consisted of (1) three-dimensional (3D) T1-weighted gradient echo in the sagittal plane (TE = 1.67 ms for 3T, TE = 1.62 ms for 5T; FA = 15° for 3T, FA = 20° for 5T. Other parameters were identical: TR = 3.76 ms, Bandwidth = 650 Hz, 60 slices, Slice thickness = 3mm, FOV = 300×360mm, Matrix = 379×456), (2) two-dimensional (2D) T2-weighted fat-saturated fast spin echo (FSE) in the transverse plane (TE = 128.52 ms for 3T, TE = 128.24 ms for 5T. Other parameters were identical: TR = 4200 ms, FA = 90°, Bandwidth = 200 Hz, 30 slices, Slice thickness = 5mm, FOV = 380×300mm, Matrix = 639×504), and (3) 2D proton-density (PD)-weighted fat-saturated FSE in the transverse plane (TR/TE/FA = 3500ms/43.12ms/120° for 3T, TR/TE/FA = 2850ms/32.34ms/110° for 5T. Other parameters were identical: Bandwidth = 200 Hz, 26 slices, Slice thickness = 3mm, FOV = 230×380mm, Matrix = 682×1128).Image analysis was performed by two radiologists in consensus (reader 1 and reader 2, with 12 and 7 years of experience in musculoskeletal radiology, respectively). A subjective field strength comparison regarding overall image quality and visibility of the anatomical structures (including labrum, greater trochanter, femoral head and neck, and acetabulum) was assessed by a 5-point scale (5 = 5T clearly superior, 4 = 5T slightly superior, 3 = 3T and 5T equal, 2 = 3T slightly superior, 1 = 3T clearly superior). Moreover, quantitative analysis was applied by calculate the contrast ratio (CR). Regions of interest (ROIs) was placed in a representative position of articular cartilage, fluid, cortical bone and labrum in all the sequences by reader 1. CR was subsequently calculated by CR = (signal ROI1 – signal ROI2)/(signal ROI1 + signal ROI2) as previously reported [6].
Statistical analysis was performed using SPSS Statistics version 21.0 (SPSS Inc., Chicago, United States). All the values were expressed as mean ± standard deviation. Contrast ratios were compared between the field strengths using Wilcoxon rank-sum test. P < 0.05 was considered statistically significant.
Results
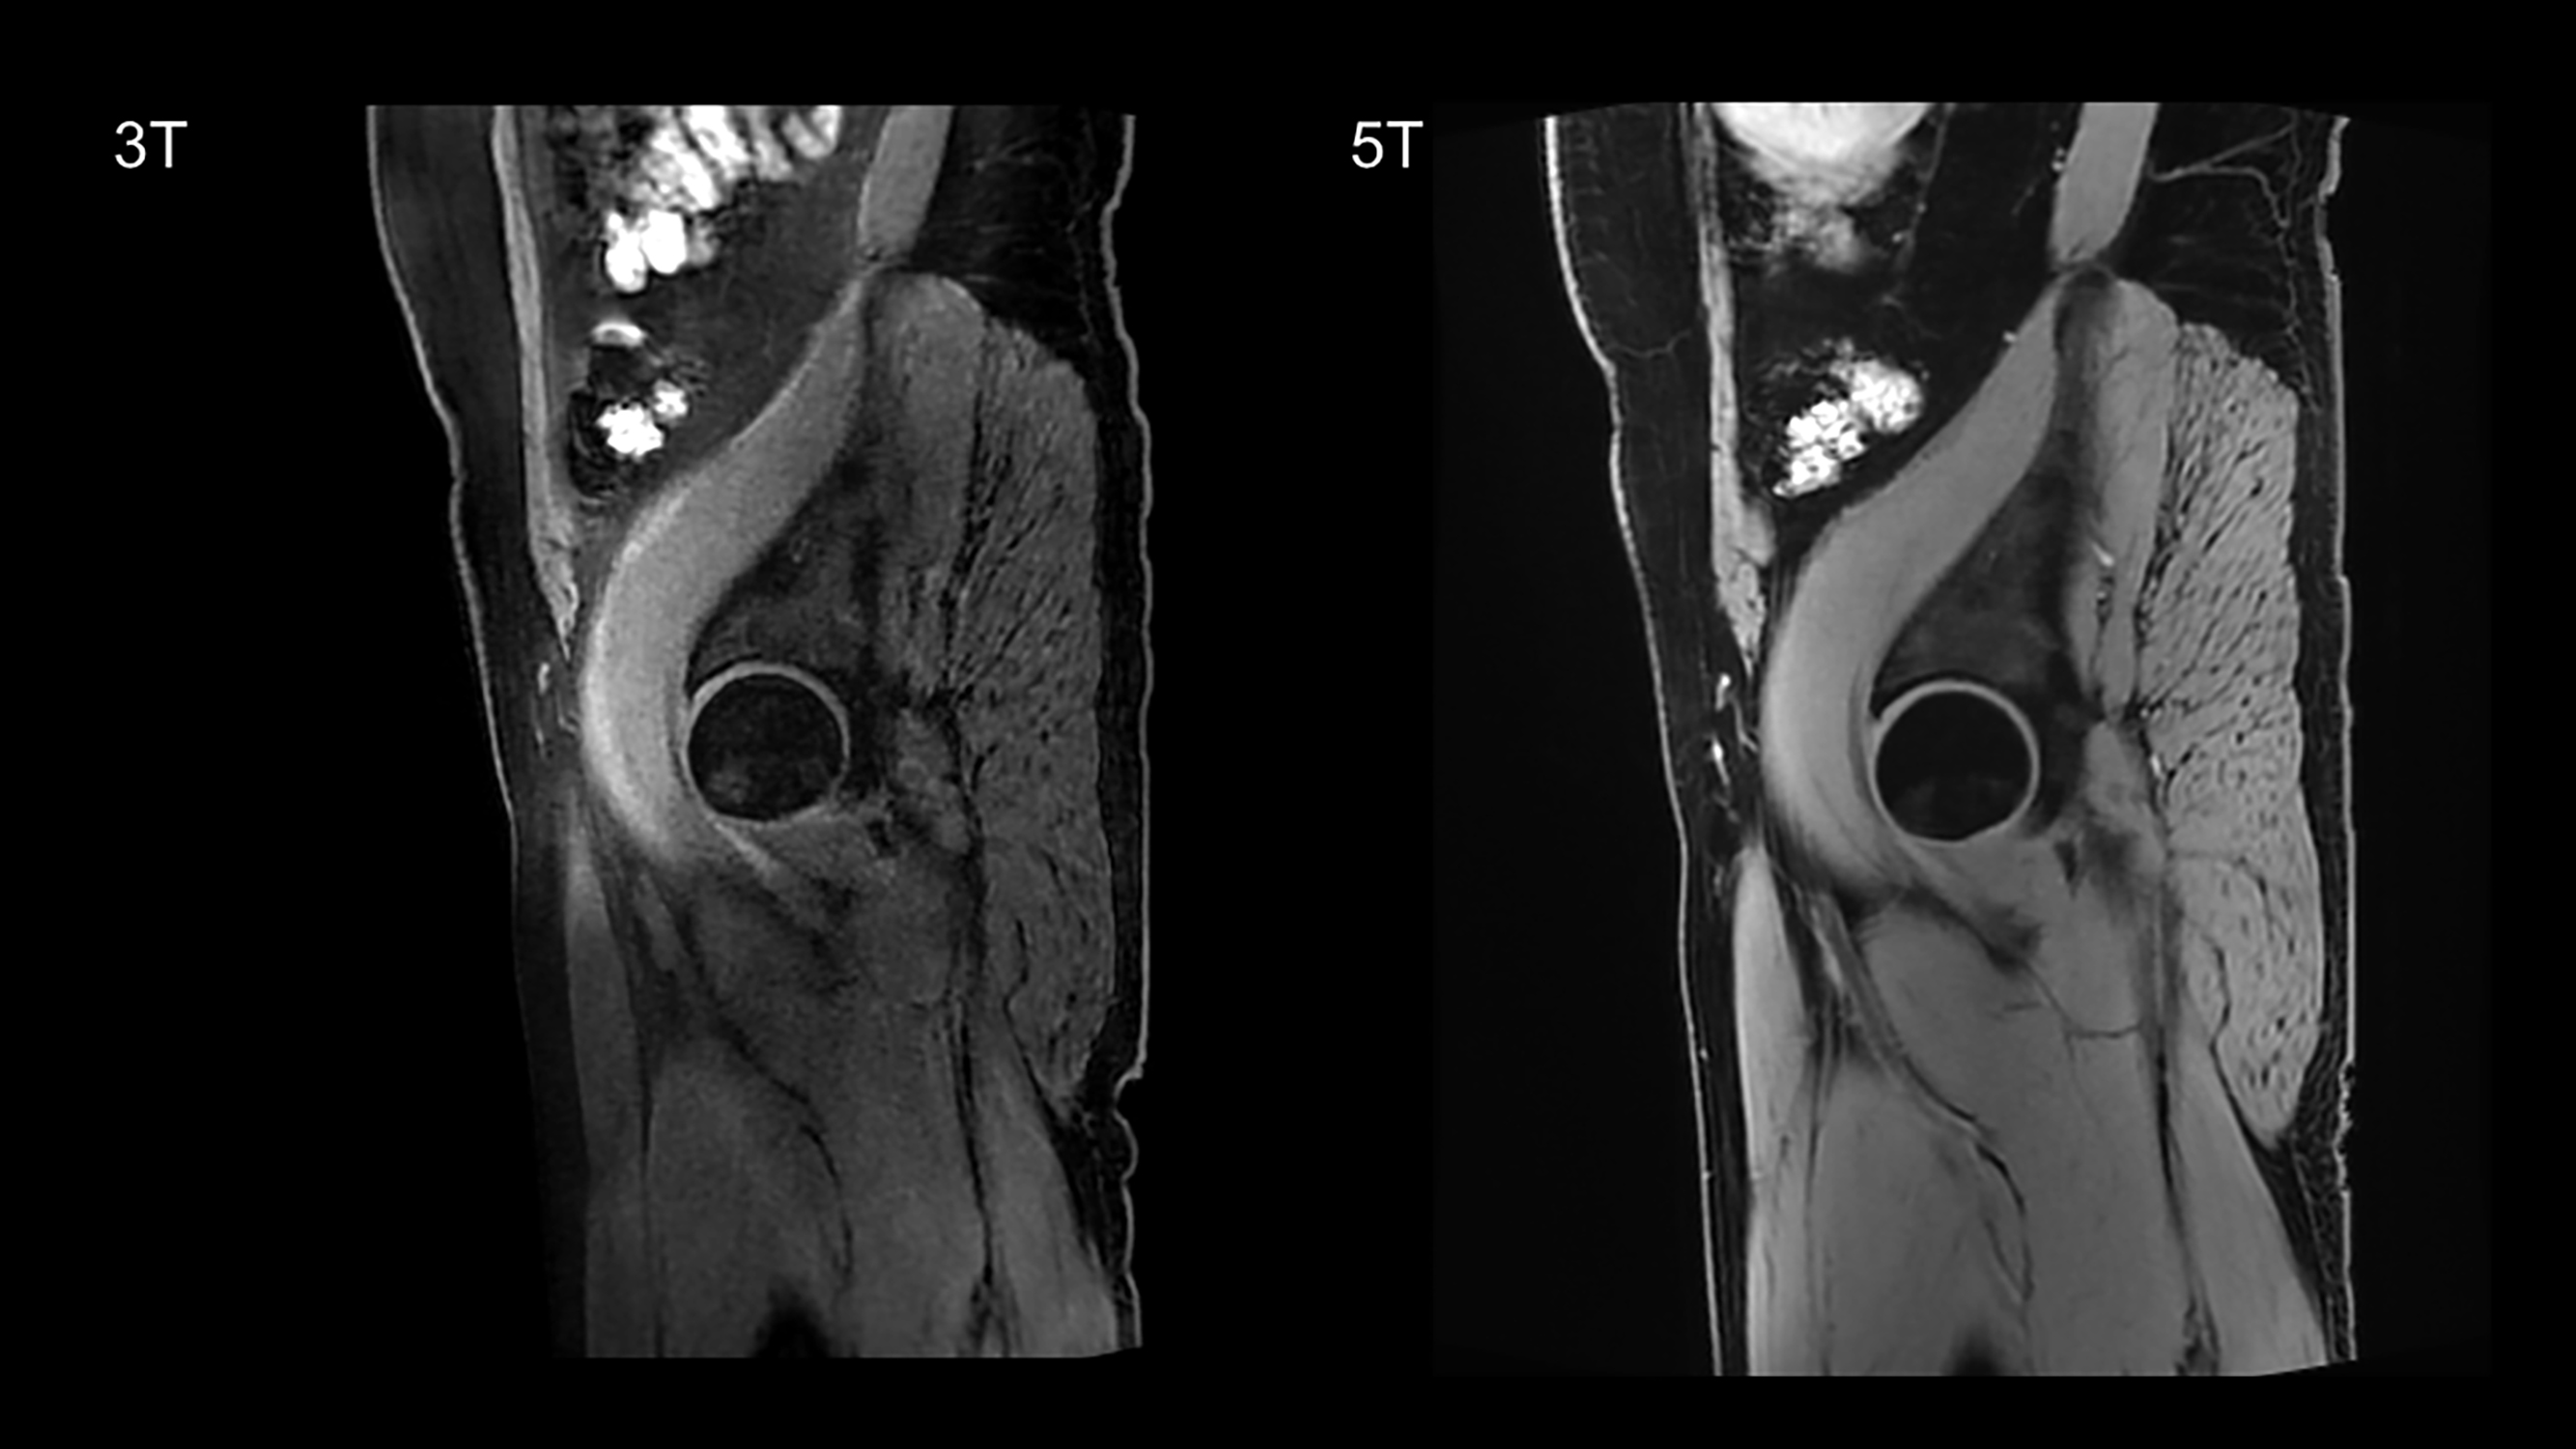
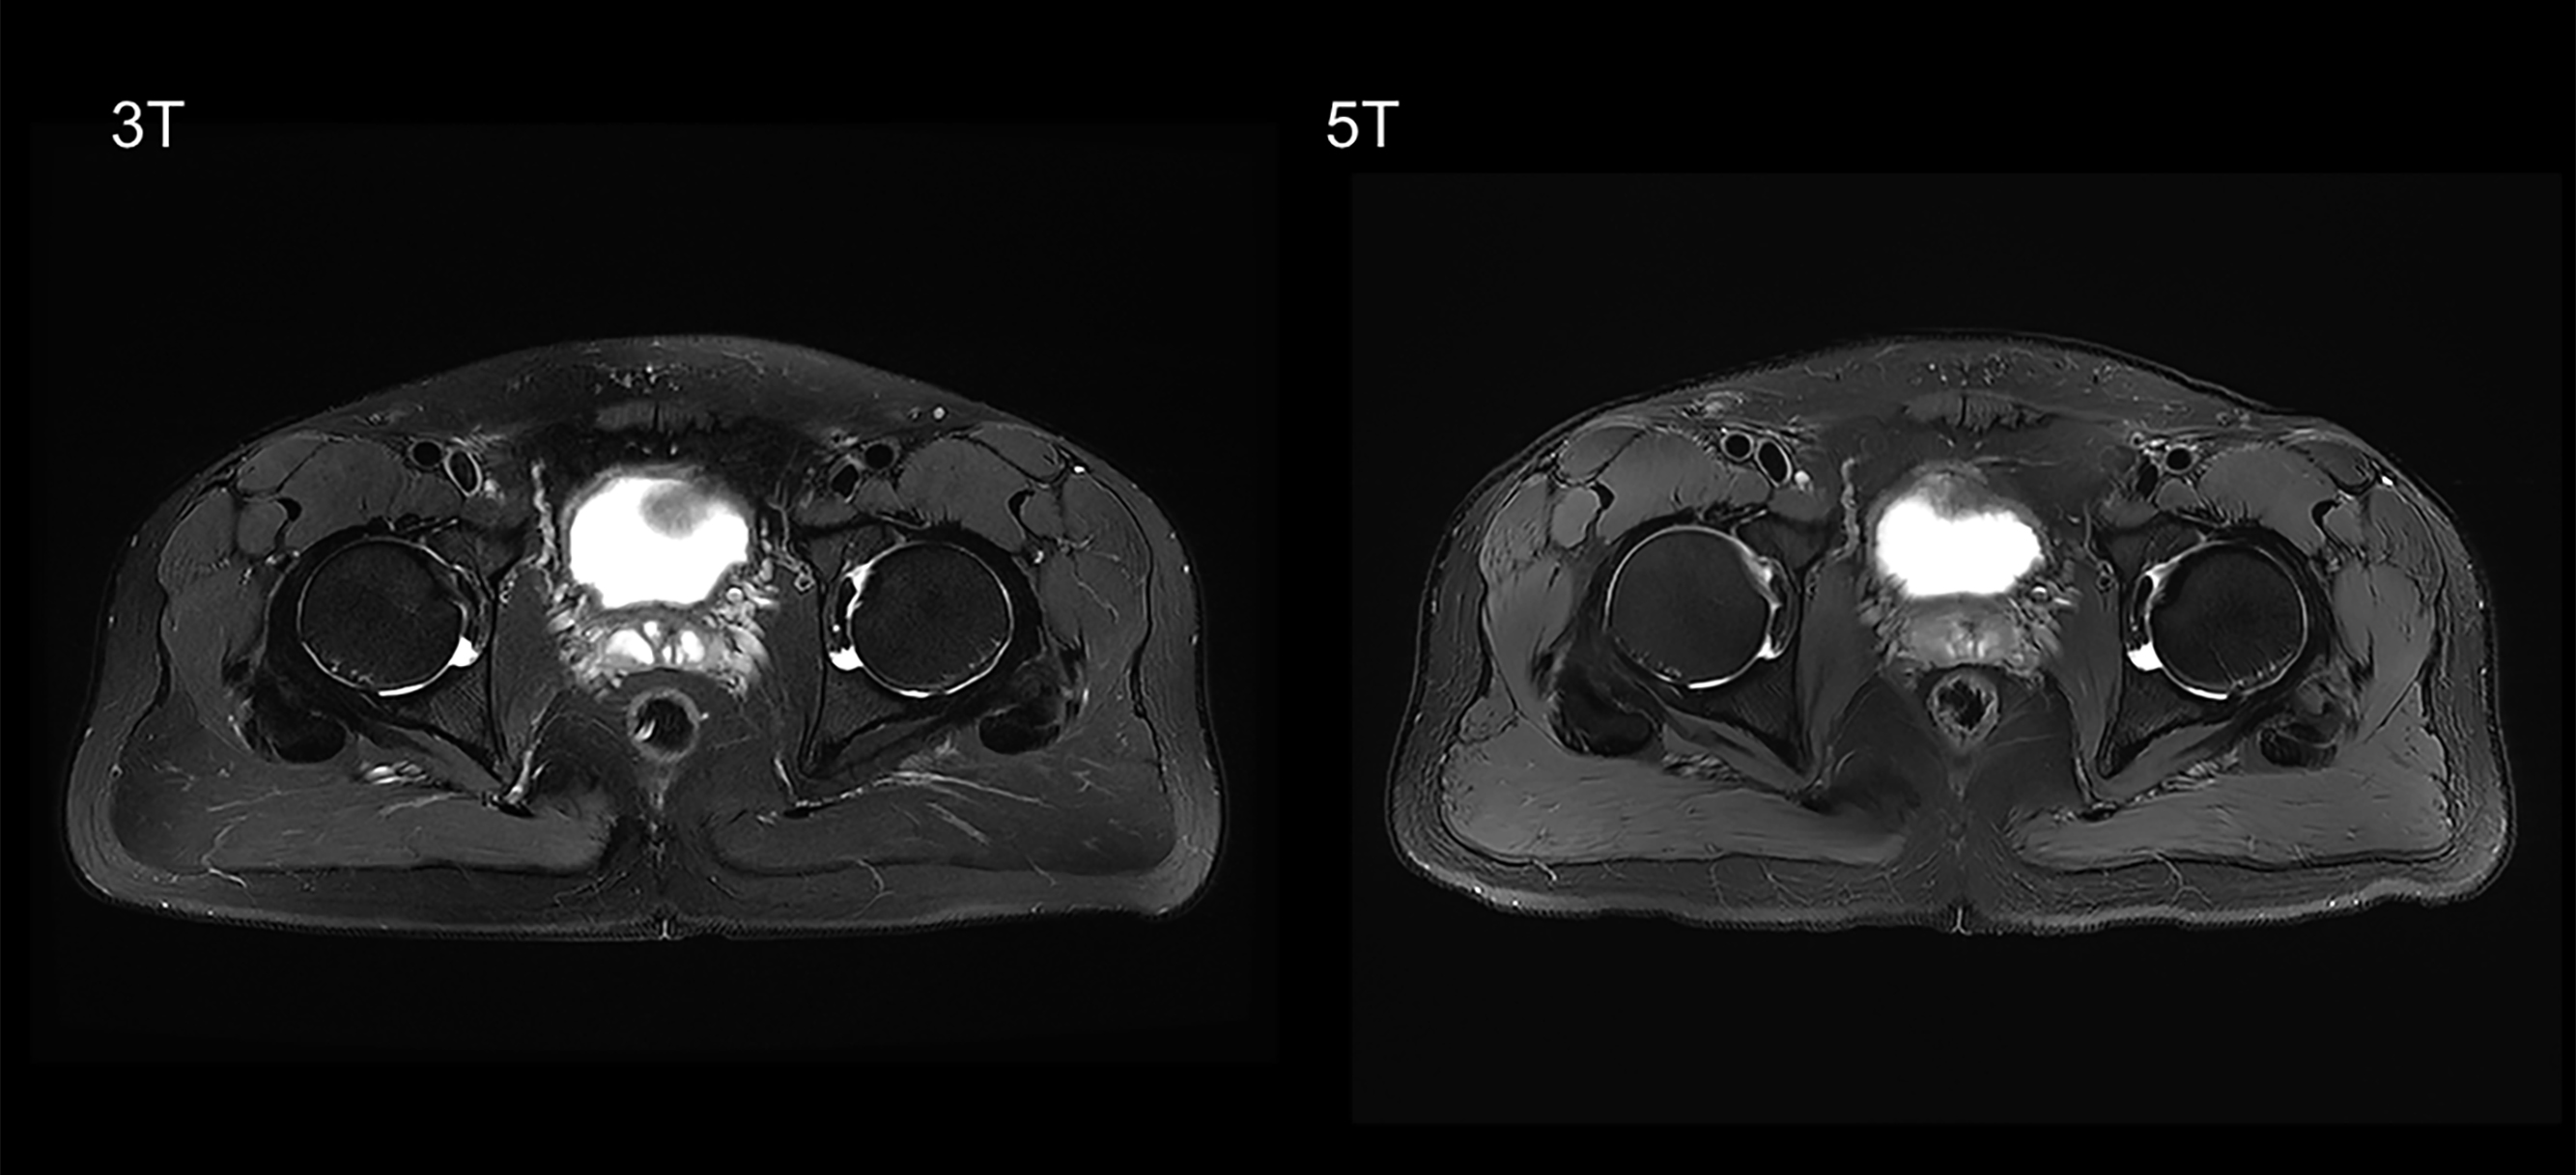
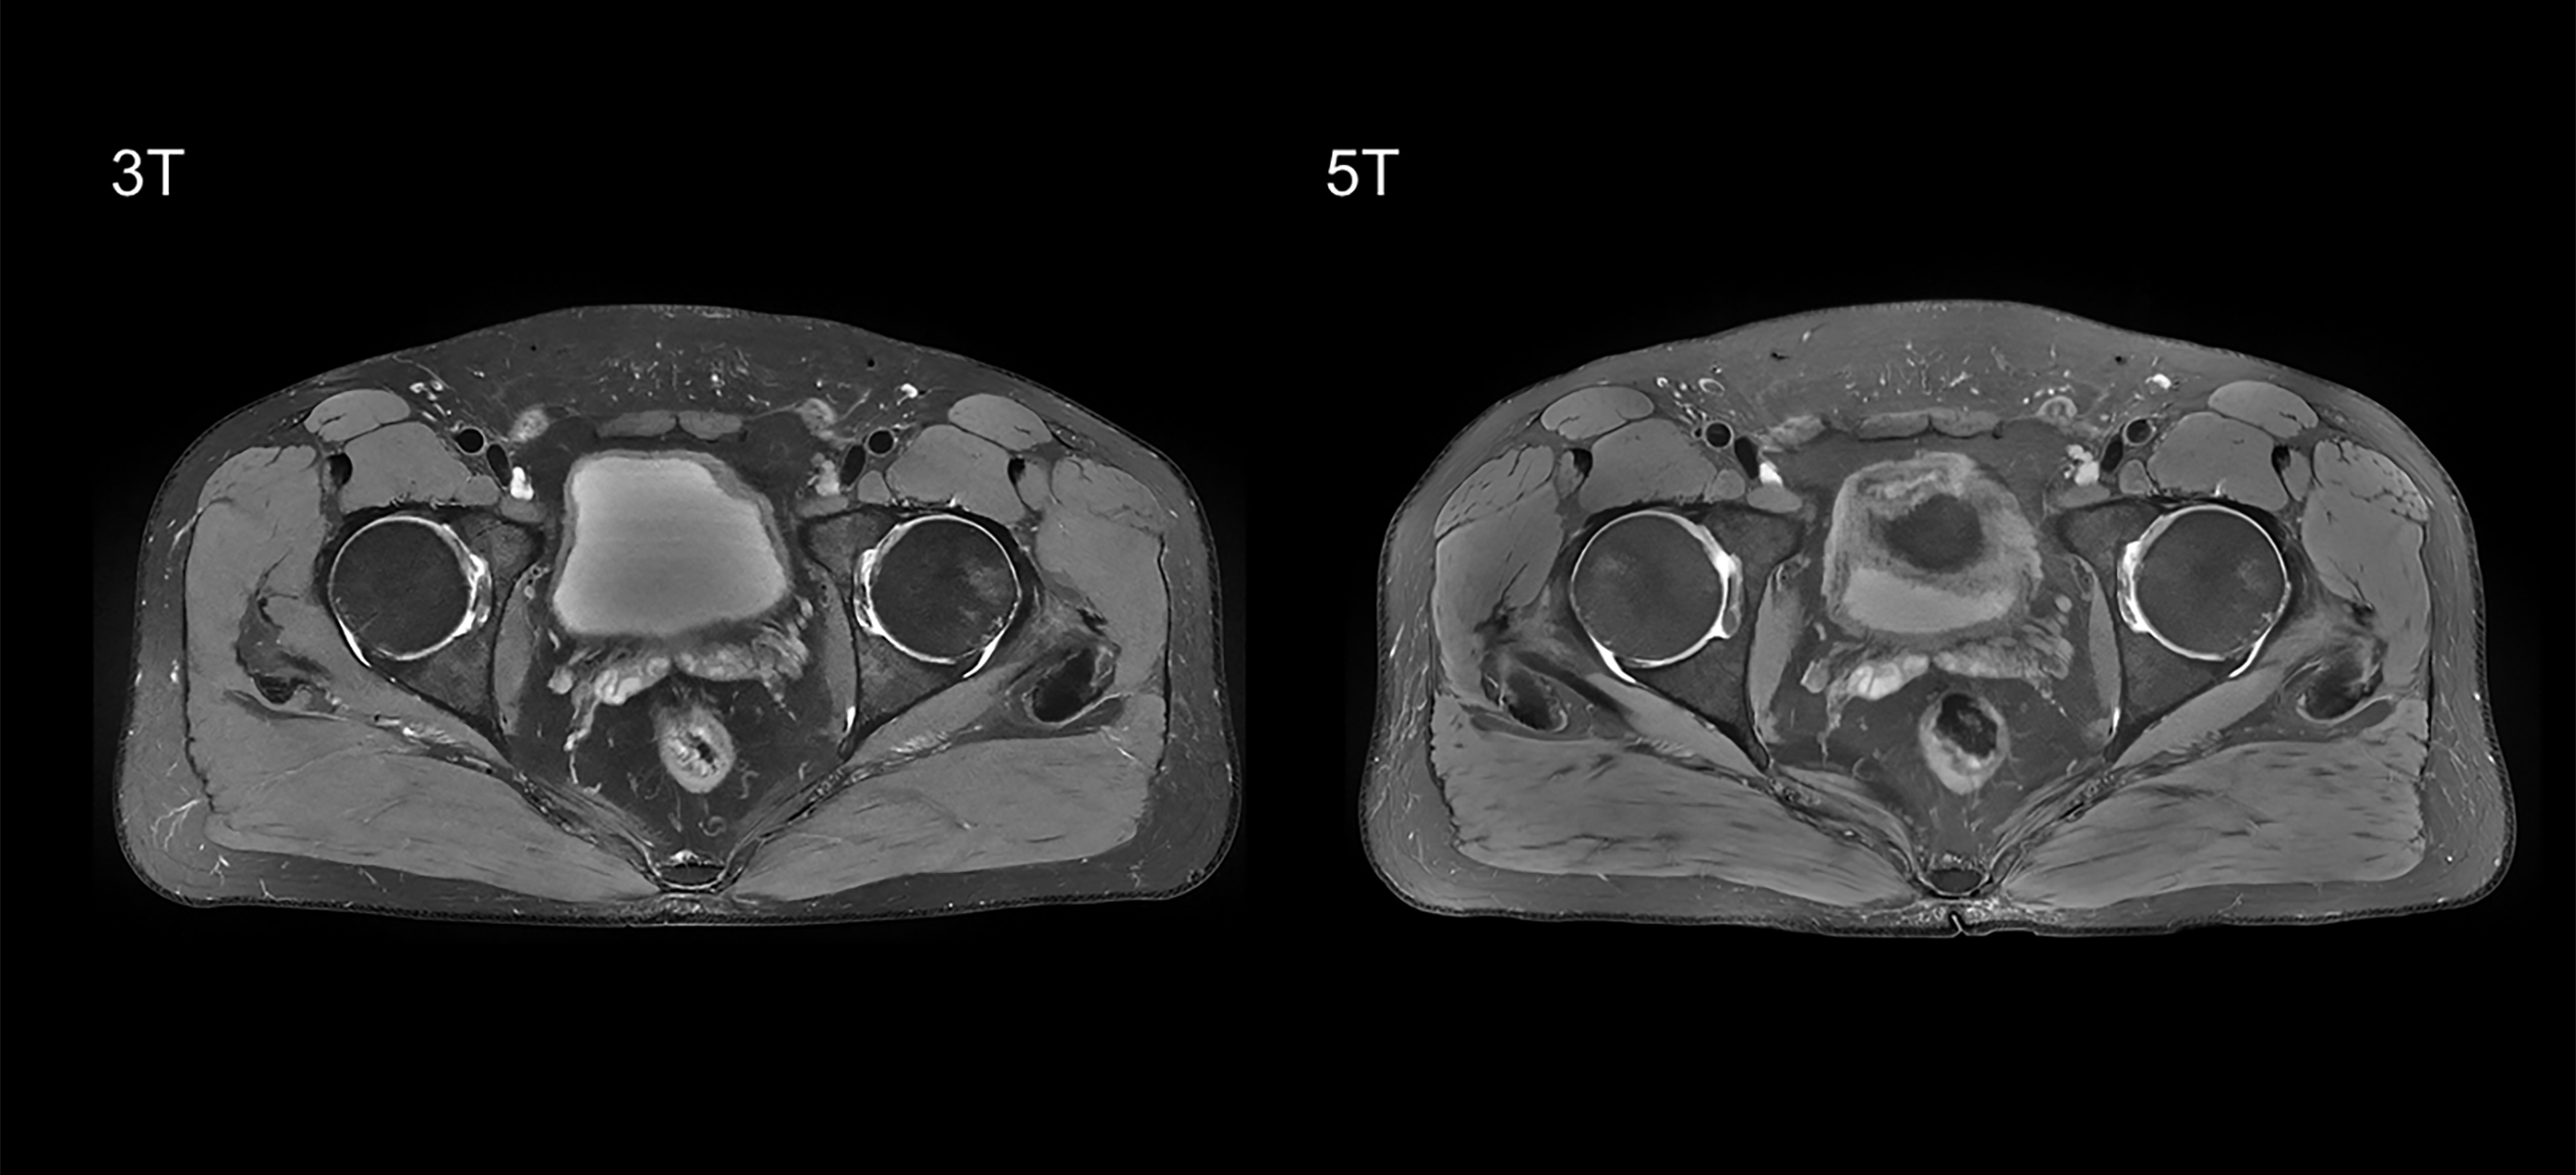
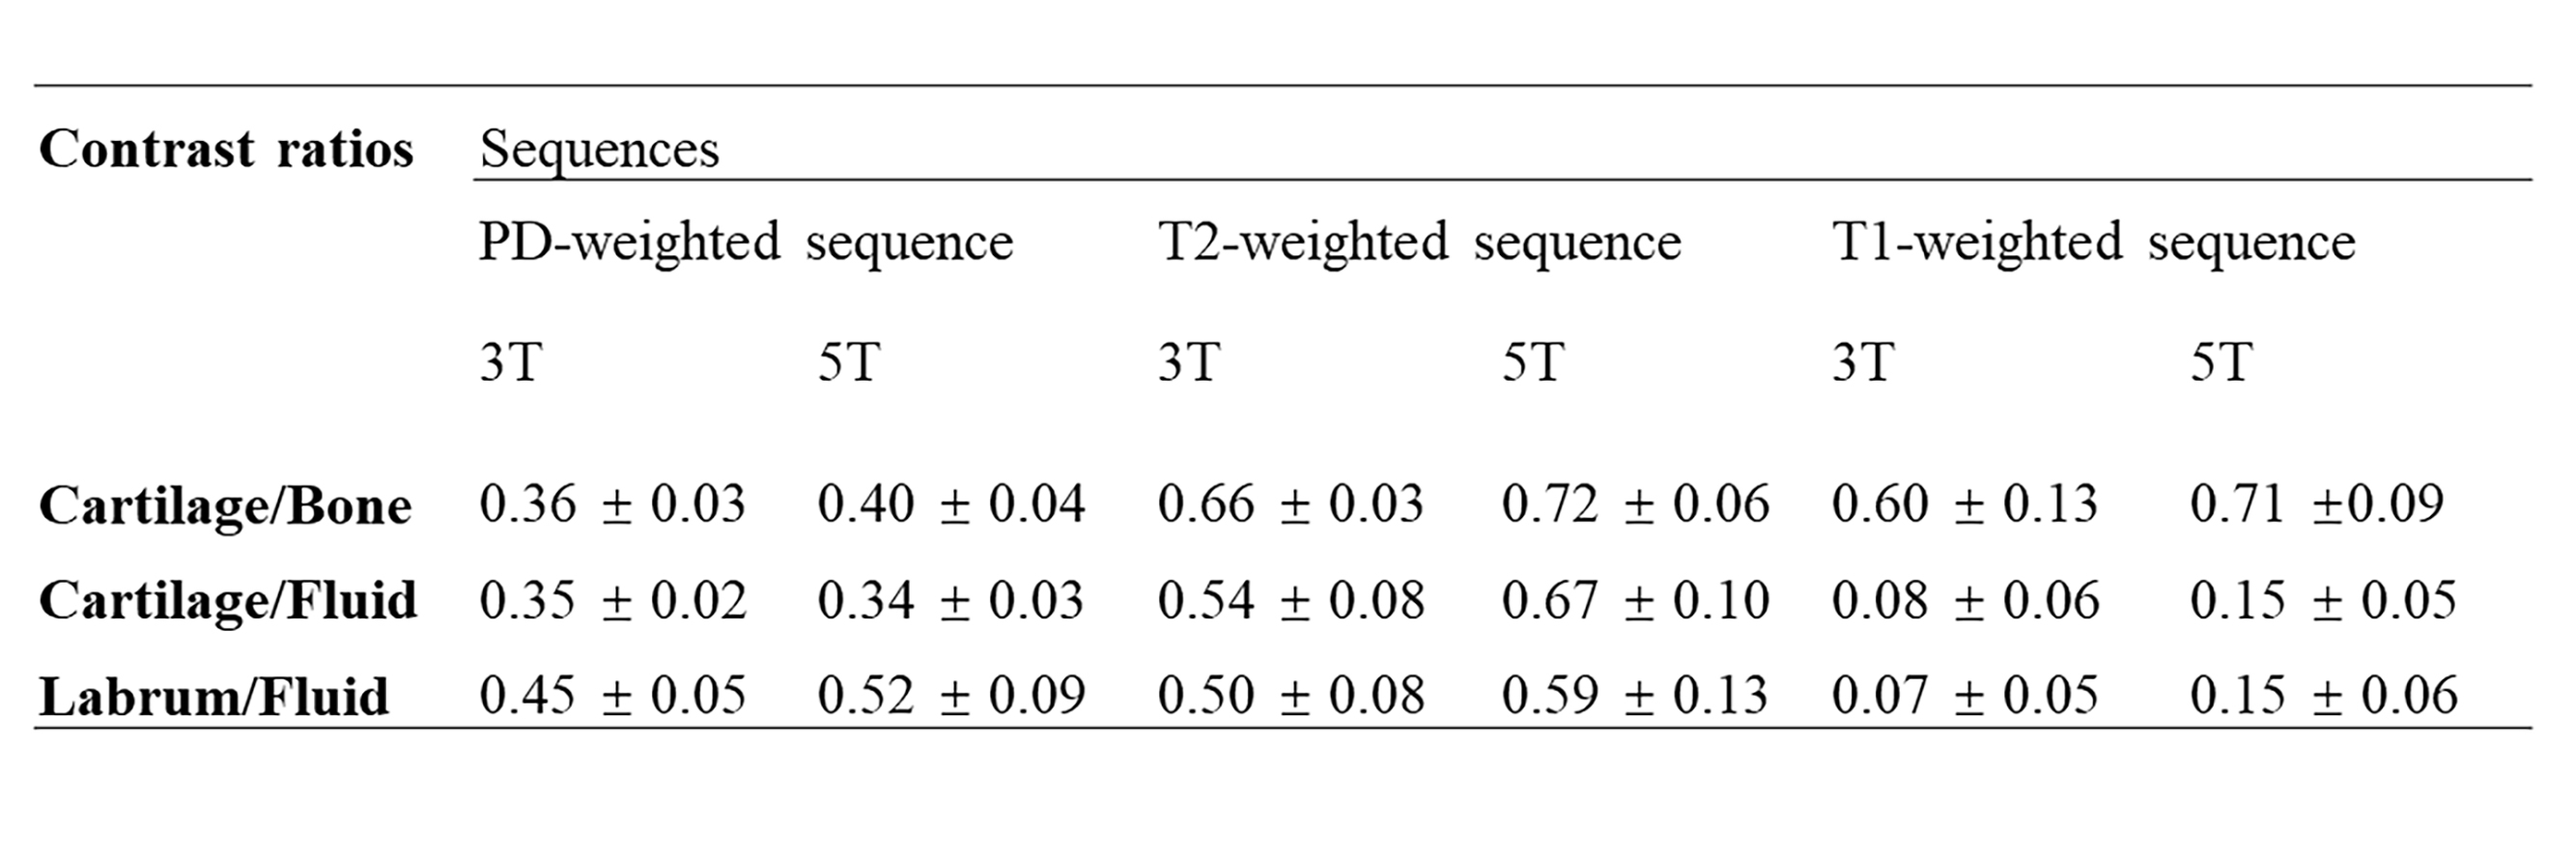
Representative images of T1-, T2-, PD-weighted sequences are shown in Figure 1 – 3. The most prominent improvement gained by the use of the 5T MRI was observed in T1-weighted sequence (4.6 ± 0.4 for overall image quality, 3.7 ± 0.8 for visibility of the anatomical structures). Comparable results were observed in T2-weighted sequence (3.1 ± 0.2 for overall image quality, 3.0 ± 0.8 for visibility of the anatomical structures) and PD-weighed sequence (2.9 ± 1.1 for overall image quality, 3.3 ± 0.6 for visibility of the anatomical structures).According to Table 1, for the quantitative analysis, the CRs between cartilage and bone were significantly higher at 5T compared with 3T in all the sequences (P < 0.05). The CRs between cartilage and fluid were comparable in PD-weighted sequence (P > 0.05), but significantly higher at 5T compared with 3T in T2-weighted sequence and T1-weighted sequence (P < 0.05). The CRs between fluid and labrum were considerably higher at 5 T compared with 3 T in all the sequences (P < 0.05).
Discussion/Conclusion
This is the first study to demonstrate the feasibility of performing morphological hip MRI protocol at 5T. Although 7 T has been proved to be superior to lower field strength in many studies of the musculoskeletal system, the use of ultra-high field systems in whole body imaging is still in its infancy because of the unavailability of commercial RF coils and the B1 inhomogeneities in larger fields of view. This initial study proved that 5T MRI can be a trade-off method to acquire better contrast ratios in hip with sufficient image quality. Further researches focus on quantitative imaging methods are needed.Acknowledgements
No acknowledgement found.References
1. Sutter, R., M. Zanetti, and C.W. Pfirrmann, New developments in hip imaging. Radiology, 2012. 264(3): p. 651-667.
2. Alizai, H., G. Chang, and R.R. Regatte, MR imaging of the musculoskeletal system using ultrahigh field (7T) MR imaging. PET clinics, 2018. 13(4): p. 551-565.
3. Menon, R.G., G. Chang, and R.R. Regatte, Musculoskeletal MR Imaging Applications at Ultra-High (7T) Field Strength. Magnetic Resonance Imaging Clinics, 2021. 29(1): p. 117-127.
4. Juras, V., et al., Comparison of 3 T and 7 T MRI clinical sequences for ankle imaging. European journal of radiology, 2012. 81(8): p. 1846-1850.
5. Karamat, M.I., S. Darvish-Molla, and A. Santos-Diaz, Opportunities and challenges of 7 tesla magnetic resonance imaging: a review. Critical Reviews™ in Biomedical Engineering, 2016. 44(1-2).
6. Theysohn, J., et al., Bilateral hip imaging at 7 Tesla using a multi-channel transmit technology: initial results presenting anatomical detail in healthy volunteers and pathological changes in patients with avascular necrosis of the femoral head. Skeletal radiology, 2013. 42(11): p. 1555-1563.
Figures