3246
Renal MRI at 5T: A feasibility and quantitative study1Shanghai Institute of Medical Imaging, Shanghai, China, 2United Imaging Healthcare, Shanghai, China, 3Department of Radiology, Zhongshan Hospital, Fudan University, Shanghai, China
Synopsis
Compared to clinical field strengths, MRI at ultra-high magnetic fields allows higher SNR. However, imaging at 7T remains challenging, especially in renal MRI. This study investigated the feasibility of renal MRI at 5T, with a brand new 5T MR scanner. Compared to 3T examination, 5T renal MRI demonstrated higher SNR and improved corticomedullar discrimination with diagnostic image quality. Functional imaging, including DWI and T2* mapping, was also feasible at 5T. Therefore, in vivo 5T renal MRI may better elucidate the renal diseases with both anatomical and functional imaging, compared to conventional clinical MRI scanners.
Introduction
Generally, higher magnetic field allows higher signal-to-noise (SNR) ratio, and gives more space for spatial resolution. On the other hand, the changed relaxation time, i.e., T1 and T2, and other physical effects such as inhomogeneity of the radiofrequency field and specific absorption rate (SAR) constraints due to higher field make a challenge for image quality [1]. Renal magnetic resonance imaging (MRI) is a significant part of clinical routine. Prior study demonstrated the potential and drawbacks of 7T renal MRI [2]. In this study, we aimed to investigate the performance renal MRI at 5T, and compare it with 3T.Methods
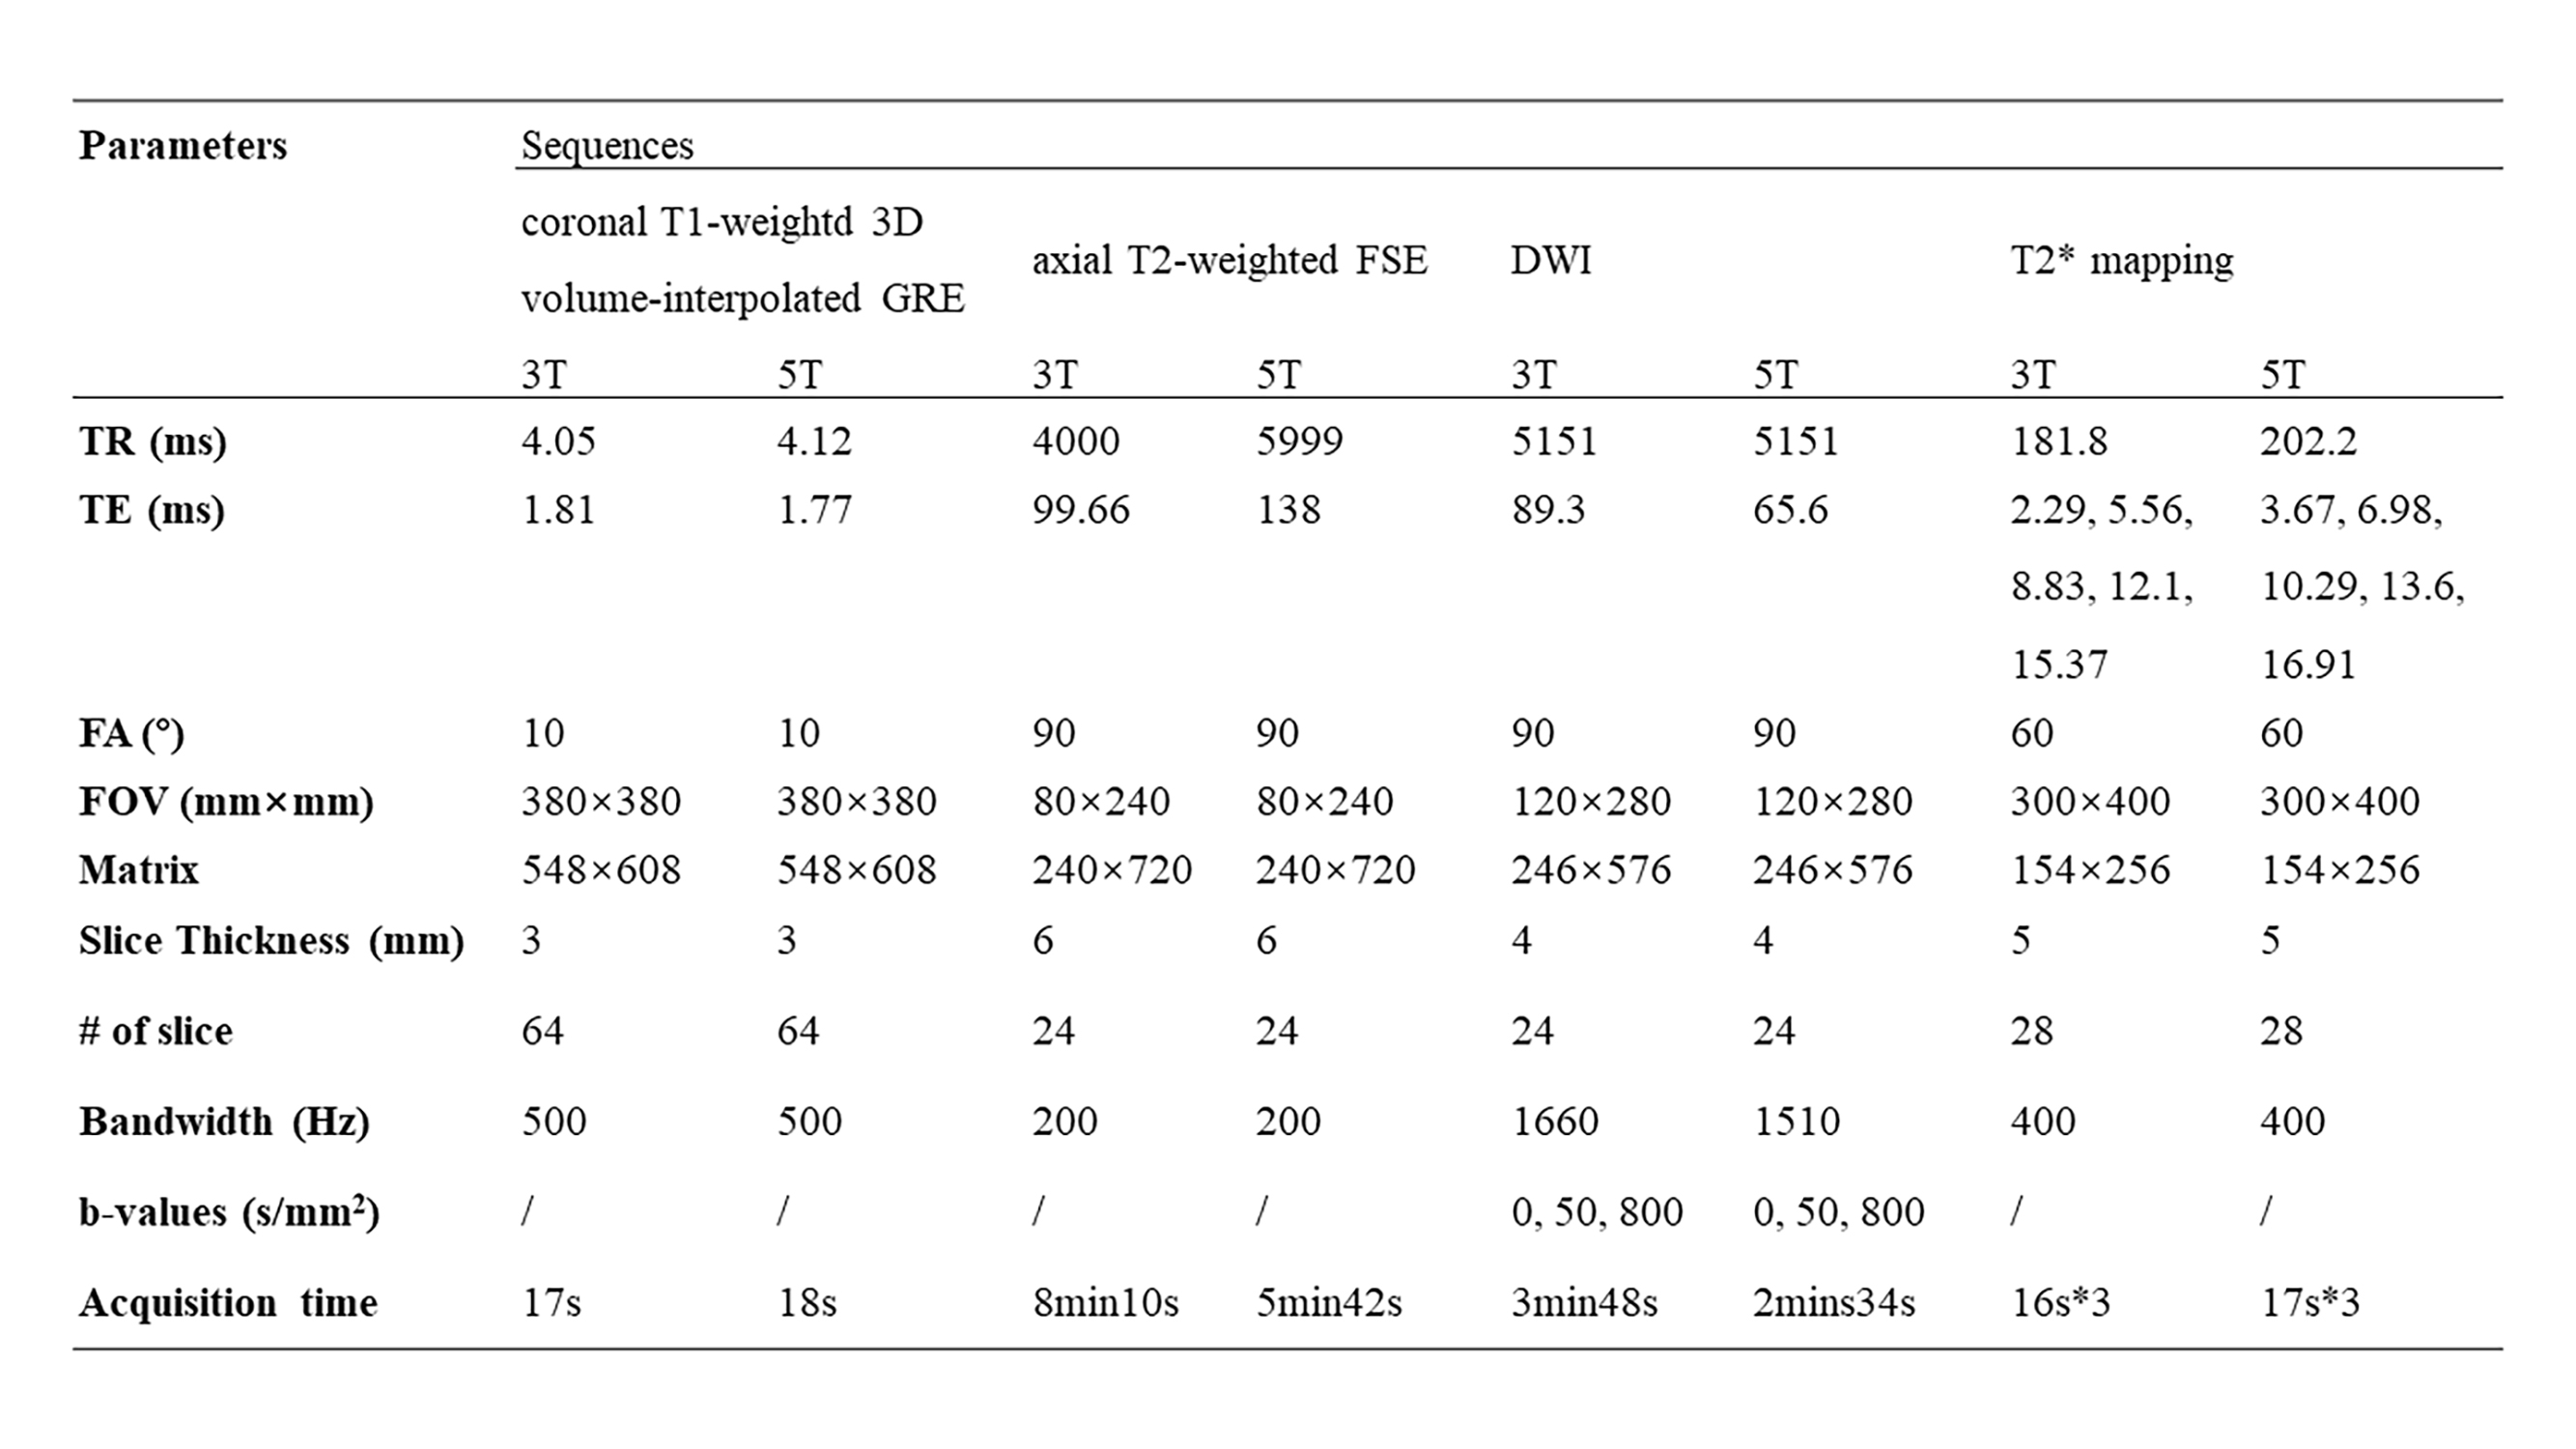
Fifteen healthy volunteers with no known renal diseases were included in this study. This study was approved by institutional review board and written signed consents were obtained from all participants. All the participants were examined on a 3T MR scanner (uMR 790, United Imaging Healthcare, Shanghai, China) and a 5T MR scanner (uMR Jupiter, United Imaging Healthcare, Shanghai, China) by using optimal coil setups for both field strengths, respectively. At 5T, a custom-built 24 channel body transmit/receive RF coil was used, and B1+ shimming was used for B1+ optimization. The MRI sequences included coronal T1-weightd 3D volume-interpolated breath-hold gradient-echo (GRE) sequence (QUICK 3D), axial T2-weighted fast spin-echo (FSE) with fat saturation and respiratory trigger, and diffusion weighted imaging (DWI). T2* mapping was performed based on multi-echo GRE sequence. The detailed MR protocols were listed in table 1.Qualitative and quantitative analyses were performed in consensus by two experienced radiologists. The image quality for each sequence type was evaluated by using a three-point scale (score 1 = poor quality, score 2 = moderate [diagnostic] quality, score 3 = good quality). The evaluation criteria were based on: 1) the cortico-medullary differentiation and 2) the delineation of adrenal glands, proximal ureter, renal arteries, and renal veins. Considering the chemical shift, B1 inhomogeneity, susceptibility, motion artifacts and the overall image impairment, the presence of artifacts was assessed by using a three-point scale (score 1 = strong impairment, score 2 = moderate impairment, score 3 = no artifact present or insignificant). For the quantitative analysis, SNR (cortex) = Signal (cortex)/noise, SNR (medulla) = Signal (medulla)/noise, and CNR = [Signal(cortex)-Signal(medulla)]/noise were measured for images of all the sequences. The noise was defined as the standard deviation of signal intensity within air outside of the body.
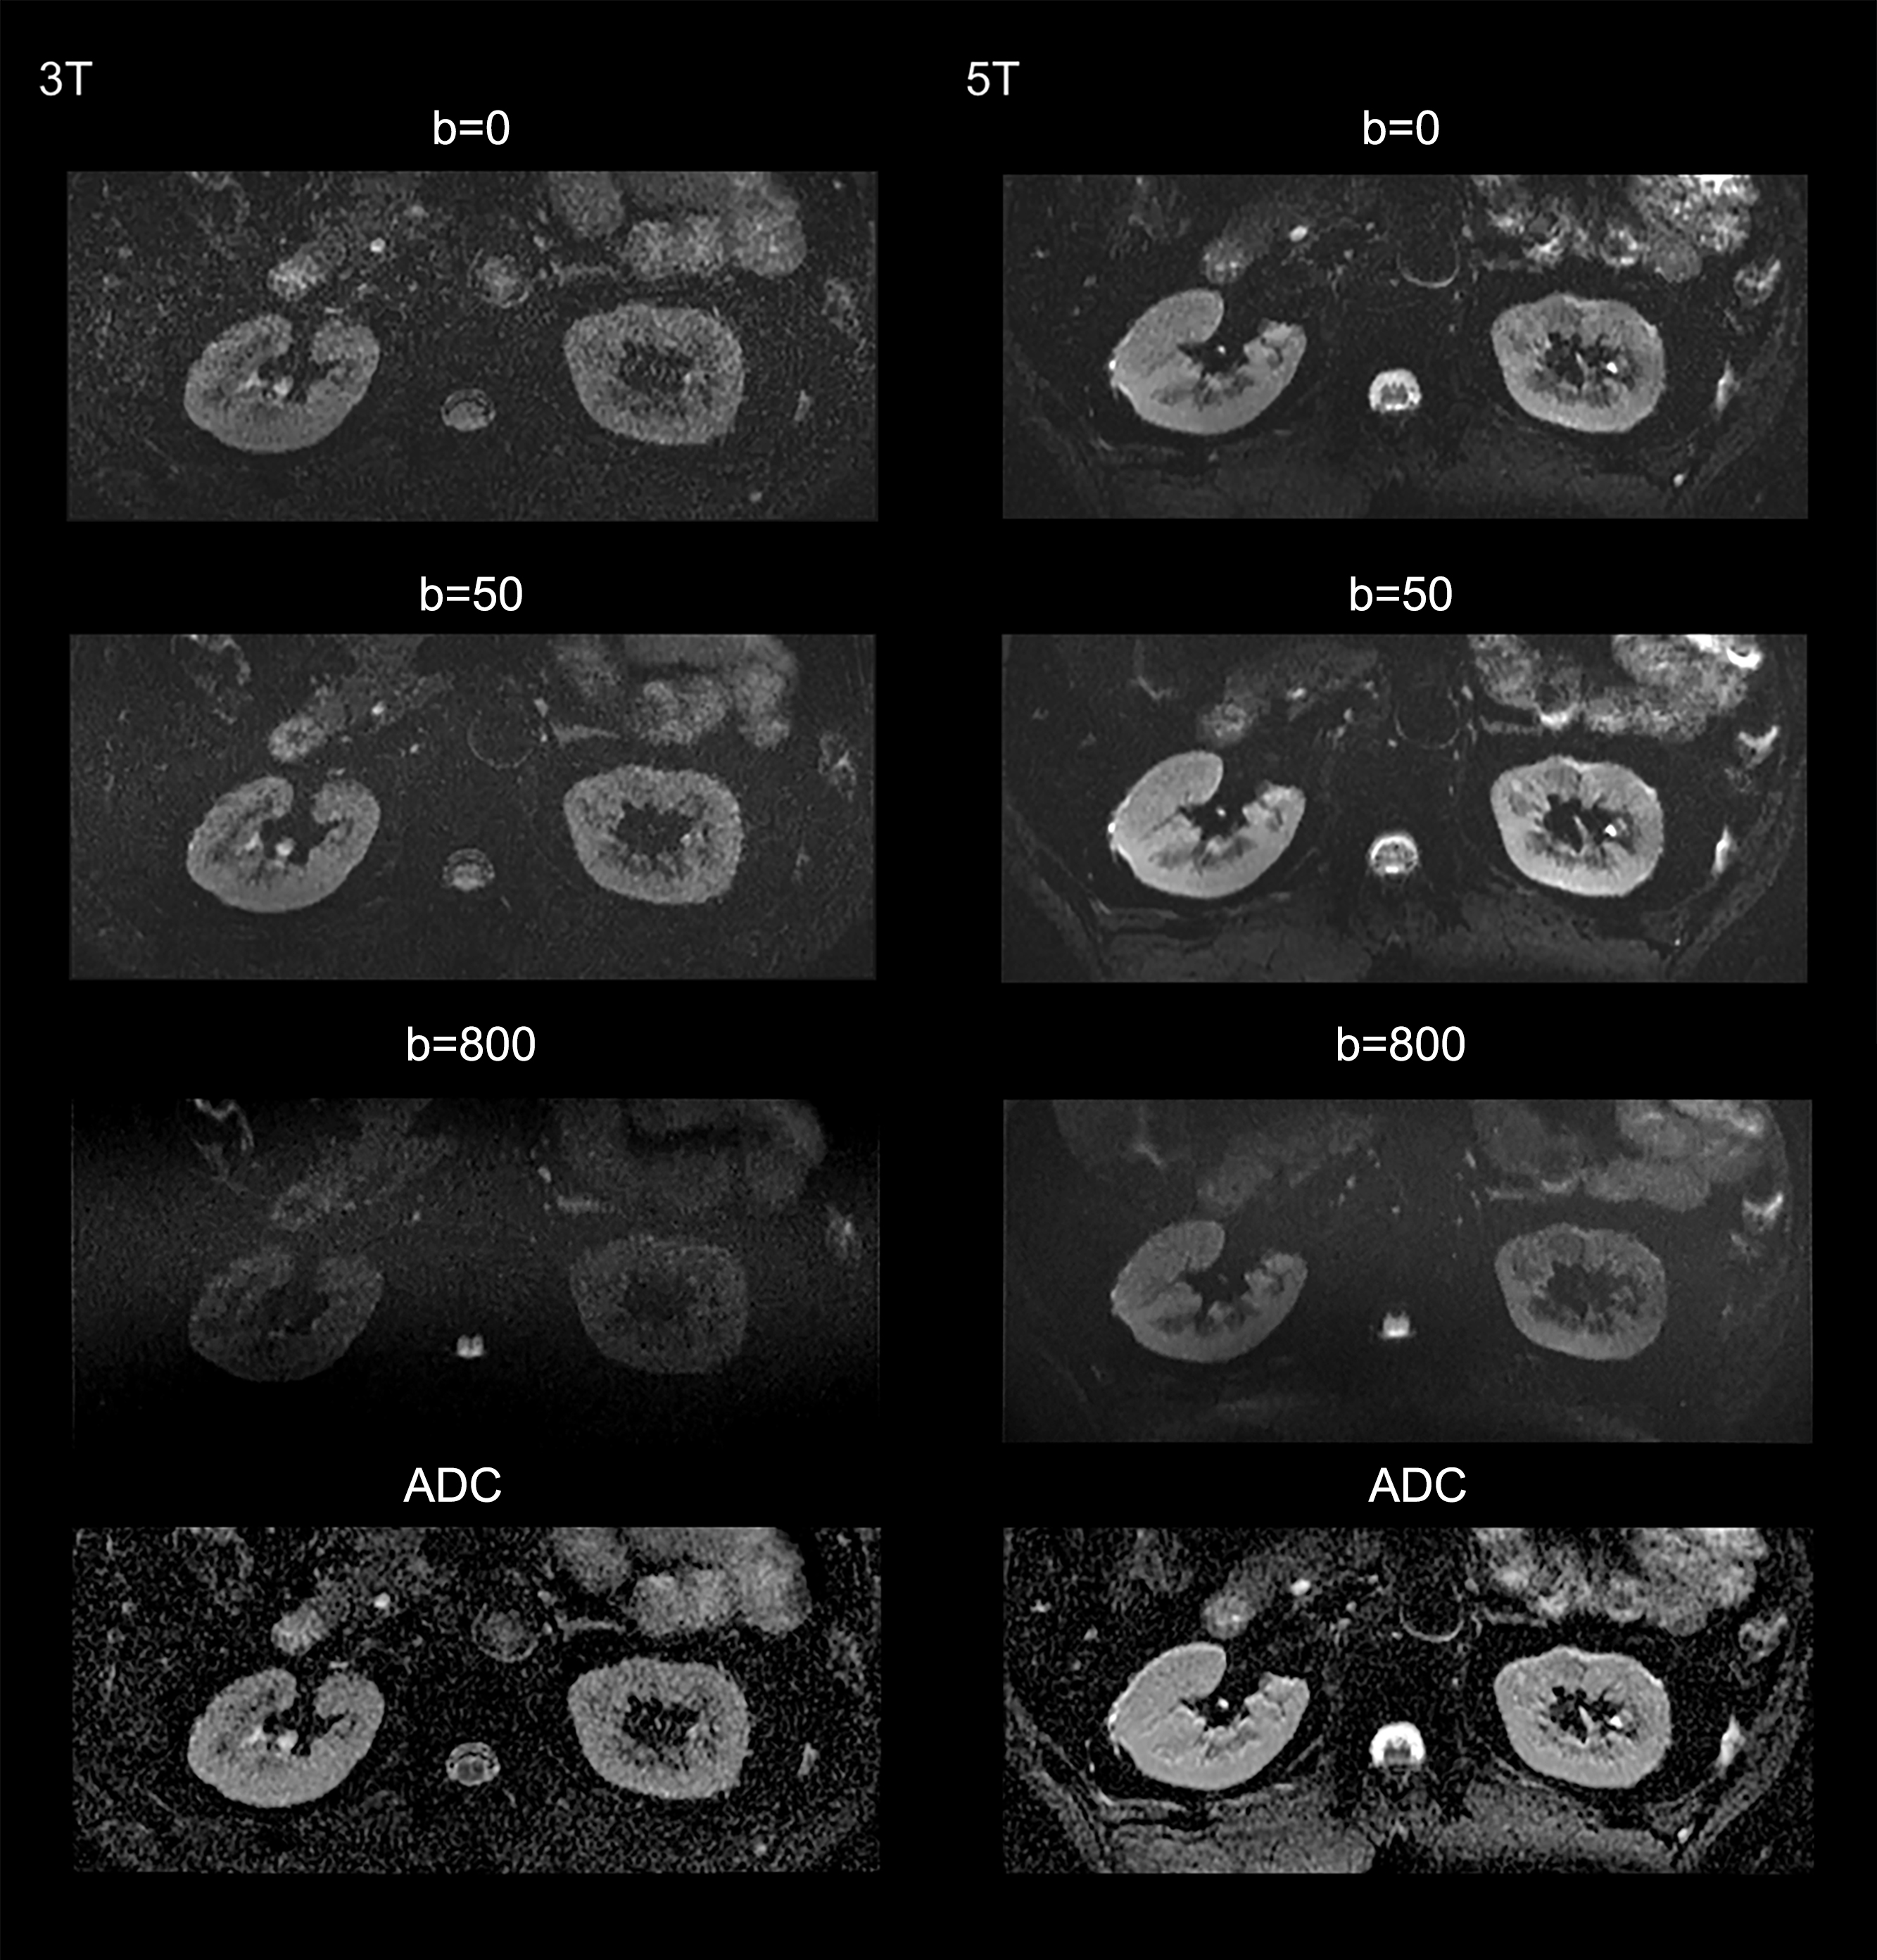
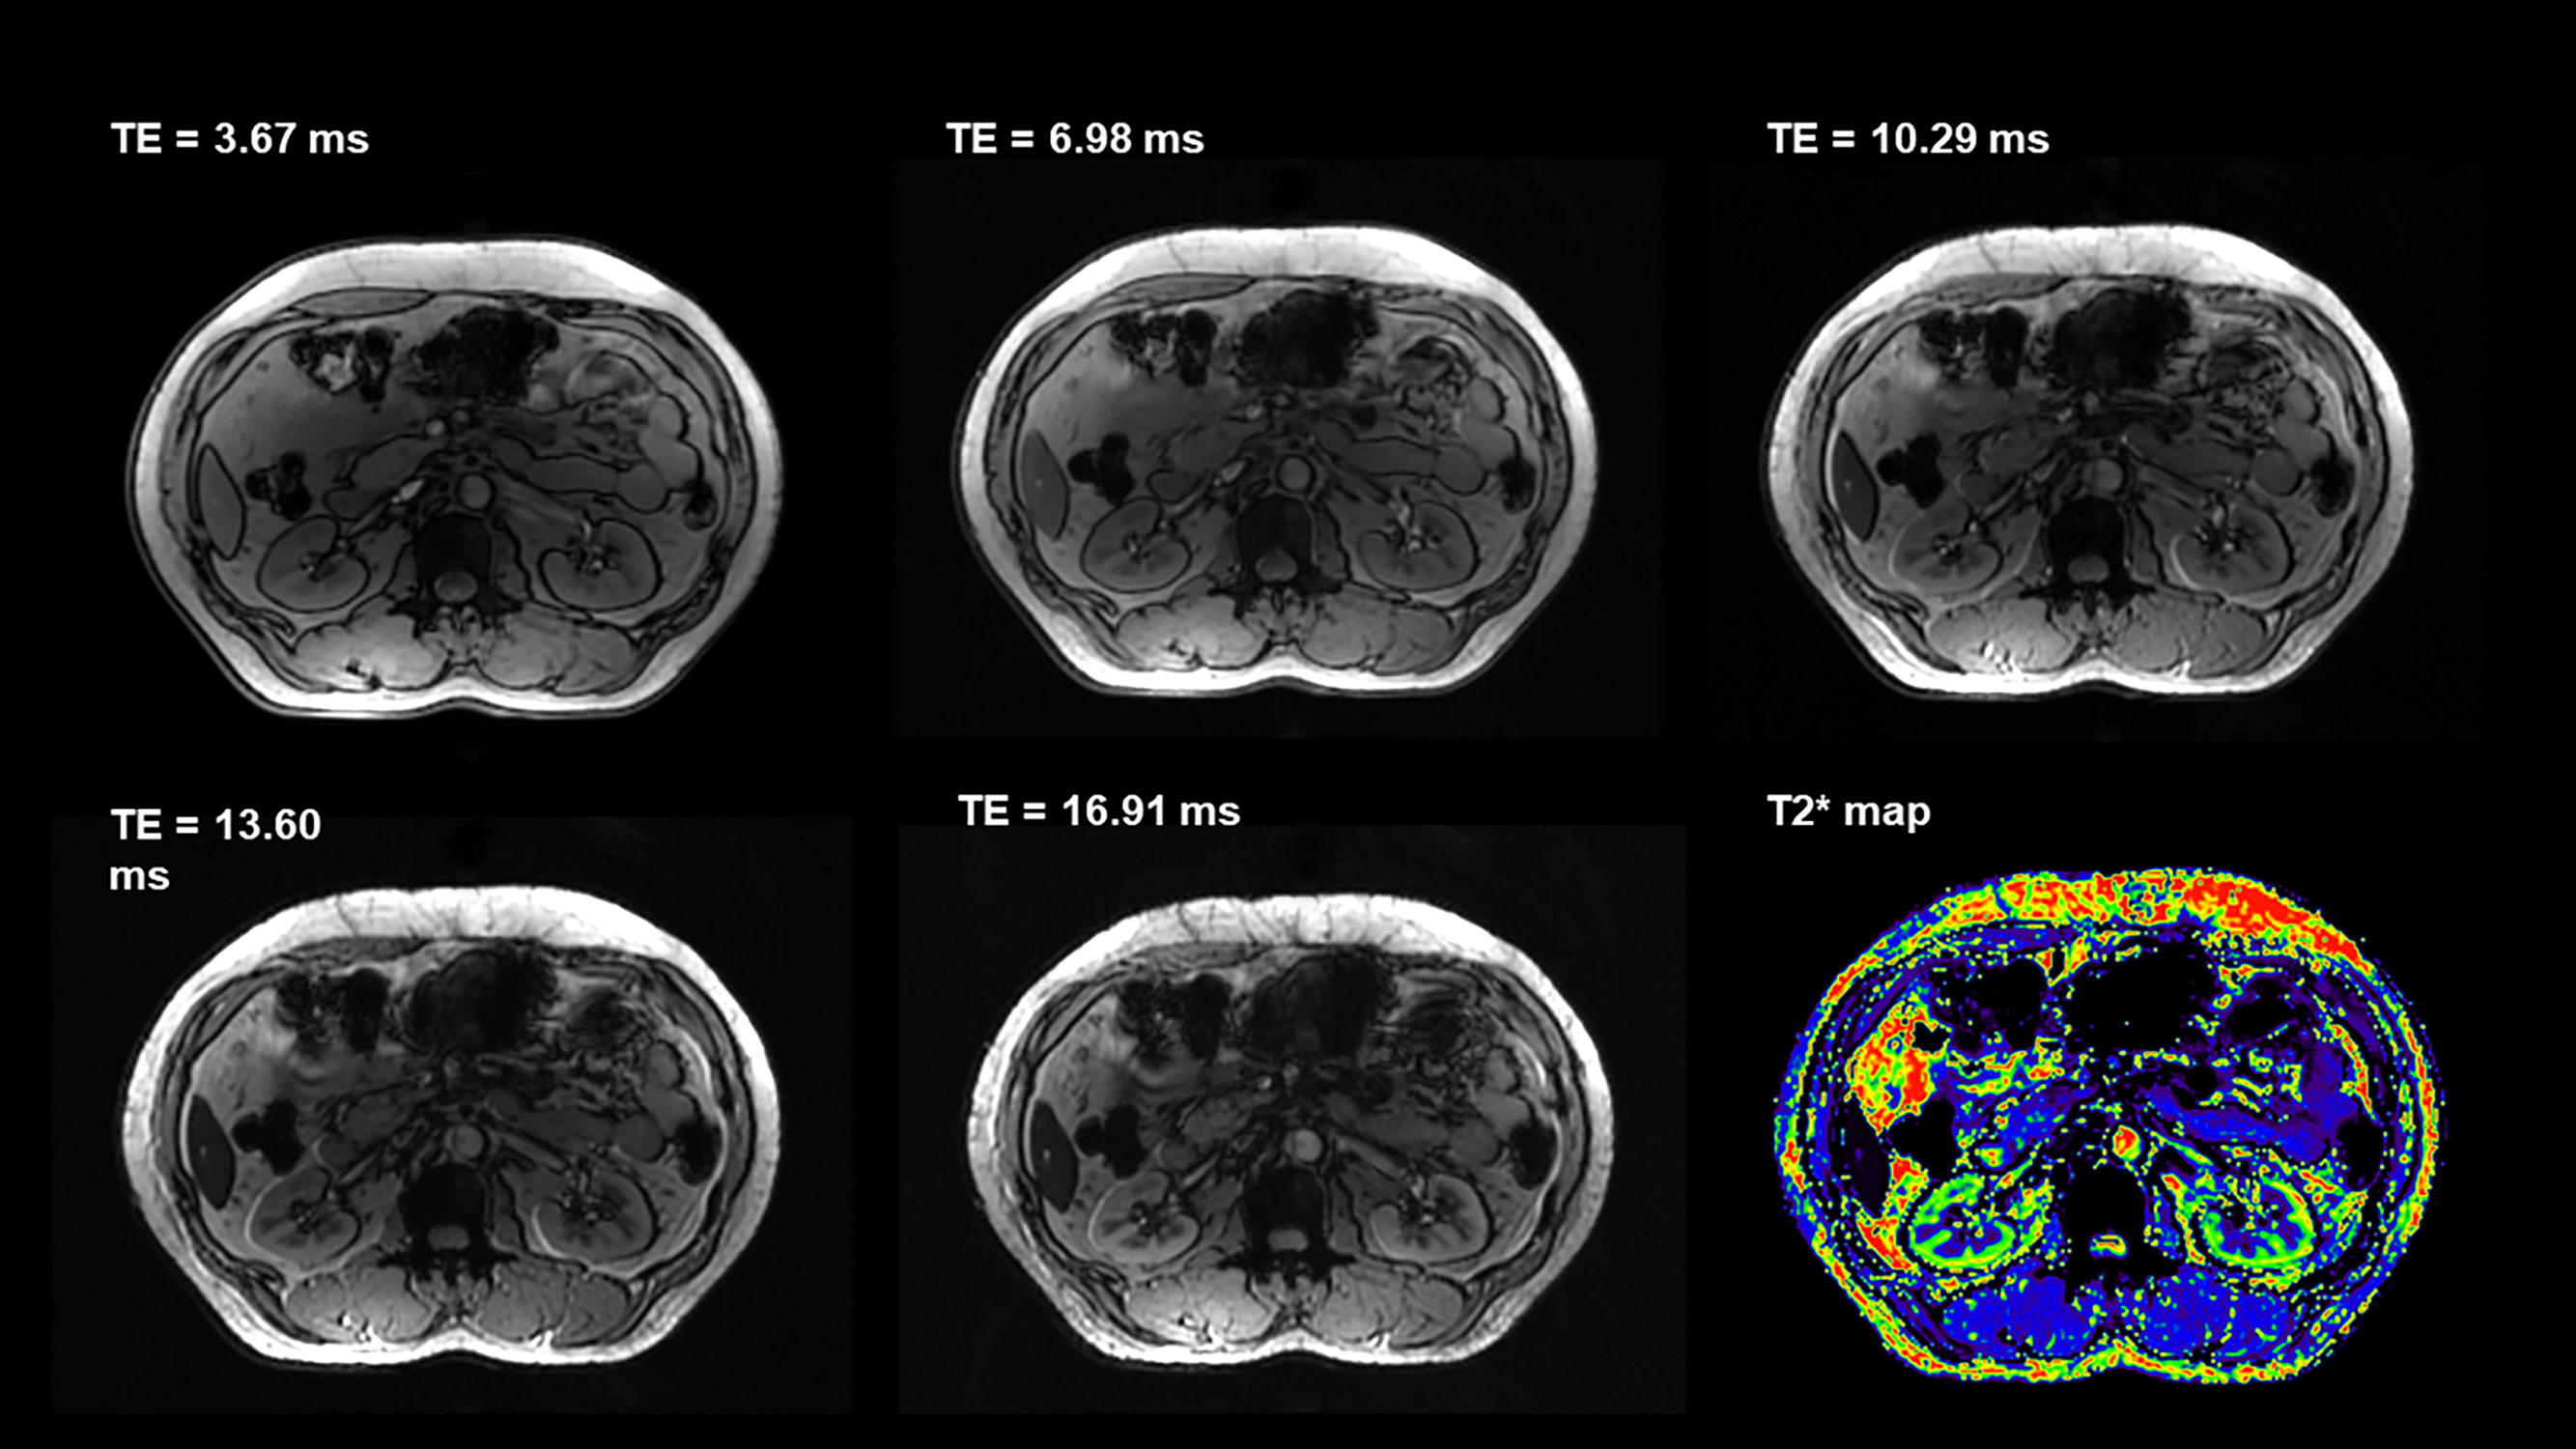
For functional imaging, mean apparent diffusion coefficient (ADC) and T2* relaxation time were calculated from cortex and medulla for each subject, respectively.
Score values of image quality and presence of artifacts for each sequence, and the mean ADC and T2* values were compared between 3T and 5T using Wilcoxon’s Rank Test. The Wilcoxon signed rank-sum test was also used to compare the individual cortical and medullary T2* and ADC of all the subjects. The Bonferroni correction was used to adapt the multiple tests. P value < 0.05 was considered statistically significant.
Results
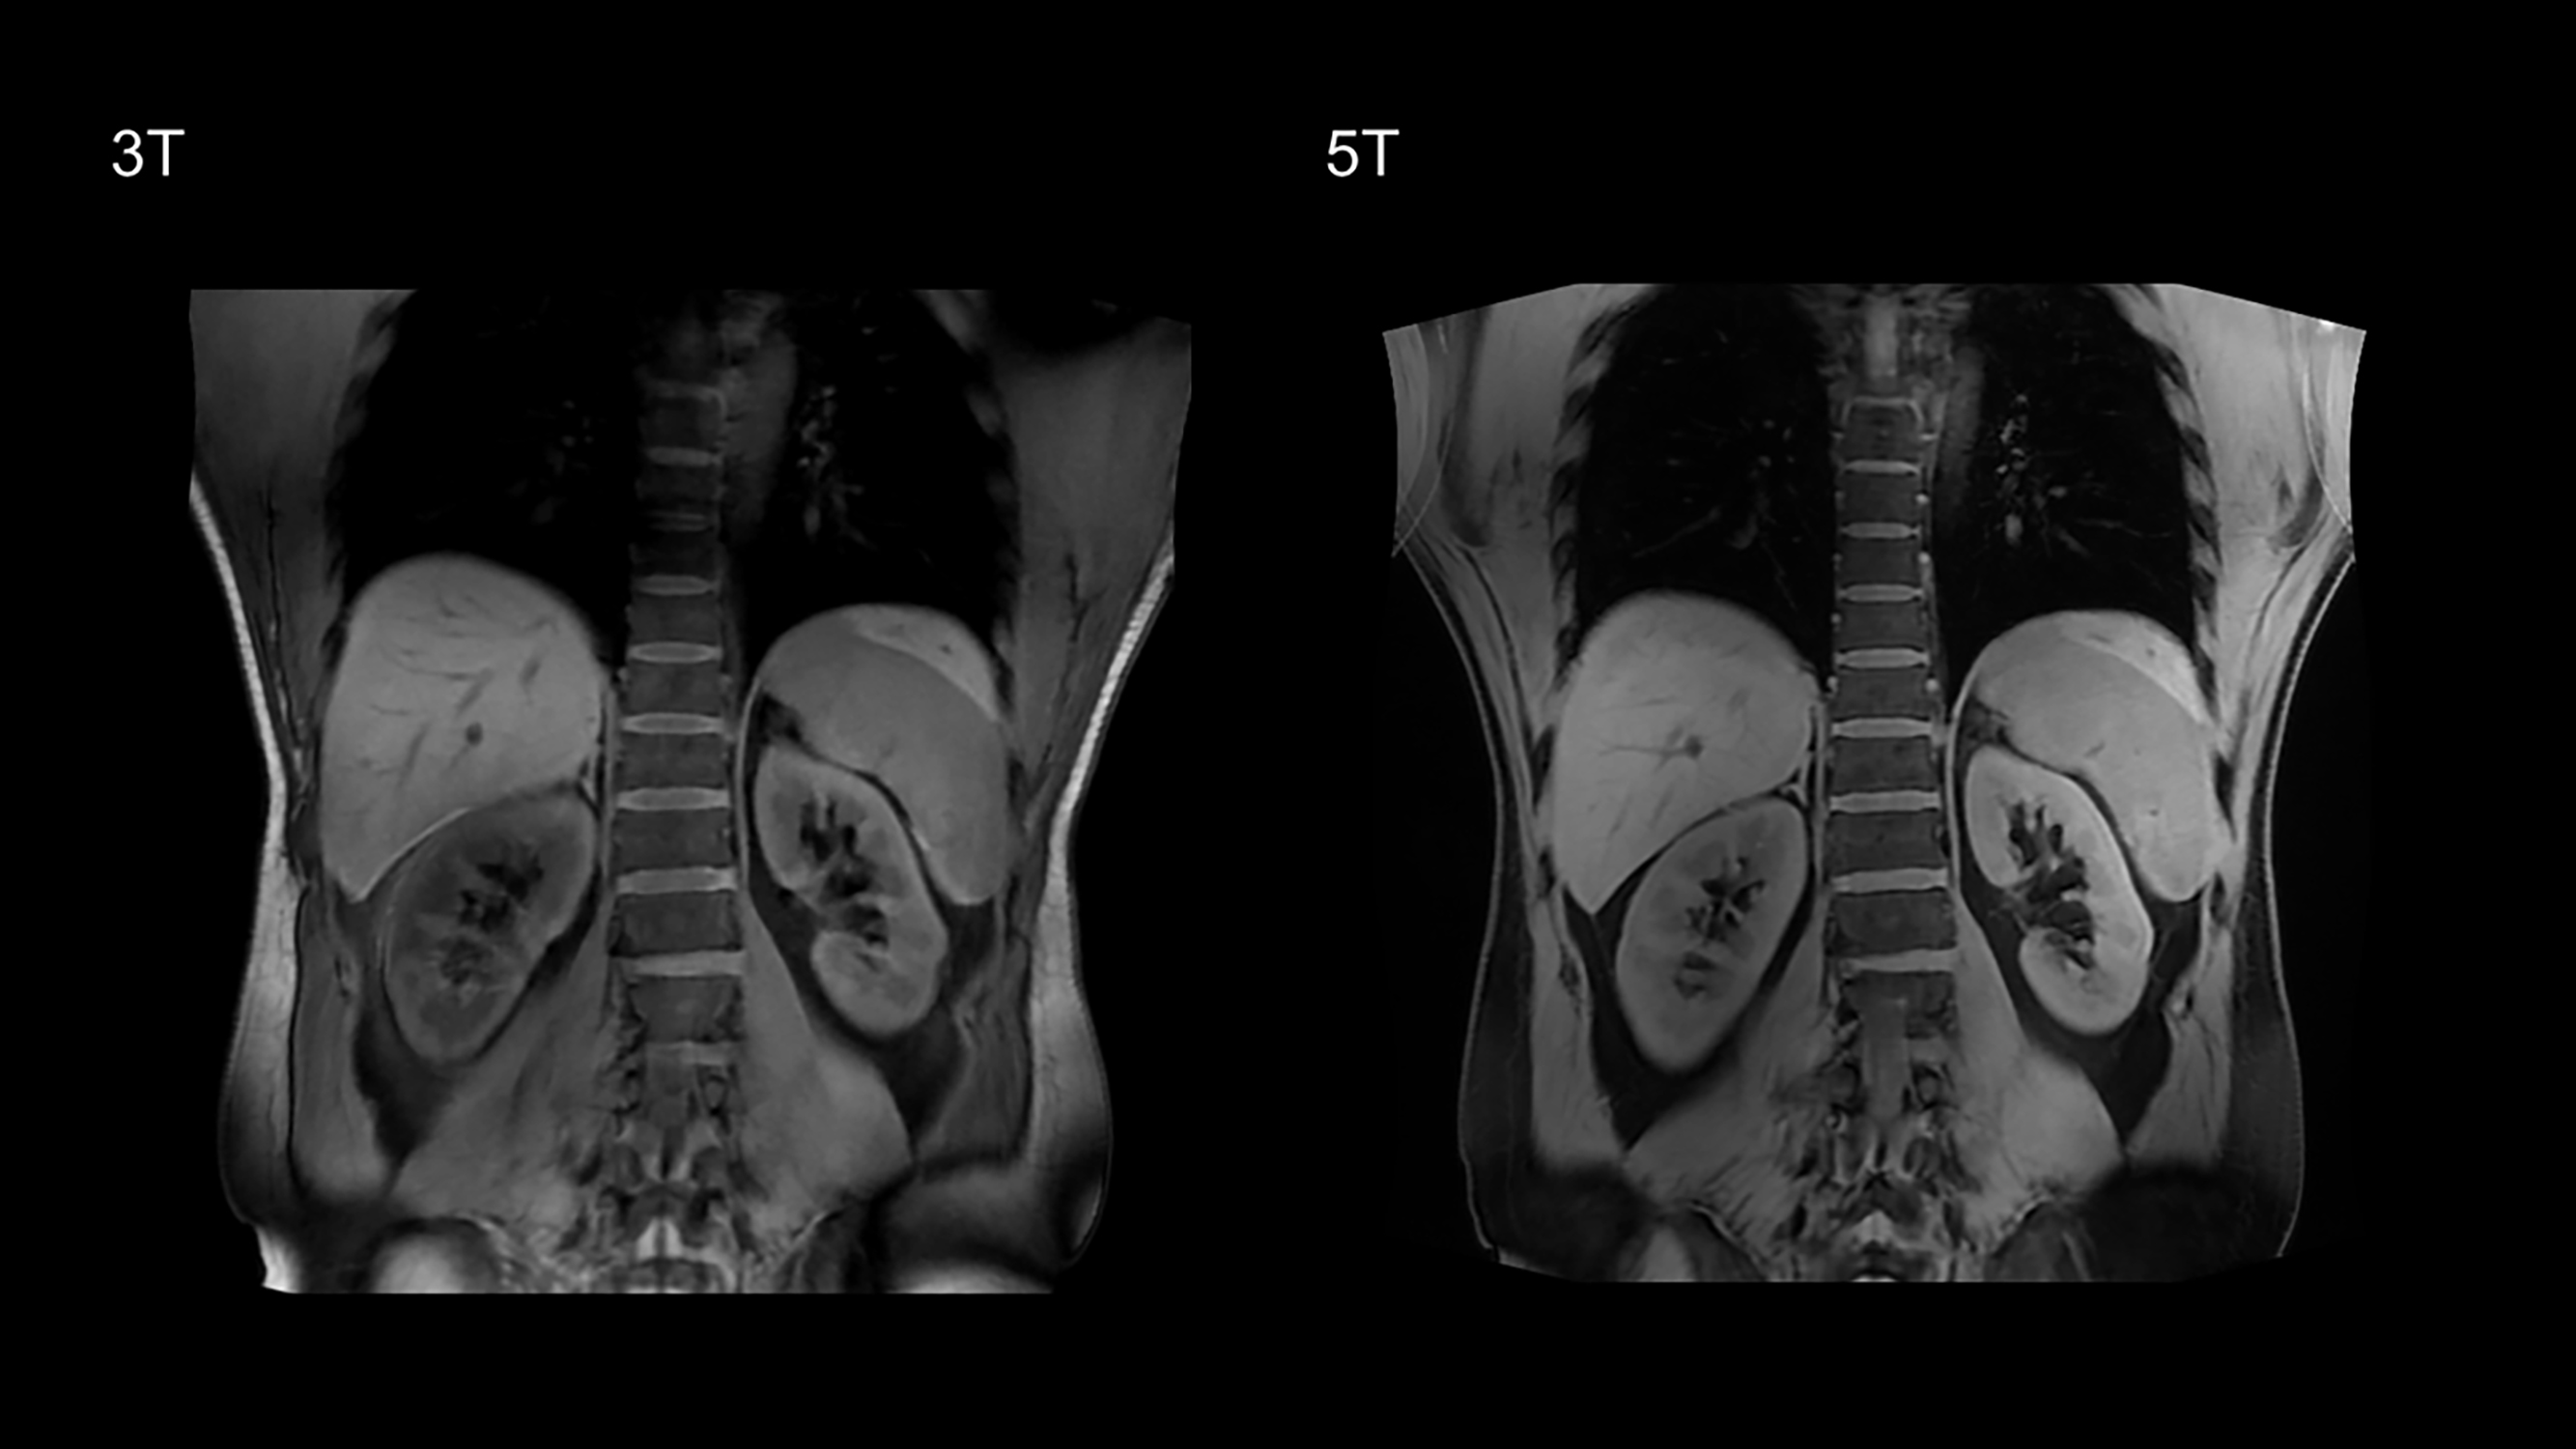
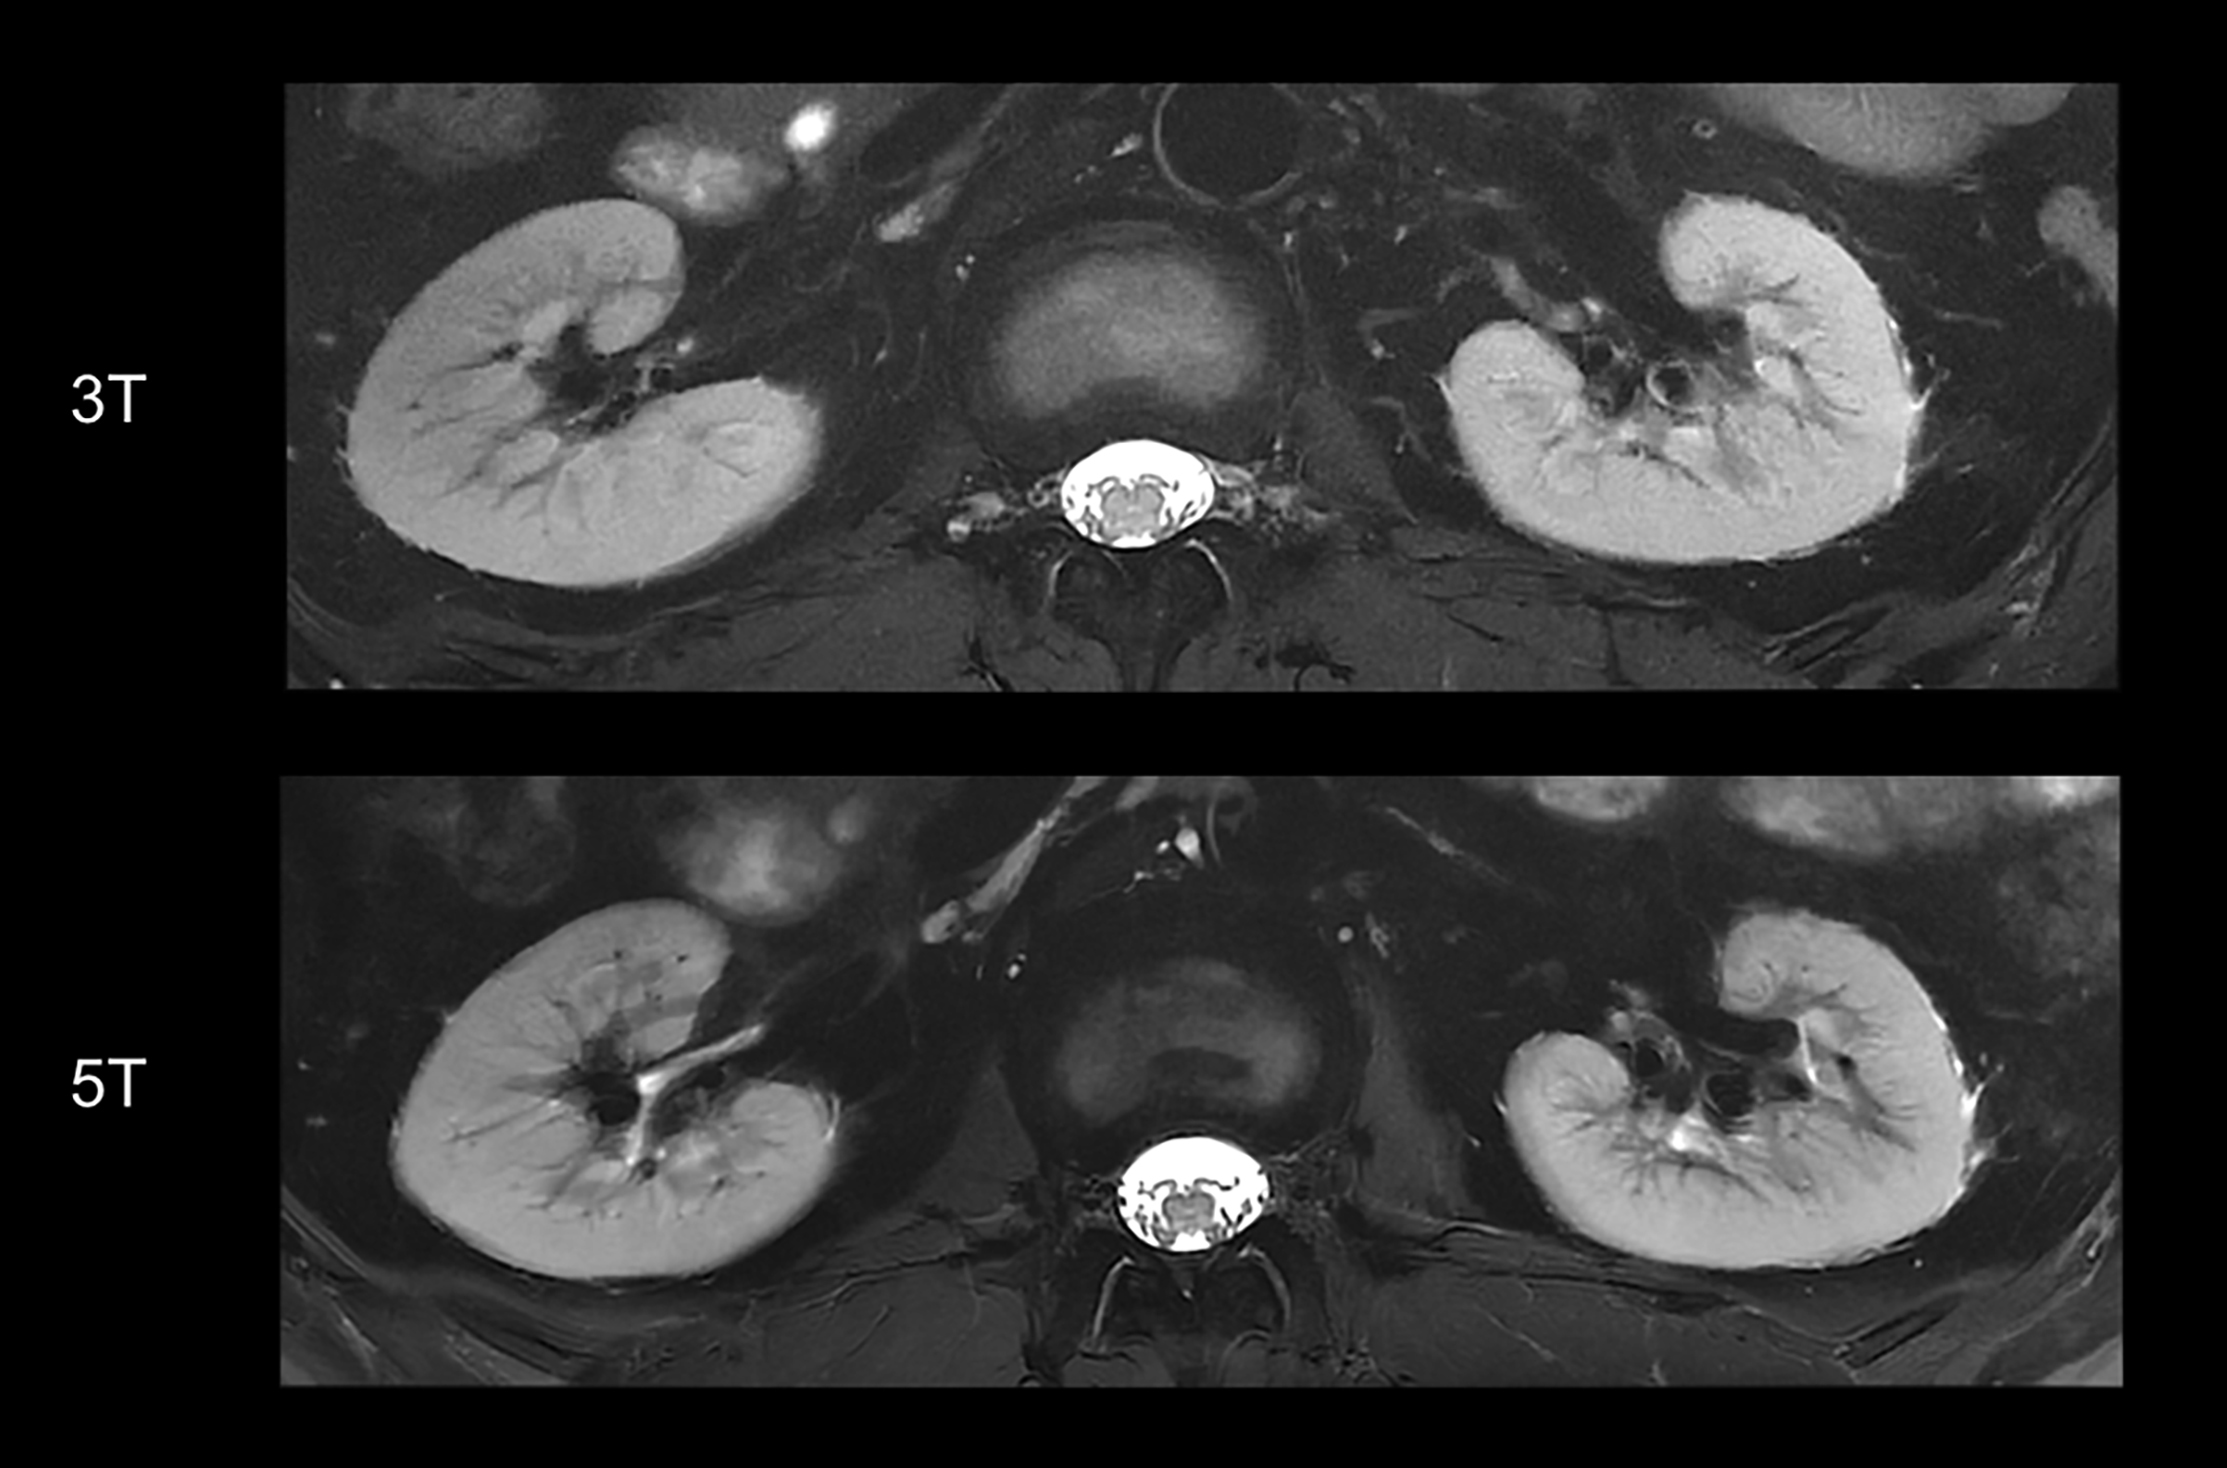
All 5T examinations were performed successfully and were well tolerated by the subjects without any side effects. Representative anatomical images and functional maps are shown in Figure 1-4.For all the sequences, the image quality of 5T images was significantly higher than 3T images (P < 0.05) while there was no significant difference between the present of artifacts. Compared to 3T MRI, the SNR of cortex at 5T MRI achieved 1.5-fold in T1-weighted sequence, 1.2-fold in T2-weighted sequence, 1.5-fold in DWI, and 1.2-fold in T2* mapping. The SNR of medulla at 5T MRI achieved 1.5-fold in T1-weighted sequence, 1.2-fold in T2-weighted sequence, 1.6-fold in DWI, and 1.2-fold in T2* mapping. Besides, the CNR of cortex/medulla at 5T MRI provided approximately 1.5-, 1.4-, 1.8-, and 1.5-fold increase from 3T to 5T in T1-weigthed, T2-weighted, DWI, and T2* mapping sequences, respectively.
For the functional maps, ADC of the cortex was significantly higher than that of the medulla at both 3T and 5T (P < 0.05). There were no statistically significant differences for the ADCs between 3T and 5T. Further, T2* value of the cortex was also significantly higher than that of the medulla at both 3T and 5T (P < 0.05). Compared to 3T, renal MRI at 5T resulted in significantly shorter T2* values in both cortex (66.14 ms in 3T and 44.62 ms in 5T) and medulla (30.39 ms in 3T and 16.67 ms in 5T).
Discussion/Conclusion
This first attempt at dedicated 5T renal imaging revealed the diagnostic potential. At 5T, SNR of cortex and medulla and CNR of cortex/medulla were significantly higher than that at 3T, leading to improved corticomedullary discrimination. The improved SNR and CNR has been shown to be beneficial in various applications of diagnostic high-field MRI [3, 4]. For the functional maps, renal DWI at 5T held a similar ADC range with that at 3T, which is expected as ADC is not affected by the field strength. In accordance with previous studies [5, 6], T2* relaxation times decreased with the increase of magnetic field strength.Acknowledgements
No acknowledgement found.References
1. de Boer, A., et al., 7 T renal MRI: challenges and promises. Magnetic Resonance Materials in Physics, Biology and Medicine, 2016. 29(3): p. 417-433.
2. Umutlu, L., et al., Renal imaging at 7 Tesla: preliminary results. European radiology, 2011. 21(4): p. 841-849.
3. Akisik, F.M., et al., Abdominal MR imaging at 3.0 T. Radiographics, 2007. 27(5): p. 1433-1444.
4. Barth, M.M., et al., Body MR imaging at 3.0 T: understanding the opportunities and challenges. Radiographics, 2007. 27(5): p. 1445-1462.
5. Siedek, F., et al., Assessing renal changes after remote ischemic preconditioning (RIPC) of the upper extremity using BOLD imaging at 3T. Magnetic Resonance Materials in Physics, Biology and Medicine, 2018. 31(3): p. 367-374.
6. Haneder, S., et al., Quantitative in vivo 23 Na MR imaging of the healthy human kidney: determination of physiological ranges at 3.0 T with comparison to DWI and BOLD. Magnetic Resonance Materials in Physics, Biology and Medicine, 2013. 26(6): p. 501-509.
Figures