3245
Abdominal imaging at 5.0 Tesla: Preliminary results1Shanghai Institute of Medical Imaging, Shanghai, China, 2United Imaging Healthcare, Shanghai, China, 3Department of Radiology, Zhongshan Hospital, Fudan University, Shanghai, China
Synopsis
Higher magnetic field strength leads to an increase of the SNR. On the other hand, the increase of magnetic field strength implies larger magnetic susceptibility inhomogeneities. Recently, 5.0T whole body magnetic resonance imaging system has been introduced into research and clinical settings. In this study, we evaluated the feasibility of abdominal imaging at 5T and compared the image quality and potential artifacts with 3T. Our results indicated that 5T MRI is able to acquire artifact-free anatomical images of the abdomen. Compared to 3T MRI, abdominal MRI at 5T resulted in comparable image quality and better contrast ratios.
Introduction
Motivated by the promise of higher signal–to–noise ratio (SNR), increased resolution and/or reduced imaging time, new or better tissue contrast, and improved parallel imaging performance, human MRI at ultra-high magnetic fields has been a major research focus [1-3]. However, ultra-high field MRI encountered numerous challenges, especially in abdominal imaging. The abdominal imaging applications at ultra-high-field strength are known to be impaired by radiofrequency (RF) inhomogeneities due to the short wavelength of the RF field and enhanced tissue absorption, leading to strong flip angle variations and limited penetration depth [4]. Besides, the availability of 7T MRI for clinical use is limited. In the current study we employed a 5T MRI-scanner to acquire abdominal imaging and showed that it is indeed possible to obtain artifact-free anatomical images of the abdomen at 5 Tesla.Methods
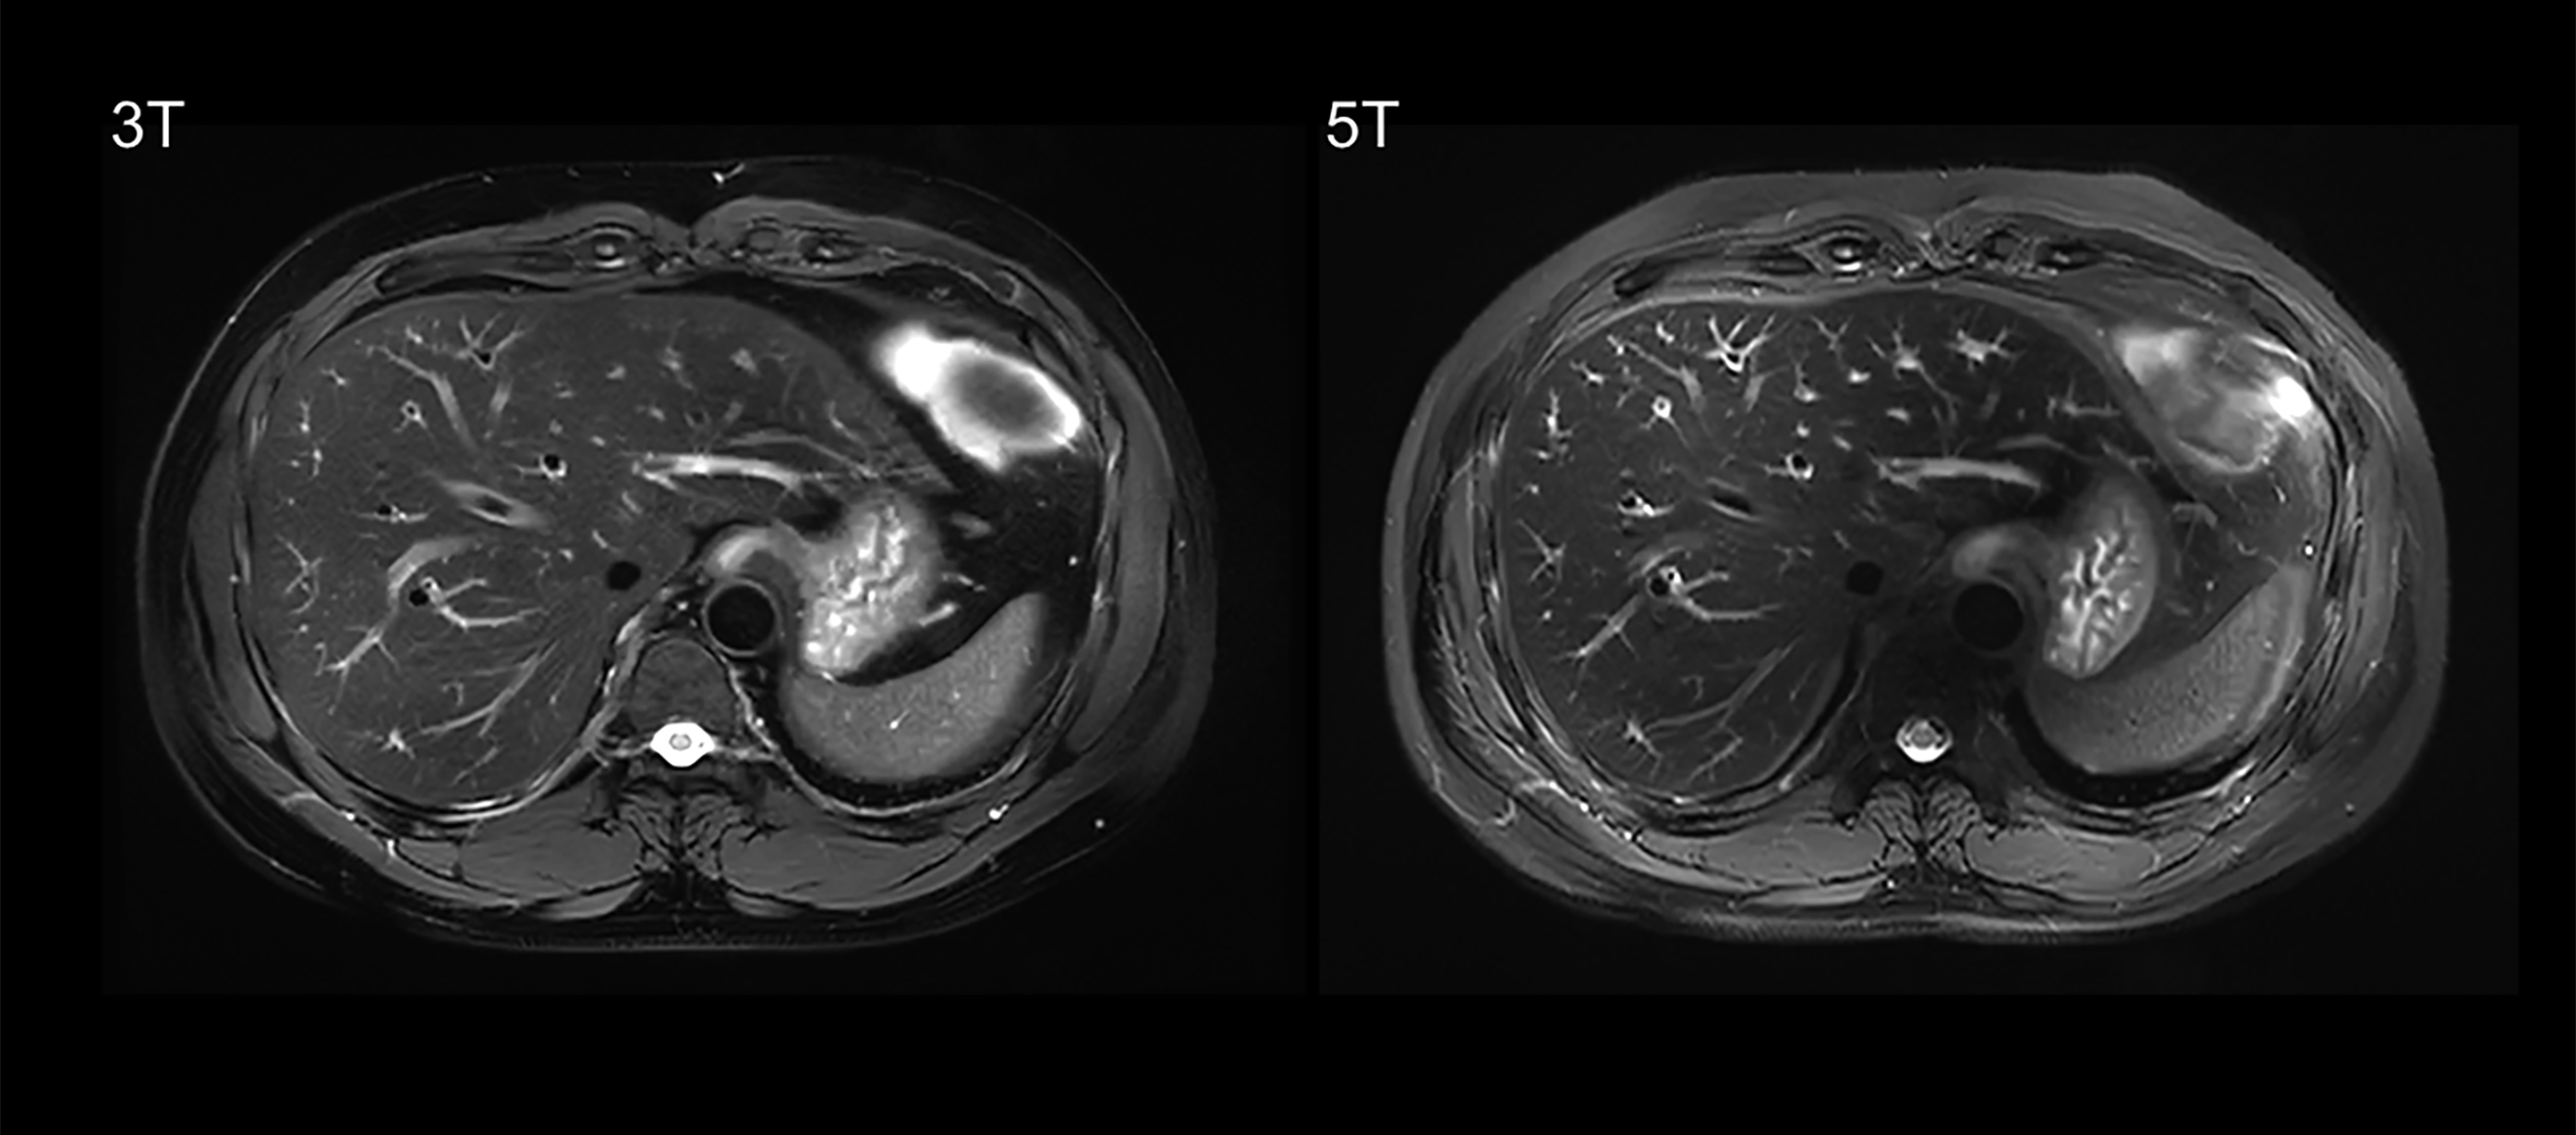
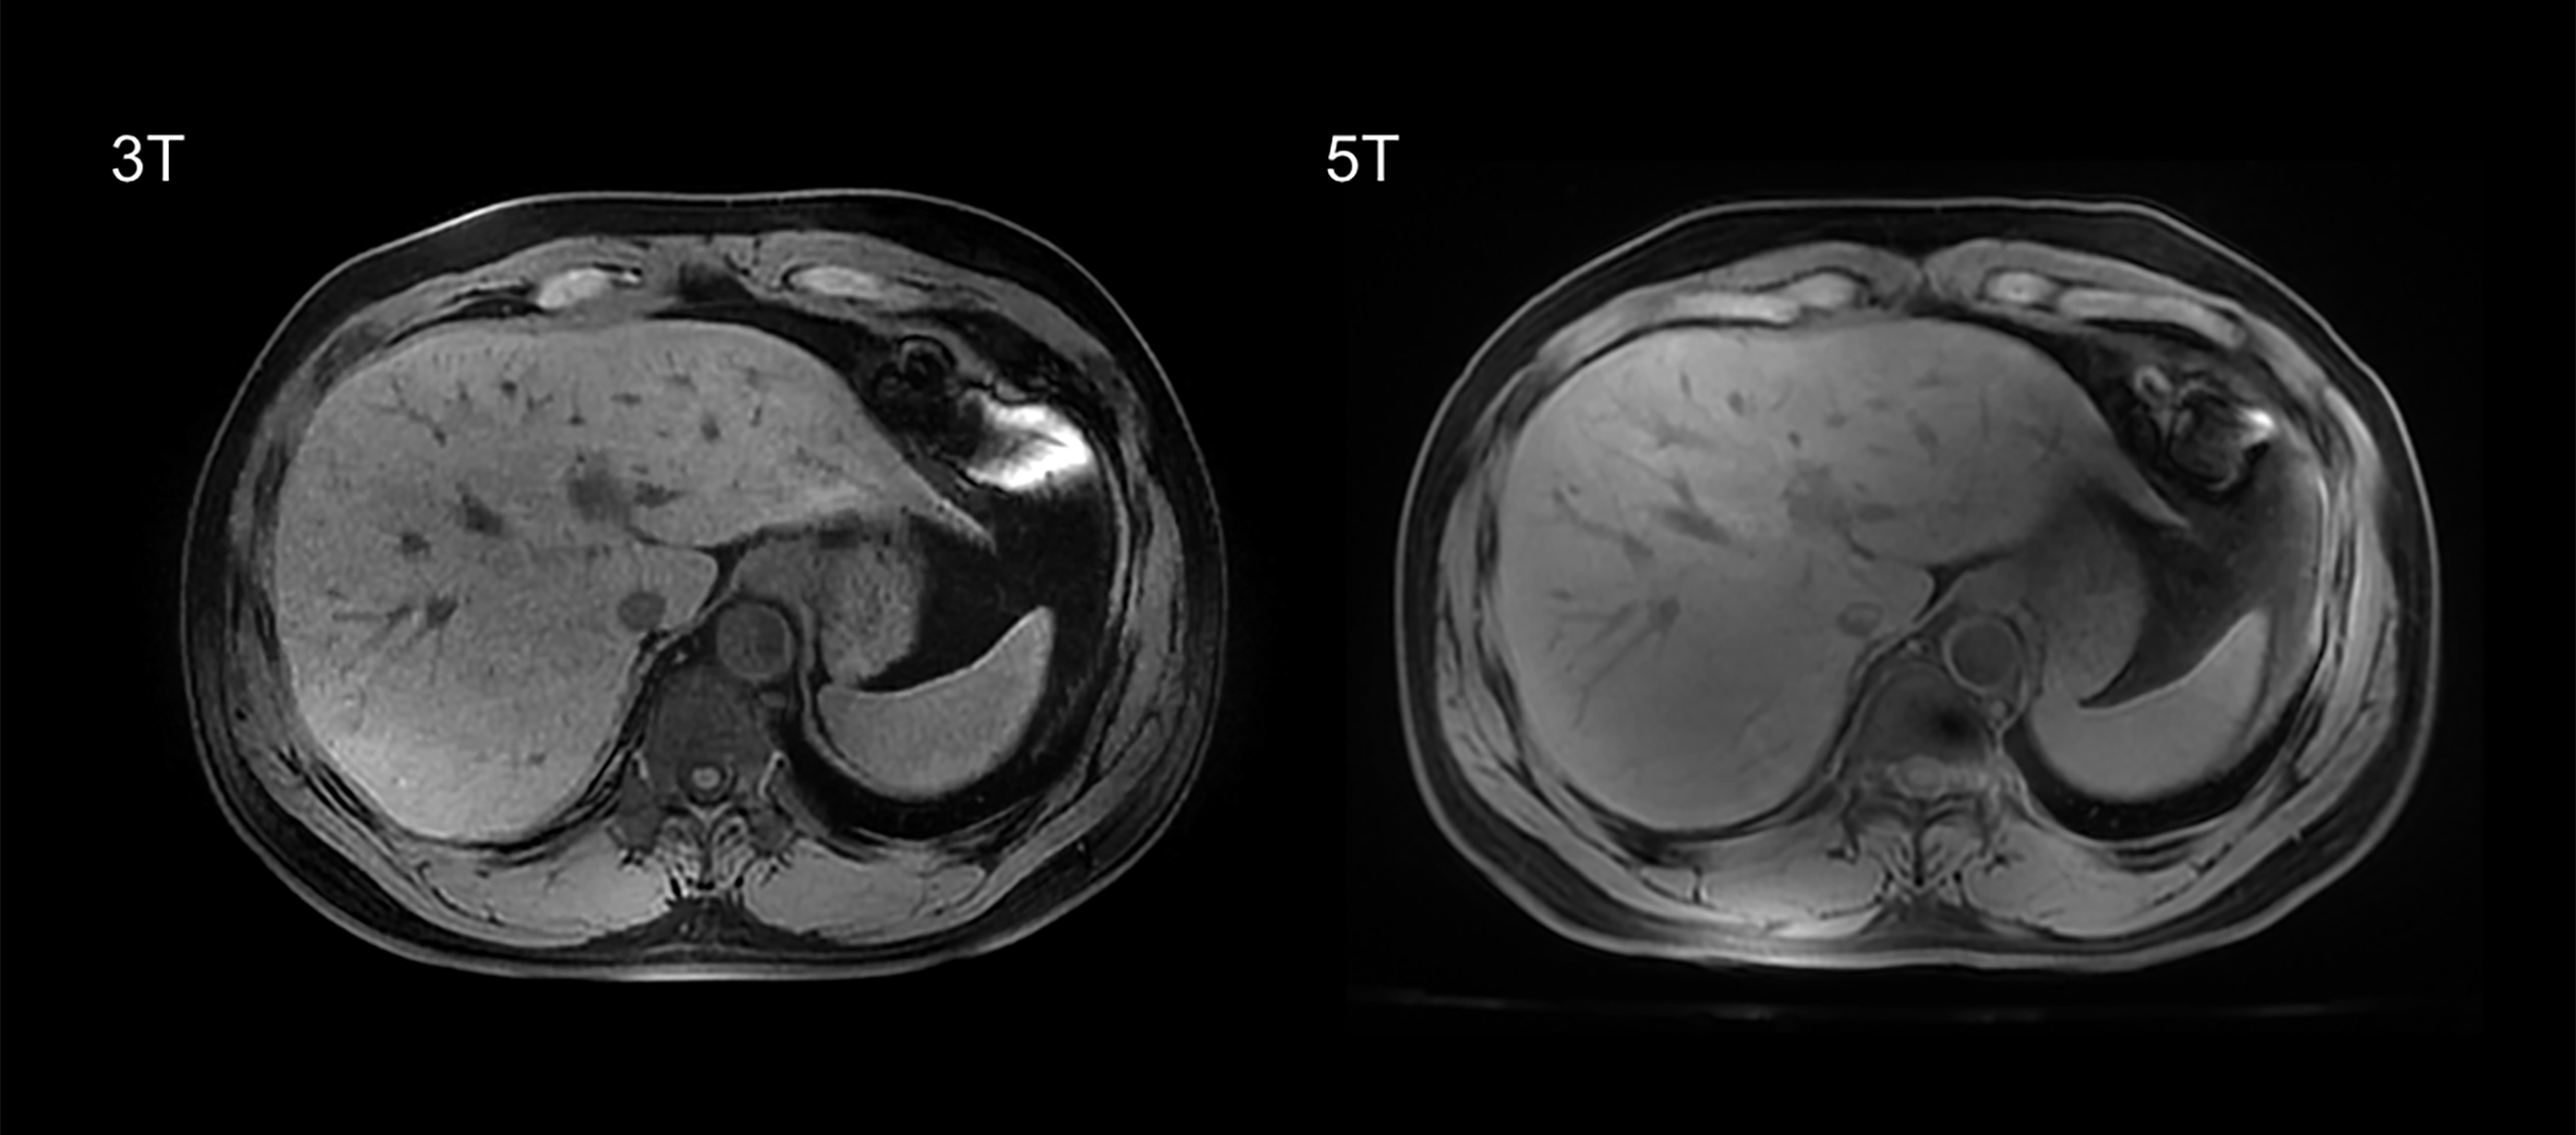
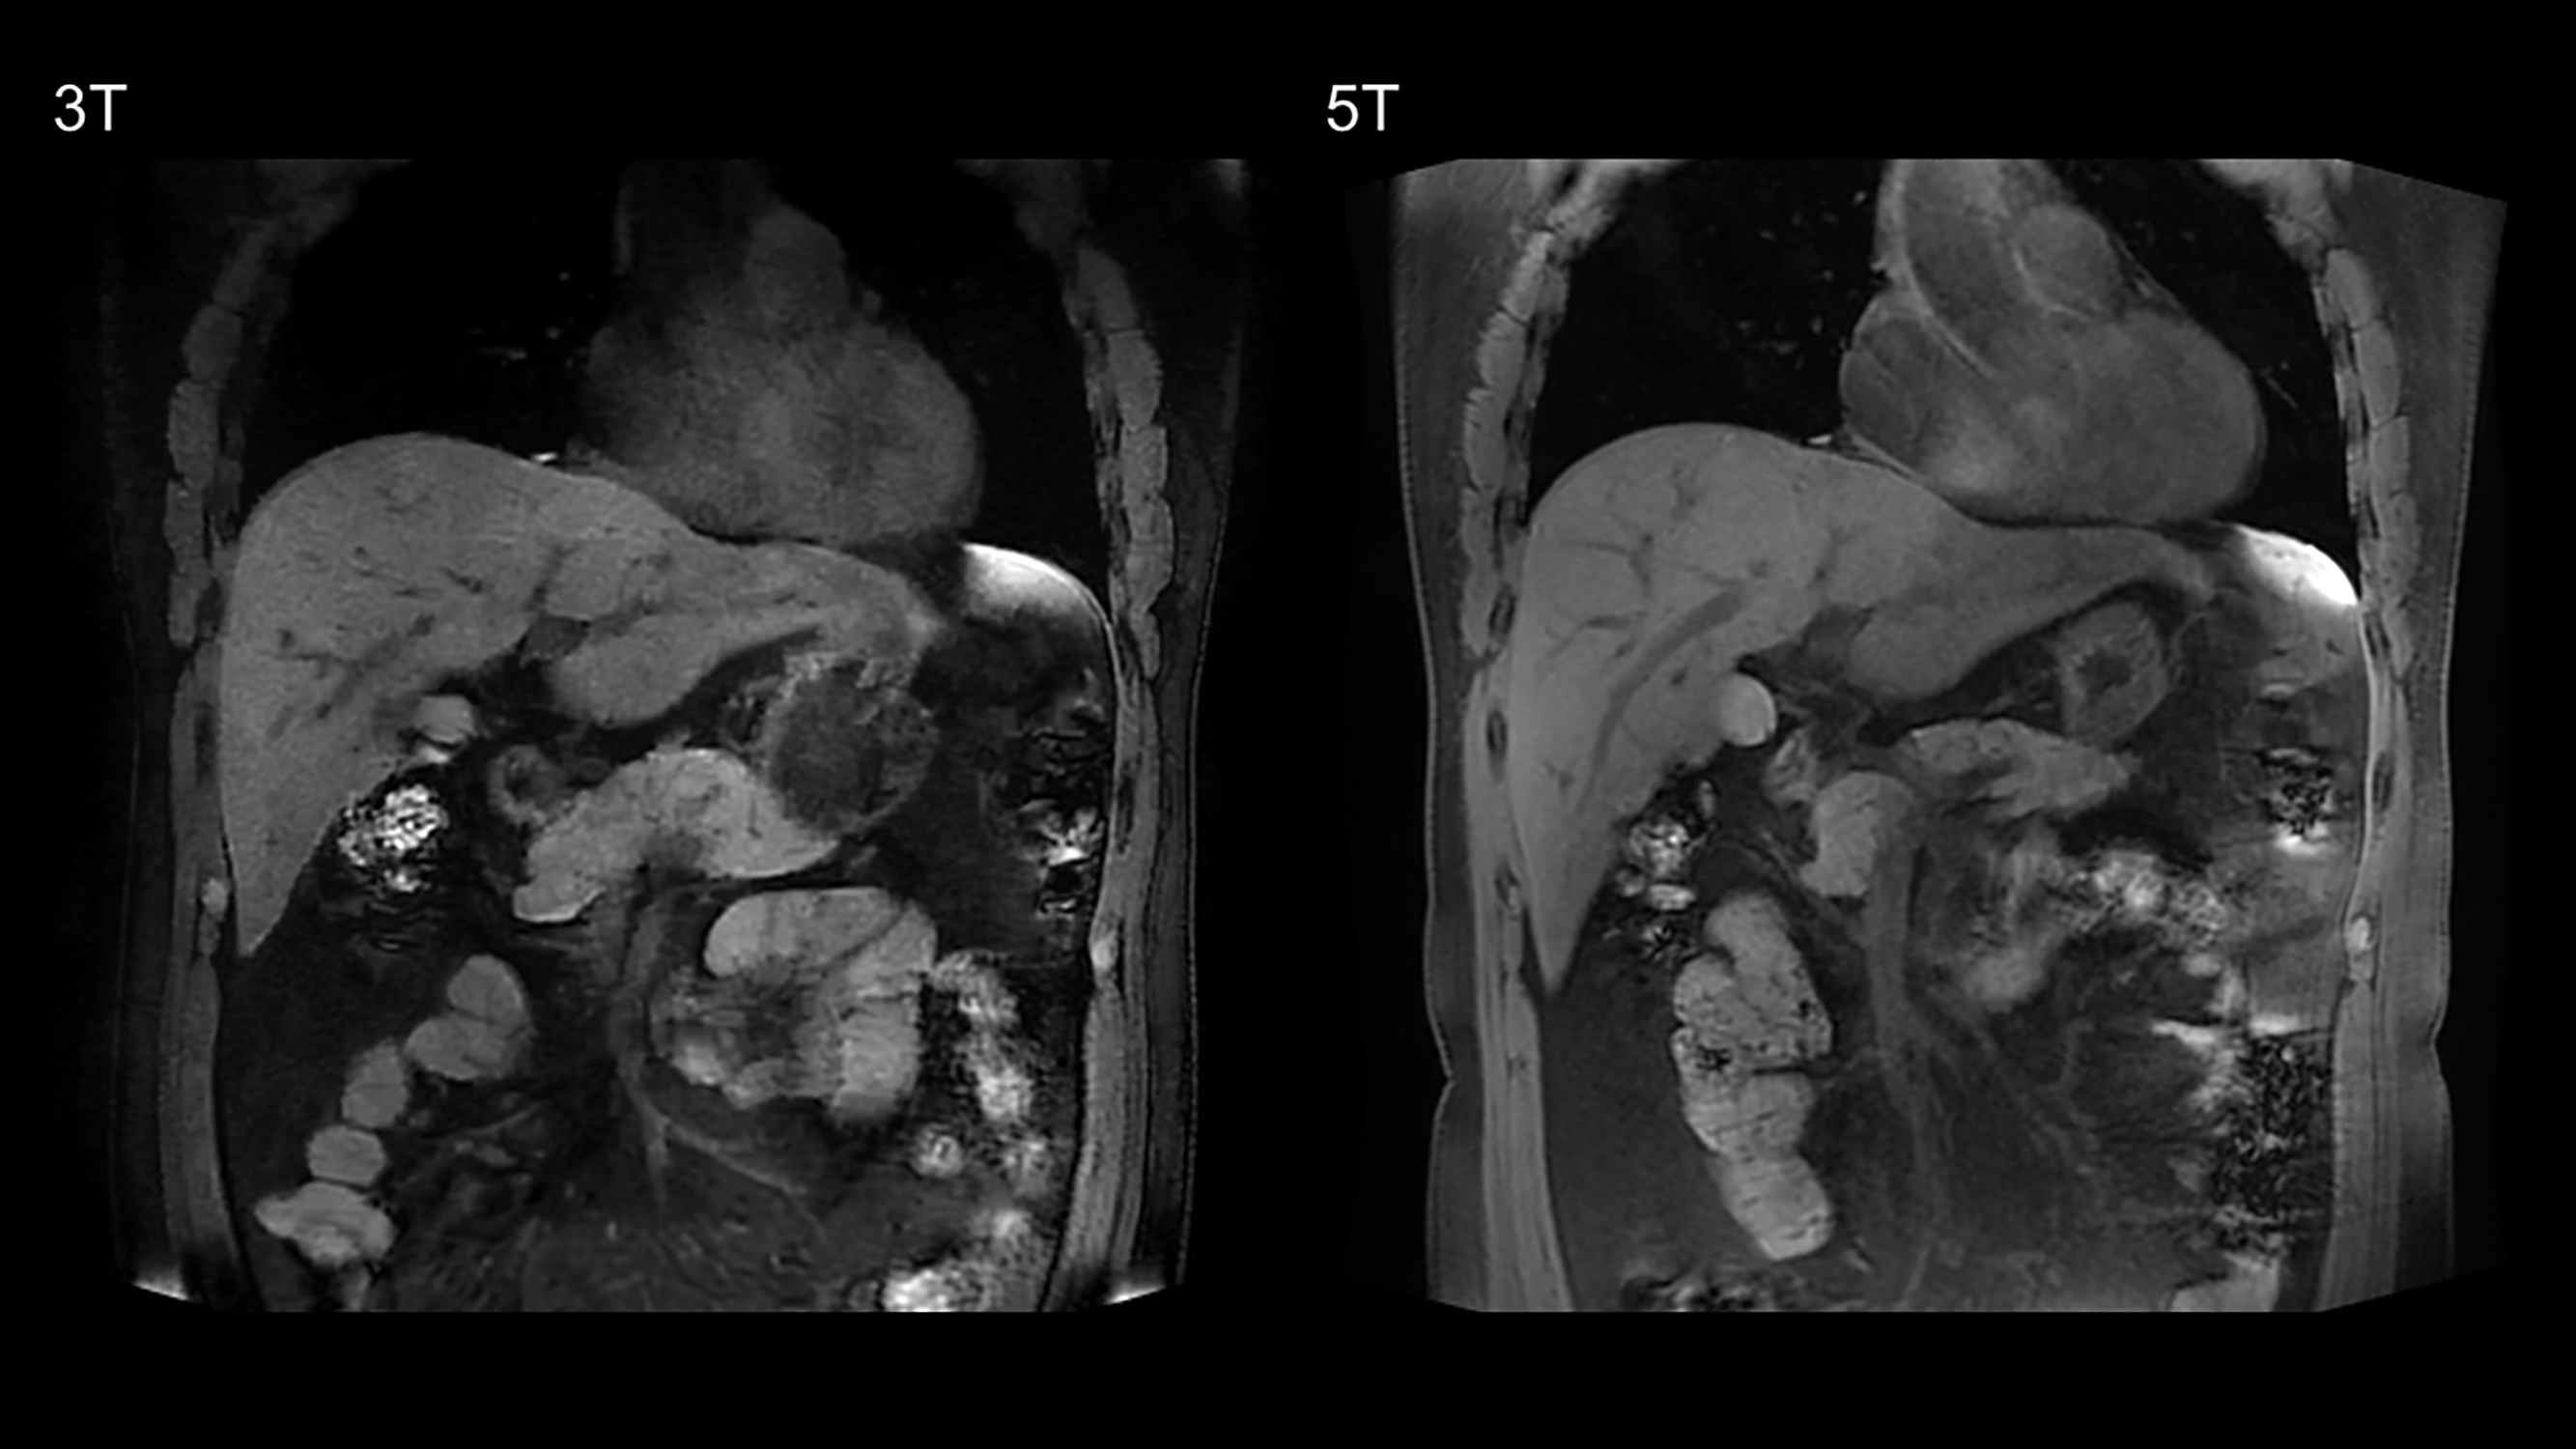
Eighteen healthy volunteers (12 male and 6 female subjects) were included in this study. The MRI examination was performed with a 3.0 Tesla MRI-scanner (uMR 790, United Imaging Healthcare, Shanghai, China) and a 5.0 Tesla MRI-scanner (uMR Jupiter, United Imaging Healthcare, Shanghai, China), respectively. A 24-channel body coil was used for all studies at 5T using local B1+ shimming for B1+ optimization. MR protocols were: a) transverse breath-hold T1-weighted volume interpolated gradient echo sequence with fat suppression (QUICK 3D) (For 3T, TR/TE = 3.49/1.48 ms, FA = 15°; For 5T, TR/TE = 3.49/1.45 ms, FA = 20°; Other parameters were the same: FOV = 300×400 mm, Matrix = 408×544, Slice Thickness = 3 mm, 66 slices); b) coronal breath-hold T1-weighted QUICK 3D with fat suppression (For 3T, TR/TE = 3.84/1.65 ms, FA = 15°; For 5T, TR/TE = 3.84/1.6 ms, FA = 25°; Other parameters were the same: FOV = 380×480 mm, Matrix = 456×456, Slice Thickness = 3 mm, 64 slices); c) transverse T2-weighted fat-saturated fast spin echo (FSE) sequence with respiratory trigger (For 3T, TE = 88 ms; For 5T, TE = 83.52 ms; Other parameters were the same: FA = 130°, FOV = 300×380 mm, Matrix = 306×456, Slice Thickness = 6 mm, 24 slices; TR depends on the respiratory interval of participants).Two experienced radiologists independently evaluated the image quality using a four-point-scale (4 = excellent, 1 = non-diagnostic) for overall image quality, hepatic margin sharpness, and portal vein clarity. Artifacts including B1 inhomogeneities, chemical shift, susceptibility and motion artifacts were also graded on a four-point-scale (4 = no image impairment, 1 = non-diagnostic due to artifact). Besides, T1-weighted sequences were evaluated for the delineation of non-enhanced arterial (4 = excellent, 1 = not visible).
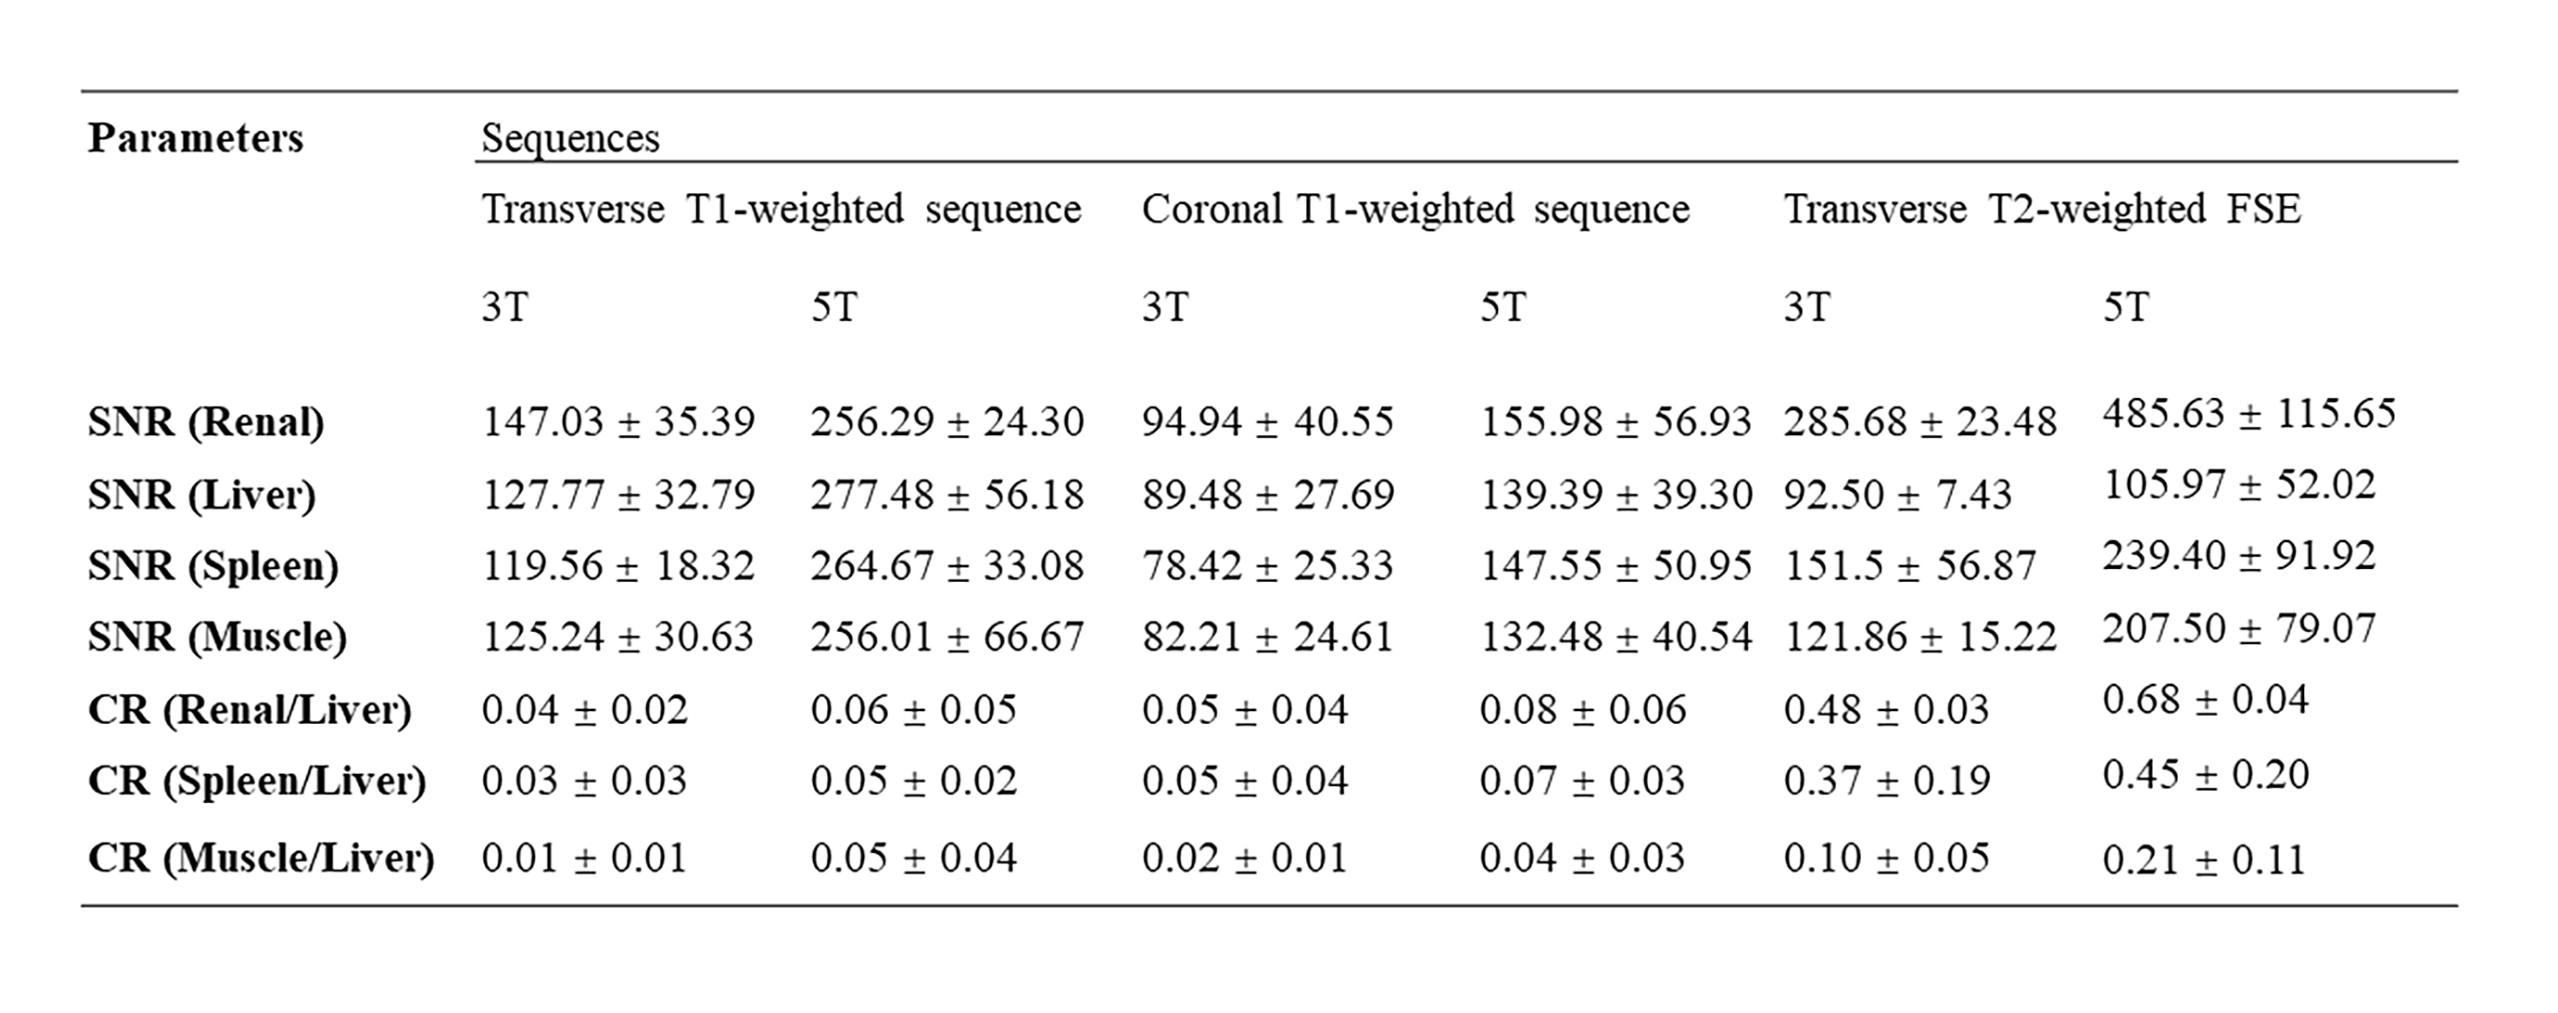
For quantitative evaluation, two experienced radiologists consensually placed ROIs on liver-, spleen-, renal cortex-, and muscle tissue. To minimize spatial variation effects, the ROIs were of identical size and placed in identical positions in all images avoiding the inclusion of confounding structures like blood vessels. Similar to prior comparison study [5], contrast ratio (CR) was calculated as $$CR=(|Signalliver-Signaltissue|)/(Signalliver+Signaltissue)$$. Besides, based on these four ROIs, SNR was calculated by the ratio of the mean signal value and the standard deviation (SD) of the background. Image noise was defined as the shared SD out of the three ROI measurements outside the body.
The degree of agreement between the two radiologists at qualitative analysis was assessed with the kappa statistic (0 - 0.2, slight agreement; 0.21- 0.4, fair agreement; 0.41 - 0.60, moderate agreement; 0.61 - 0.8, substantial agreement; > 0.8, excellent agreement). Wilcoxon Rank Test was used to compare the visual evaluation scores, SNRs and CRs between 3T and 5T MRI for each sequence. P-value < 0.05 was considered to represent statistically significant differences.
Results
Example of 5T MRI and 3T MRI for each sequence was shown in Figure 1-3. For all the sequences, interobserver agreement achieved substantial to excellent in image quality score and artifacts score (κ > 0.7). All the sequences at 5T showed comparable image quality and artifacts with 3T MRI (P > 0.05). Besides, for the delineation of non-enhanced arterial, both transverse T1-weighted sequence (mean score 2.17 for 3T, mean score 2.94 for 5T) and coronal T1-weighted sequence (mean score 2.11 for 3T, mean score 3.17 for 5T) at 5T MRI demonstrated higher conspicuity of the intraabdominal vessels (P < 0.05).As shown in Table 1, 5T MRI contributed to higher SNR and CR for all analyzed tissues in all the sequences.
Discussion & Conclusion
This study proved that it is possible to obtain artifact-free anatomical images of the abdomen at 5 Tesla. Despite the lack of intravenous contrast agent, the inherently high signal intensity of the arterial vasculature in T1-weigthed sequence at 5T provided high-quality conspicuity of the intraabdominal vessels, which benefits non-contrast imaging. Besides, 5T MRI contributed to higher SNR and CR for all main tissues in anatomical images. Prior studies stated that these higher SNR enabling an improvement in the evaluation of anatomical details as well as increased accuracy for the depiction of pathological findings [6-8]. Functional abdominal imaging needs to be further validated in the future study.Acknowledgements
No acknowledgement found.References
1. Uğurbil, K., The road to functional imaging and ultrahigh fields. Neuroimage, 2012. 62(2): p. 726-735.
2. Nakada, T., Clinical application of high and ultra high-field MRI. Brain and Development, 2007. 29(6): p. 325-335.
3. Von Morze, C., et al., Intracranial time‐of‐flight MR angiography at 7T with comparison to 3T. Journal of Magnetic Resonance Imaging: An Official Journal of the International Society for Magnetic Resonance in Medicine, 2007. 26(4): p. 900-904.
4. Kraff, O. and H.H. Quick, 7T: Physics, safety, and potential clinical applications. Journal of Magnetic Resonance Imaging, 2017. 46(6): p. 1573-1589.
5. von Falkenhausen, M., et al., Intra-individual comparison of image contrast in SPIO-enhanced liver MRI at 1.5 T and 3.0 T. European radiology, 2007. 17(5): p. 1256-1261.
6. Kollia, K., et al., First clinical study on ultra-high-field MR imaging in patients with multiple sclerosis: comparison of 1.5 T and 7T. American Journal of Neuroradiology, 2009. 30(4): p. 699-702.
7. Regatte, R.R. and M.E. Schweitzer, Ultra‐high‐field MRI of the musculoskeletal system at 7.0 T. Journal of Magnetic Resonance Imaging: An Official Journal of the International Society for Magnetic Resonance in Medicine, 2007. 25(2): p. 262-269.
8. Barisano, G., et al., Clinical 7 T MRI: Are we there yet? A review about magnetic resonance imaging at ultra-high field. The British journal of radiology, 2019. 92(1094): p. 20180492.
Figures