3216
In Vivo Relaxation-Diffusion Correlation Revealed MRI Distribution Spectra of the Human Brain Using Genetic Algorithm Optimized Acquisitions1State Key Laboratory of Brain and Cognitive Sciences, Beijing MRI Center for Brain Research, Institute of Biophysics, Chinese Academy of Sciences, Beijing, China, 2University of Chinese Academy of Sciences, Beijing, China, 3Brainnetome Center, Institute of Automation, Chinese Academy of Sciences, Beijing, China, 4Siemens Shenzhen Magnetic Resonance Ltd., Shenzhen, China, 5CAS Center for Excellence in Brain Science and Intelligence Technology, Chinese Academy of Sciences, Beijing, China, 6Beijing Institute for Brain Disorders, Beijing, China, 7Institute of Biophysics, Chinese Academy of Sciences, Beijing, China
Synopsis
Multidimensional MRI experiments have shown unique significance in resolving the correlations between physical parameters and relaxation properties. This study showed T1 Relaxation-Diffusion correlation imaging spectra of an in vivo human brain and a multicomponent phantom with optimized acquisitions. The acquisition paradigm was obtained from genetic algorithm (GA) by maximizing the singular values of the corresponding kernel functions. We detected significant differences in these spectra inversed from different components, which might help to identify tissue microstructure at the sub-voxel resolution. Our study offered a high probability of applying multidimensional MRI techniques in diagnosing neurological diseases.
Introduction
The multidimensional MRI experiments can improve resolving power of the relaxation/diffusion methodology. This technique has been widely used in material characterization and attracted attention recently for biomedical application1,2. Biological samples are particularly composed of multiple compounds with various structures. For example, three major structures in our brain are white matter (WM), grey matter (GM), and cerebrospinal fluids (CSF). Each of them also contains neurons, myelin, axons or microbleeds individually, but the 1D experiments may not measure those subunits. In this situation, the 2D experiment is preferable because of its potential to image at the sub-voxel resolution. Previous studies of multidimensional MRI haven’t optimized the acquisition parameters and seldom have in vivo human imaging. In this study, GA was adopted to get optimized acquisition parameters by editing the kernel functions, and in vivo T1-D distribution spectra of the human brain were achieved.Methods
T1-D MRI signal takes the general form of3:$$ S(\tau_1,b)=\iint F(T_1,D)K_D (b,D) K_{T_1} (\tau_1,T_1 )dT_1 dD $$
in which τ1 and b are experimental parameters (inversion time and diffusion b-value) in MRI acquisitions. T1 and D
$$K_{T_1}(\tau_1,T_1\ )=1-2e^{-\tau_1/T_1} $$
$$K_D\ (b,D)=e^{-bD} $$
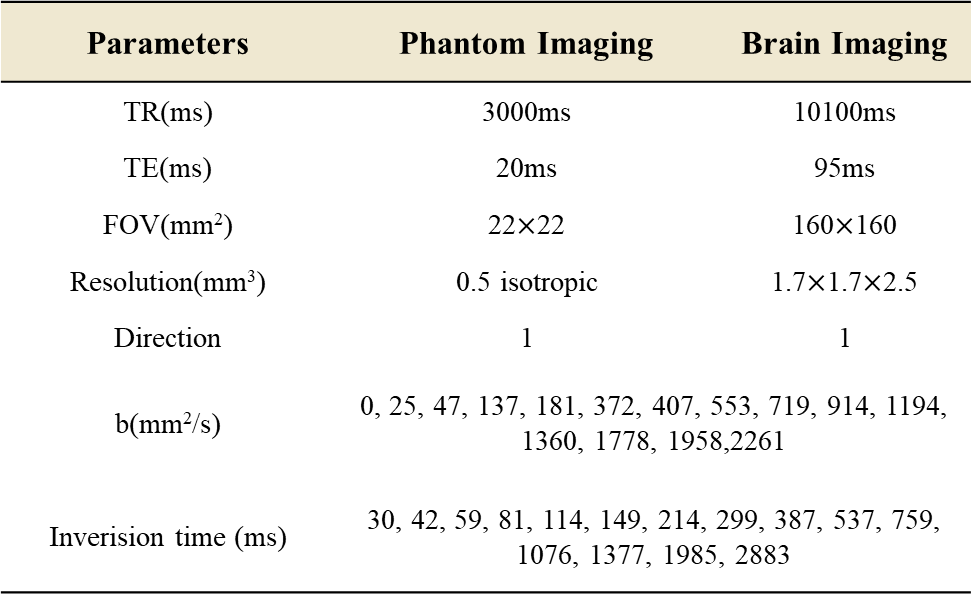
This distribution $$$F(T_1,D)$$$ is usually solved by 2D inverse Laplace transform (2D-ILT)4, which is an ill-conditioned case due to its low-rank character. Singular value decomposition editing has proved effective in ill-conditioned problems, recently expanded to multidimensional MRI acquisitions5. We use GA to generate high-quality solutions by searching problems on biologically inspired operators. Maximizing the singular values of the corresponding kernel functions was utilized as a multi-objective fitness function to calculate a Pareto fraction and evaluate the solutions' accuracy. The acquisition parameters adopted in this study are generated from the standard spaces (logarithmic τ1s and linear gradients) after 5000 generations (Table 1). There is little difference between the optimized and real parameters because of the system's tolerance.
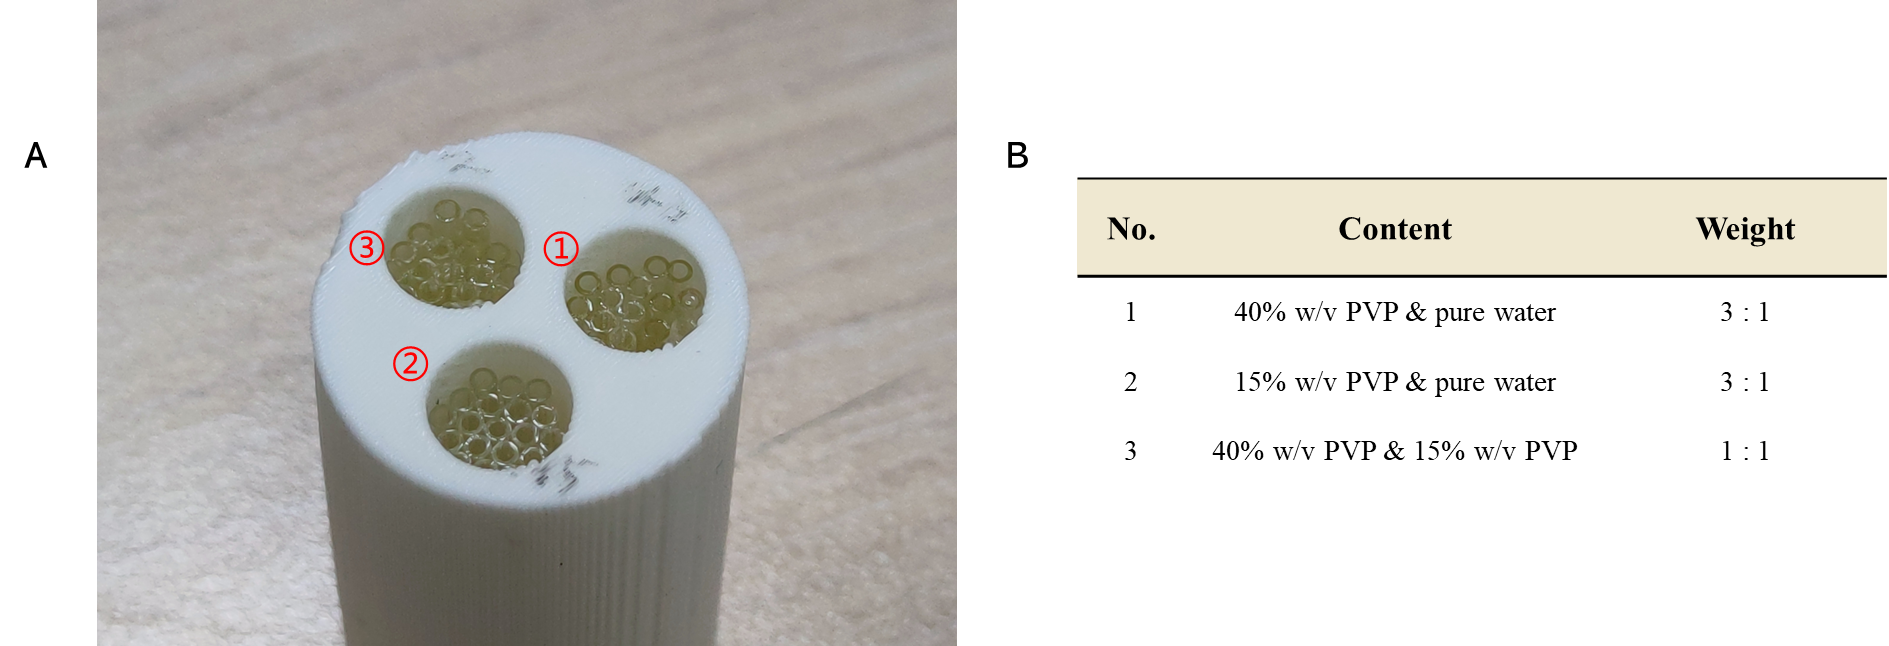
We designed and constructed a multicomponent phantom to verify these optimized acquisitions qualitatively (Fig.1A). The 3D printed shell was a cylinder (23 mm diameter and 40 mm length) with equally-distributed three holes (32mm depth). Solutions of PVP6 (Sigma-Aldrich, K value 10) ranging of 15% and 40% w/v were prepared in pure water. These holes were stuffed with micropipettes (20 μL volume, Hirschmann@; Eberstadt, Garmany) fully filled with two kinds of solutions (Fig.1B).
We did T1map acquisition for reference in both phantom and brain imaging. The inversion times, b-values and other parameters were set according to Table 1. Phantom imaging was performed on a 9.4T horizontal animal MRI system (Bruker Biospec 94/30 USR, Ettlingen) with Paravision 6.0.1. IR-DTI images were acquired using a 2D DTI standard pulse sequence (spin echo acquisition diffusion-weighted). The human brain images were acquired on a 3T system (MAGNETOM Prisma-fit, Siemens Healthcare, Erlangen, Germany). Inversion recovery diffusion-weighted echo-planar imaging (IR–DW–EPI) sequence was utilized to obtain IR-DWI images.
Results and Discussions
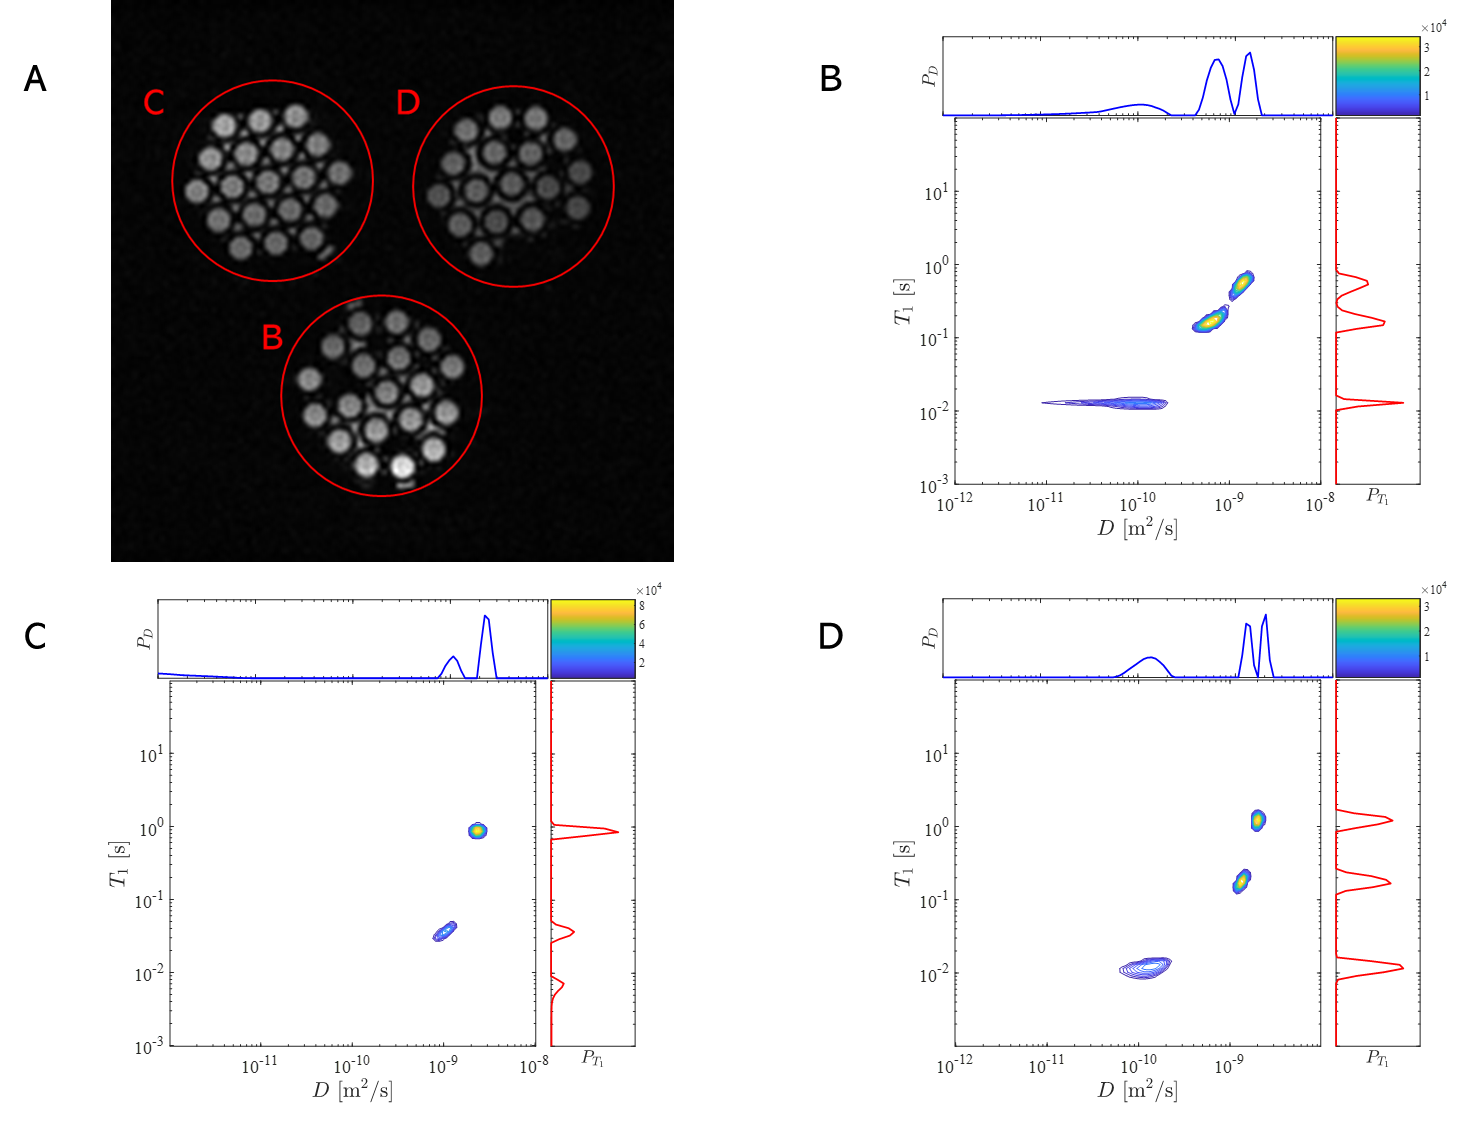
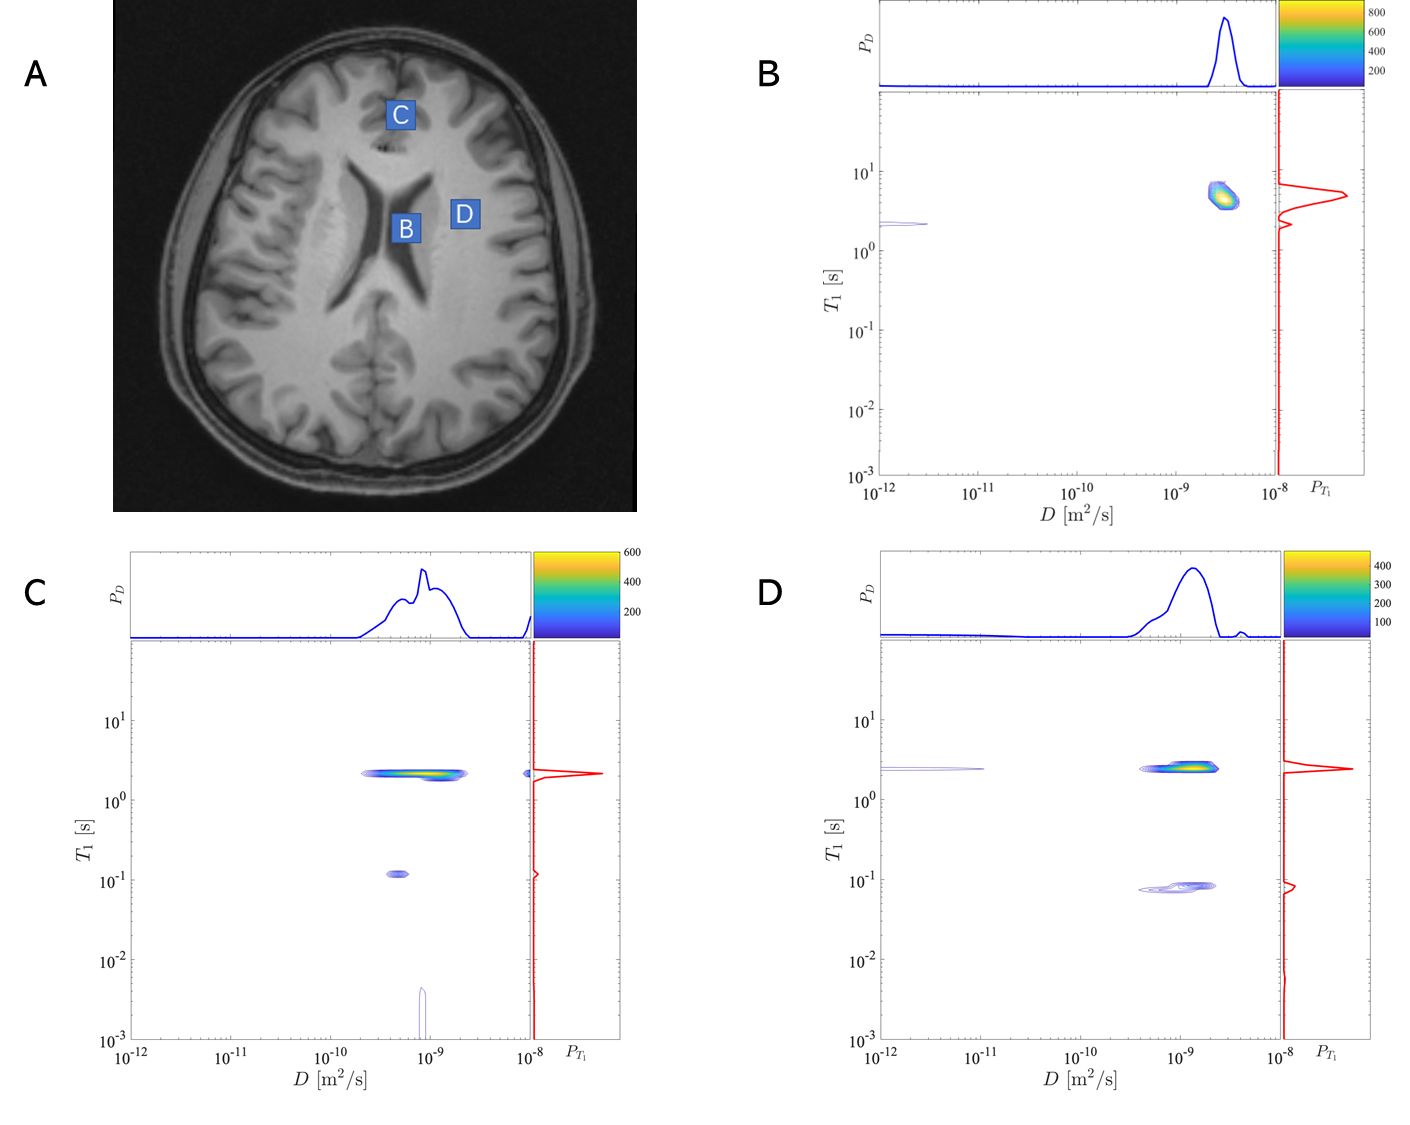
Figs.2A and 3A showed the regions of interest (ROI) in the T1map image, and signals of these ROIs were integral before 2D-ILT. In the T1-D distribution spectra of the phantom (Figs.2B-2D), there were significant sparse peaks with different T1s and diffusivities. In Figs.2B and 2C, there were sharp peaks with obviously large T1 and diffusivity, which should be identified as water's distribution. The other peaks were of similar T1 and diverse diffusivity, which matched the characters of different contents in PVP solutions. There might be some solution sprinkled, which generated some uncertain contents. That might lead to additional peaks and peaks' area expansion.In the T1-D distribution spectra of the human brain (Figs.3B-3D), the distribution in Fig.3B, which is inversed from the signals of CSF, illustrated the largest T1 and diffusivity. This peak was nearly a circle, which demonstrated good uniformity. Most of the ROI in Figs.3C and 3D were GM and WM, respectively, and the distributions showed similarities because of their attachment. The distribution spectra indicated that T1 of the main peak in Fig.3C was a little larger than that in Fig.3D, while diffusivity in Fig.3D was a bit larger than that in Fig.3C. These features matched the characters of GM and WM. The main peak's diffusivity in Fig.3D was wide, which conformed to the WM fibre structure. Many small peaks needed further consideration, which might indicate microstructures.
The above optimized acquisitions still need further verification. Some acquisition parameters are not allowed due to the MRI system's tolerance, which may lead to significant changes in the singular values of the kernel functions. Generally, our relaxation-diffusion distribution spectra have shown specificity in different brain tissues and multicomponent phantom. This technique offers the potential to measure the intra-voxel and inter-voxel correlations between the diffusivity and relaxation properties, which may be further applied for diagnosing neurological diseases.
Conclusion
In this study, GA was introduced to optimize the acquisition parameters in multidimensional MRI, and in vivo T1 relaxation-diffusion distribution spectra of the human brain and multicomponent phantom were obtained. Significant specificity was detected in these spectra, which may contribute to identifying microstructure at the sub-voxel resolution.Acknowledgements
This work was supported in part by the National Natural Science Foundation of China grants (61901465 and 81871350), the Beijing Natural Science Foundation (L182055), the Chinese National Major Scientific Equipment Research and Development Project grant (ZDYZ2010-2) and the Ministry of Science and Technology of China grant (2019YFA0707103), and the Strategic Priority Research Program of Chinese Academy of Sciences grant (XDB32010300).
References
1. Yang G, Tian Q, Leuze C, Wintermark M, Mcnab JA. Double diffusion encoding MRI for the clinic. Magnetic Resonance in Medicine [Internet] 2018;80:507–520. doi: 10.1002/mrm.27043.
2. Zong F, Ancelet LR, Hermans IF, Galvosas P. Determining mean fractional anisotropy using DDCOSY: preliminary results in biological tissues. Magnetic Resonance in Chemistry 2017;55:498–507. doi: 10.1002/mrc.4492.
3. English AE, Whittall KP, Joy MLG, Henkelman RM. Quantitative Two-Dimensional time Correlation Relaxometry. Magnetic Resonance in Medicine 1991;22:425–434. doi: 10.1002/mrm.1910220250.
4. Song Y-Q, Venkataramanan L, Hürlimann MD, Flaum M, Frulla P, Straley C. T1–T2 Correlation Spectra Obtained Using a Fast Two-Dimensional Laplace Inversion. Journal of Magnetic Resonance 2002;154:261–268. doi: 10.1006/jmre.2001.2474.
5. Song Y, Xiao L. Optimization of multidimensional MR data acquisition for relaxation and diffusion. NMR in Biomedicine 2020;33. doi: 10.1002/nbm.4238.
6. Wagner F, Laun FB, Kuder TA, et al.. Temperature and concentration calibration of aqueous polyvinylpyrrolidone (PVP) solutions for isotropic diffusion MRI phantoms. PLOS ONE [Internet] 2017;12:e0179276. doi: 10.1371/journal.pone.0179276.
Figures