3214
A combined deep learning and radiomics model predicts Ki-67 expression in HCC using MRI and multifrequency MR elastography1Human Phenome Institute,Fudan University, Shanghai, China, 2Department of Radiology, Ruijin Hospital, Shanghai Jiao Tong University School of Medicine, Shanghai, China, 3Department of Radiology, Charité–Universitätsmedizin Berlin, Berlin, Germany, 4Philips Healthcare, Shanghai, China, 5Institute of Science and Technology for Brain-inspired Intelligence, Fudan University, Shanghai, China
Synopsis
In this study, a combined deep learning and radiomics (DLR) approach using six different network architectures was tested and compared for the prediction of high Ki-67 expressions in patients with hepatocellular carcinoma (HCC). The model was based primarily on data from MRI and tomoelastography, a multifrequency MR elastography technique. Xception delivered the best performance and recognized seven prominent features among which four were obtained from tomoelastography. Our findings demonstrated that biomechanical properties, especially viscosity and the fluid behavior of the tumor, are crucial imaging features that are important for imaging-based cancer diagnostics.
Introduction
Hepatocellular carcinoma (HCC) is a highly heterogeneous malignancy with various biological behaviour1. Ki-67 indicates cell proliferation2,3 and has been widely used as a biomarker for tumor aggressiveness4.Joint prediction of Ki-67 level and tumor grade using MRI with multitask learning model (MTL) achieved higher performance than that of single-task-based predictive models5. Histogram-derived parameters of apparent diffusion coefficient (ADC) and arterial phase (AP) images were helpful for predicting Ki-67 labeling index (LI) of HCC6. A combined model including AP Rad-score and serum alpha-fetoprotein (AFP) using dynamic-contrast-enhancement (DCE) MRI can predict Ki-67 expression in HCC preoperatively7. However, in vivo biomechanical properties quantifiable by MR elastography (MRE)8 haven’t been considered in any of these models for predicting Ki-67. Tomoelastography9, a noise-robust multifrequency MRE technique, has demonstrated great potential for cancer detection and prediction of tumor aggressiveness10-12. Therefore, we propose a combined deep learning and radiomics (DLR) model that combines clinical parameters with routine MRI image features, and biomechanical properties from tomoelastography to predict the expression of Ki-67 in HCC.
Methods
Patient characteristicsA total of 109 histopathology confirmed HCC patients were enrolled in the study between September 2020 and January 2021. Histological evaluation was performed using tissue samples obtained from HCC resection. Immunohistochemistry was conducted for assessing Ki-67 expression. The specimens were evaluated by a pathologist with 15 years of experience who was blind to clinical and MR information. The patients were classified into low Ki-67 expression (Ki-67 LI < 20%) and high Ki-67 expression (Ki-67 LI≥20%). Clinical serum markers were also collected for all patients.
MRI and tomoelastography
Clinical routine MRI examinations were performed on either a 1.5-T or a 3.0-T MR system (Aera, Siemens; Ingenia, Philips Medical Systems; uMR 660, UIH) using the same imaging protocols consisted of anatomical T2w, diffusion weighted DWI (b value of 800 s/mm2) and DCE.
Tomoelastography was performed on a clinical 1.5 T unit (Magnetom Aera, Siemens, Erlangen, Germany). The three-dimensional wavefields were acquired with a single-shot, spin-echo echo-planar imaging sequence with motion-encoding gradients. Fifteen consecutive transverse slices with a FoV of 384×312 mm2 and 3×3×5 mm3 resolution were acquired during free breathing. Further imaging parameters: echo time (TE) of 5 ms; repetition time (TR) of 2050ms; parallel imaging with GRAPPA-factor 2; MEG amplitude of 30mT/m. Total MRE measurement time was approximately 3.5min. Tomoelastography data was processed with kMDEV inversion9, providing quantitative maps of shear wave speed (c in m/s, representing stiffness) and loss angle (φ in rad, relating to viscosity or tissue fluidity).
DLR Model
Convolutional neural network (CNN) models as well as radiomics analysis were conducted to extract features from DCE images, DWI, T2w images, c-map and φ-map. Six network architectures were compared, including Inception-Resnet, Inception, Resnet, VGG16, VGG19, and Xception. 14 clinical serum markers such as AFP, alanine aminotransferase (ALT), and aspartate transaminase (AST), were also included and tested in the DLR model. A support vector machine (SVM) model was employed for the classification of Ki-67 expression level with a cutoff of 20%. Least absolute shrinkage and selection operator (LASSO) and random forest was used to reduce the number of features from 1227 to 7. The detailed flowchart is shown Fig.1. For the evaluation of the predictive power of the models, receiver operator characteristic (ROC) analysis was conducted. The weight map of the feature was calculated by random forest.
Results
Figure 2 present selected MRI and tomoelastography images of patients with HCC lesion of (a) low (LI<20%) and (b) high (LI≥20%) Ki-67 expression. It appeared that HCC with high Ki-69 expression displayed higher c and φ values.Taking only MRI and serum data, among all six network architectures, Xception showed the best performance for predicting high Ki-67 expression with area under the ROC curve (AUC=0.82) and accuracy of 0.79. The predictive power of the other five networks in descending order were: Inception-Resnet (AUC=0.76), Resnet (AUC=0.74), Inception (AUC=0.67), VGG19 (AUC=0.68), and VGG16 (AUC=0.65). When incorporating c-map and φ-map obtained from tomoelastography into the networks, Xception remained the best among all networks and its predictive performance was increased with AUC of 0.87 and accuracy of 0.85. Based on feature screening of Xception, we observed that among all seven prominent features, four were related to the viscosity and fluidity parameter φ and one was related to stiffness parameter c. Results of the different networks and models were collected in Table 1. Seven features obtained from Xception with and without tomoelastography parameter maps were presented in Fig. 3.
Discussion and Conclusion
In this study, DLR model using six different network architectures were tested and compared for the prediction of high Ki-67 expressions in patients with HCC. Among all network architectures, Xception delivered best performance with realizing the independence of spatial convolution and channel convolution. Importantly, our data revealed that biomechanical properties, especially viscosity and the fluid behavior of the tumor, are crucial features for predicting cancer cell proliferation by the neural network. This finding, consistent with previous clinical studies10-12, provides further evidence for the importance of biomechanical properties in imaging-based cancer detection, diagnosis and classification.Acknowledgements
No acknowledgement found.References
1. Bidkhori G, Benfeitas R, Klevstig M, Zhang C, Nielsen J, Uhlen M, Boren J, Mardinoglu A. Metabolic network-based stratification of hepatocellular carcinoma reveals three distinct tumor subtypes. Proc Natl Acad Sci U S A. 2018 Dec 11;115(50):E11874-E11883. doi: 10.1073/pnas.1807305115. Epub 2018 Nov 27.
2. Miller I, Min M, Yang C, Tian C, Gookin S, Carter D, Spencer SL. Ki-67 is a Graded Rather than a Binary Marker of Proliferation versus Quiescence. Cell Rep. 2018 Jul 31;24(5):1105-1112.
3. Cheah PL, Looi LM, Nazarina AR, Mun KS, Goh KL. Association of Ki-67 with raised transaminases in hepatocellular carcinoma. Malays J Pathol. 2008 Dec;30(2):103-7.
4. Spratt DE. Ki-67 Remains Solely a Prognostic Biomarker in Localized Prostate Cancer. Int J Radiat Oncol Biol Phys. 2018 Jul 1;101(3):513-515. doi: 10.1016/j.ijrobp.2018.03.008.
5. Fan M, Yuan W, Zhao W, Xu M, Wang S, Gao X, Li L. Joint Prediction of Breast Cancer Histological Grade and Ki-67 Expression Level Based on DCE-MRI and DWI Radiomics. IEEE J Biomed Health Inform. 2020 Jun;24(6):1632-1642. doi: 10.1109/JBHI.2019.2956351. Epub 2019 Nov 28.
6. Hu XX, Yang ZX, Liang HY, Ding Y, Grimm R, Fu CX, Liu H, Yan X, Ji Y, Zeng MS, Rao SX. Whole-tumor MRI histogram analyses of hepatocellular carcinoma: Correlations with Ki-67 labeling index. J Magn Reson Imaging. 2017 Aug;46(2):383-392. doi: 10.1002/jmri.25555. Epub 2016 Nov 10.
7. Fan Y, Yu Y, Wang X, Hu M, Hu C. Radiomic analysis of Gd-EOB-DTPA-enhanced MRI predicts Ki-67 expression in hepatocellular carcinoma. BMC Med Imaging. 2021 Jun 15;21(1):100.
8. Reiter R, Wetzel M, Hamesch K, Strnad P, Asbach P, Haas M, Siegmund B, Trautwein C, Hamm B, Klatt D, Braun J, Sack I, Tzschätzsch H. Comparison of non-invasive assessment of liver fibrosis in patients with alpha1-antitrypsin deficiency using magnetic resonance elastography (MRE), acoustic radiation force impulse (ARFI) Quantification, and 2D-shear wave elastography (2D-SWE). PLoS One. 2018 Apr 26;13(4):e0196486.
9. Tzschatzsch H, Guo J, Dittmann F, et al. Tomoelastography by multifrequency wave number recovery from time-harmonic propagating shear waves. Med Image Anal. 2016;30:1-10.
10. Li M, Guo J, Hu P, et al. Tomoelastography Based on Multifrequency MR Elastography for Prostate Cancer Detection: Comparison with Multiparametric MRI. Radiology. 2021:201852.
11. Marticorena Garcia SR, Zhu L, Gultekin E, et al. Tomoelastography for Measurement of Tumor Volume Related to Tissue Stiffness in Pancreatic Ductal Adenocarcinomas. Invest Radiol. 2020.
12. Shahryari M, Tzschatzsch H, Guo J, et al. Tomoelastography Distinguishes Noninvasively between Benign and Malignant Liver Lesions. Cancer Res. 2019.
Figures
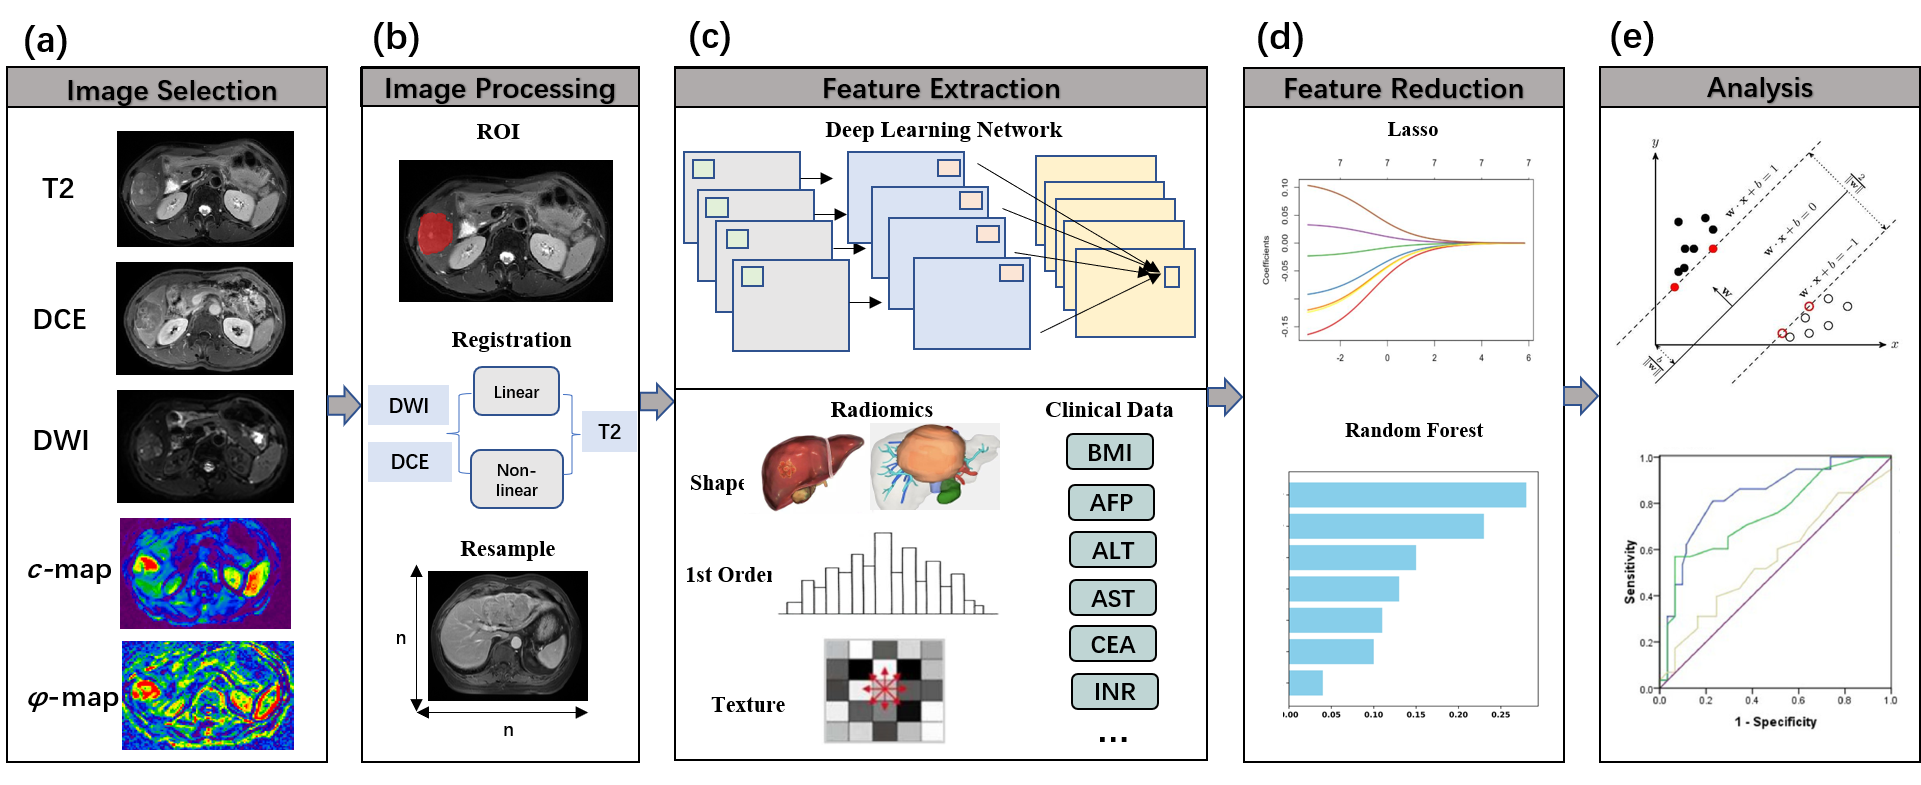
Figure 1. Flowchart of the DLR model used in our study, including (a) image selection, (b) image preprocessing, (c) feature extraction, (d) feature screening and (e) analysis.
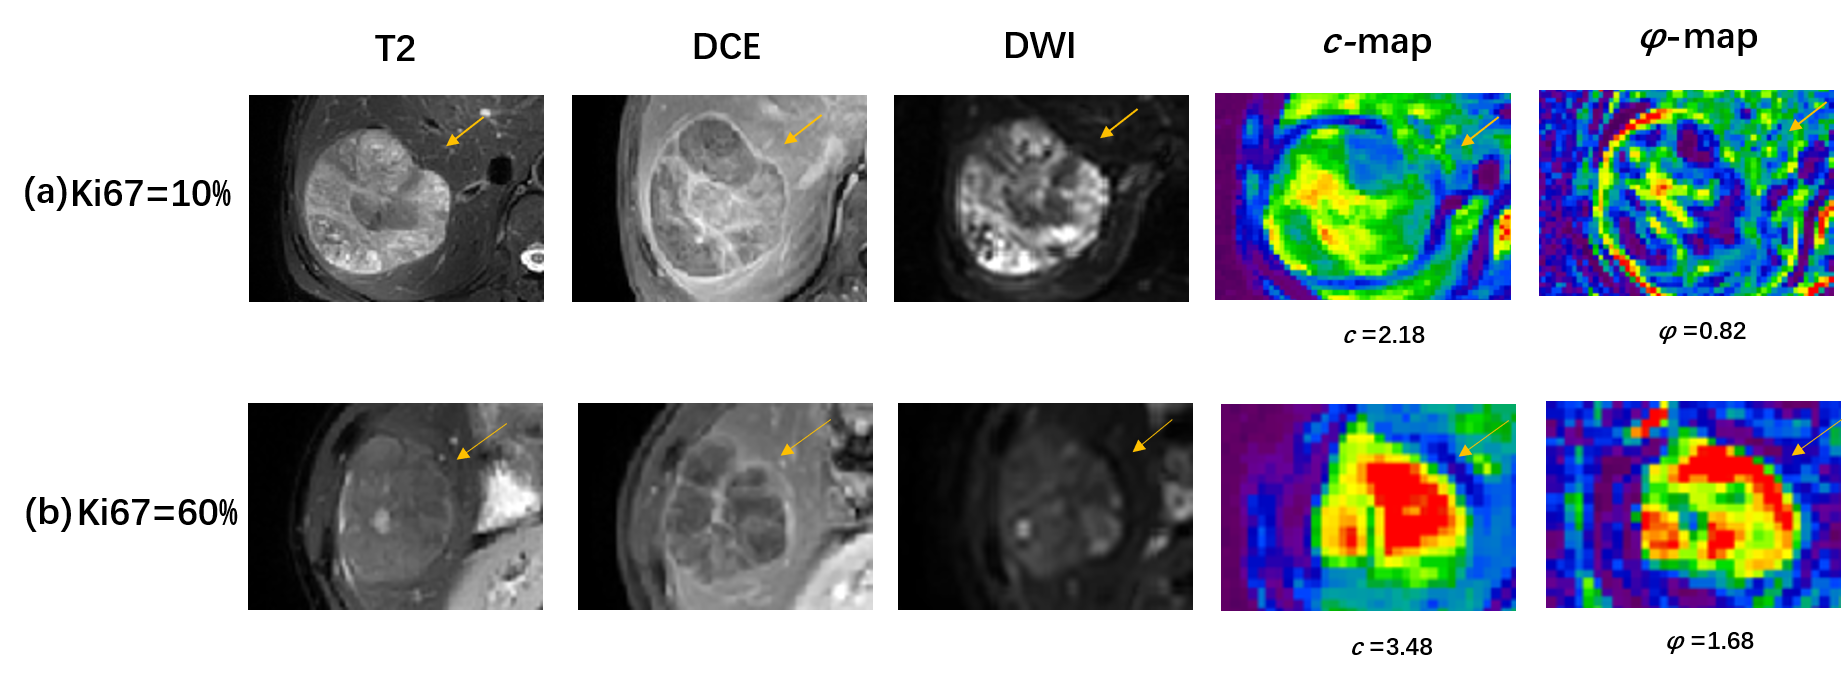
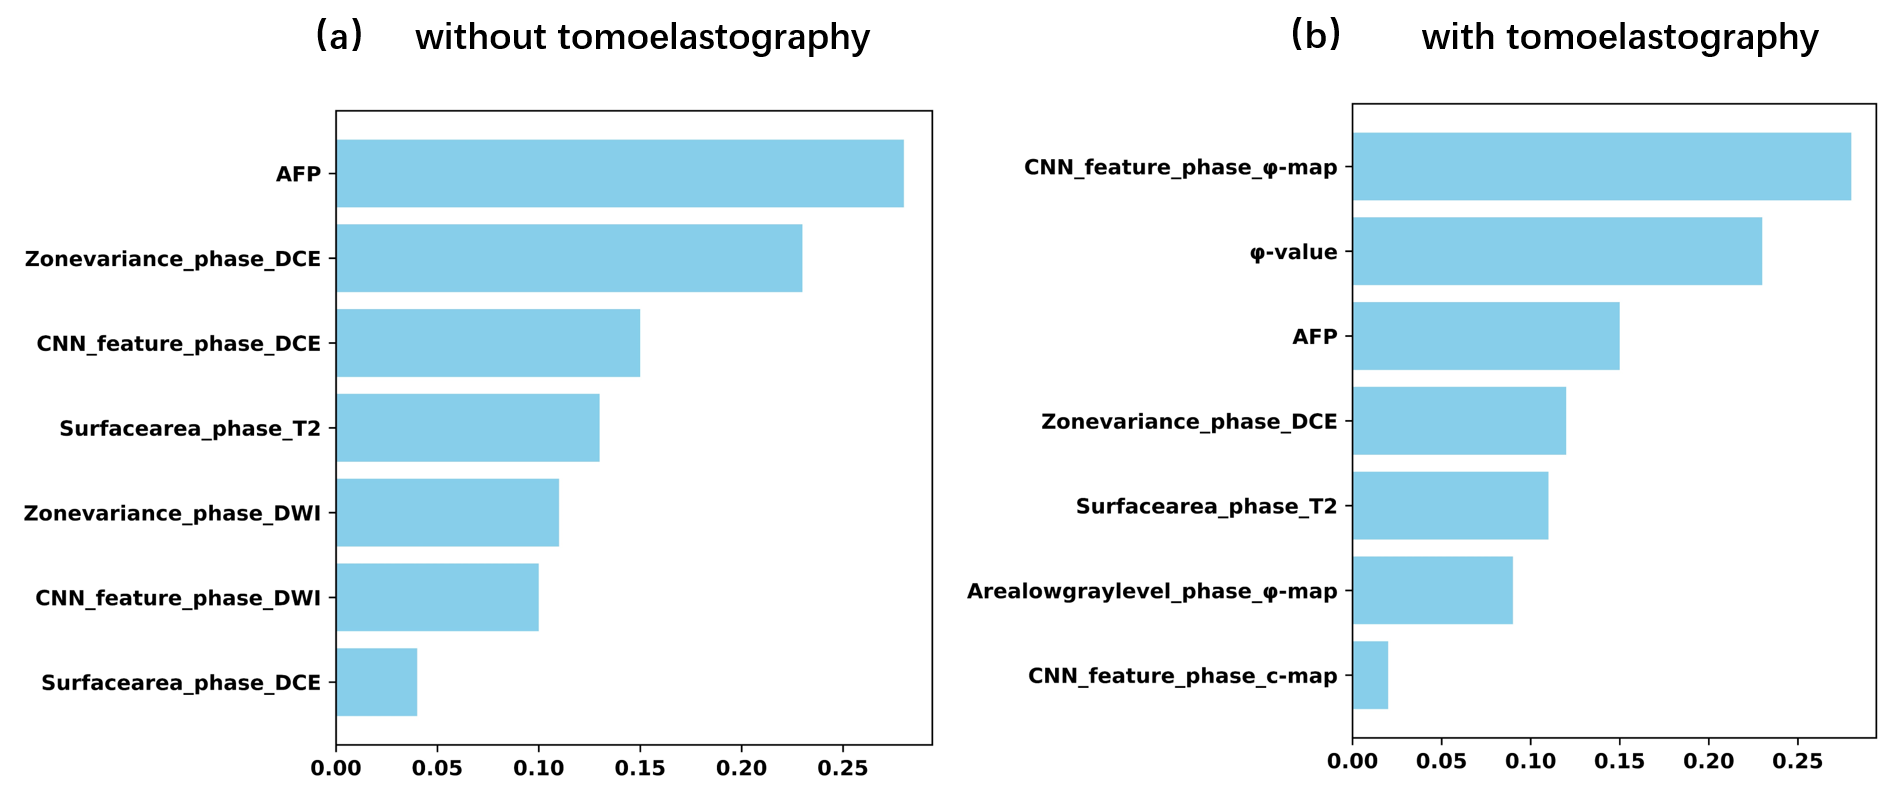
Figure 3. The rankings of seven preeminent features obtained using Xception, (a) without and (b) with considering tomoelastography parameter maps of c and φ.

Table 1. Performance of DLR models using different network architecture with and without considering tomoelastography parameter maps of c and φ for the prediction of high Ki-67 expression.