3213
Frequency-dependent Correlation between Mechanical and Structural Properties of the Human Brain1School of Biomedical Engineering, Shanghai Jiao Tong University, Shanghai, China
Synopsis
The relationship between mechanical properties and microscopic structures of brain is of interest to both neuroscience and clinical communities. Using magnetic resonance elastography (MRE), we proposed and verified an empirical model to establish a linear correlation between shifted apparent diffusion coefficient (sADC) and shear modulus. A total of 43 healthy volunteers were included for MRE and diffusion weighted imaging (DWI) scanning. Results demonstrated that, in the parietal lobe, a strong correlation exists between shear modulus and sADC.
INTRODUCTION
It is known mechanical properties of brain tissues are important to understand its disease and development1. Ex vivo studies have also shown a strong bond between mechanical and structural properties of brain tissues2, 3. Using magnetic resonance elastography (MRE)4 and diffusion weighted imaging (DWI)5, mechanical and structural properties of soft tissues could be measured in vivo6. However, the potential relationship between mechanical and structural properties of brain is yet to be explored.In this study, we used DWI and MRE to characterize the potential correlation between structural and biomechanical properties of brain. Apparent diffusion coefficient (ADC) and shifted ADC (sADC) values were estimated. The correlations between sADC and shear modulus were analyzed for each of the specific brain region at 3 different actuation frequencies. A phenomenological model based on sADC and the shear modulus was proposed.
METHODS
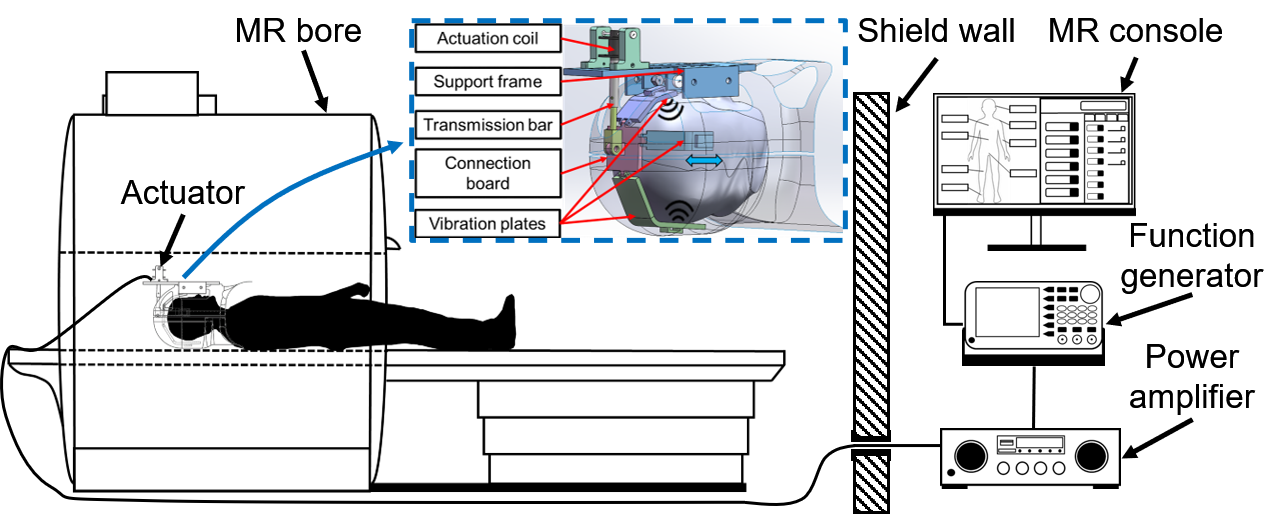
A total of 43 healthy volunteers were recruited in this study. Among all the subjects, data from the 32 subjects were used for modeling and the rest 11 subject data were used for validation. MRE imaging was performed using a custom-built electromagnetic actuator7 (Figure 1). The measurement was carried out using 4 actuation frequencies. Among them, data from 20, 40, 60 Hz were used for correlation analysis. Data from 30 Hz were used for validation. Wave images of the brain were acquired using an echo planar imaging (EPI) based MRE sequence with three motion encoding directions. Shear modulus maps were calculated by using a three-dimensional local frequency estimation (LFE) method. For DWI, images were acquired with diffusion encoding along three axes. Among the 16 key b-values between 0 and 2500 s/mm2 acquired, we selected 2 optimized key b-values to calculate sADC as the following equation, so that Gaussian and non-Gaussian diffusion effect was included.$$sADC=ln(S_{lb}/S_{hb})/(hb-lb)$$
where $$$S_{lb}$$$ and $$$S_{hb}$$$ are intensities of the signals acquired at the low and high key b-value, $$$lb$$$ and $$$hb$$$, respectively. Both MRE and DWI scanning were performed on a 3T MR imager (uMR 790, United Imaging Healthcare, Shanghai, China).
All MRE and DWI images were registered to a common reference (MNI152 T1-weighted 2 mm brain atlas) by using Advanced Normalization Tools (ANTS) for segmentation and correlation analysis. The whole brain was segmented into frontal, occipital, parietal, and temporal lobe using the MNI template mask within the FMRIB Software Library (FSL).
Correlations between shear modulus and sADC results were evaluated using Pearson correlation coefficient. The linear correlation coefficient was quantified voxel by voxel at each frequency. All p values were corrected by the false discovery rate (FDR) method. A linear regression between the mean value of shear modulus and sADC were performed in each lobe. We proposed the following equation for the frequency-dependent shear modulus, $$$μ_{f}$$$, at each vibration frequency, $$$f$$$, in terms of :
$$μ_{f}=(α_{1}f^{β_{1}}+γ_{1})\cdot sADC+(α_{2}f^{β_{2}}+γ_{2})$$
where $$$α_{i}$$$, $$$β_{i}$$$, and $$$γ_{i}$$$ are the model parameters to be determined by fitting.
RESULTS and DISCUSSION
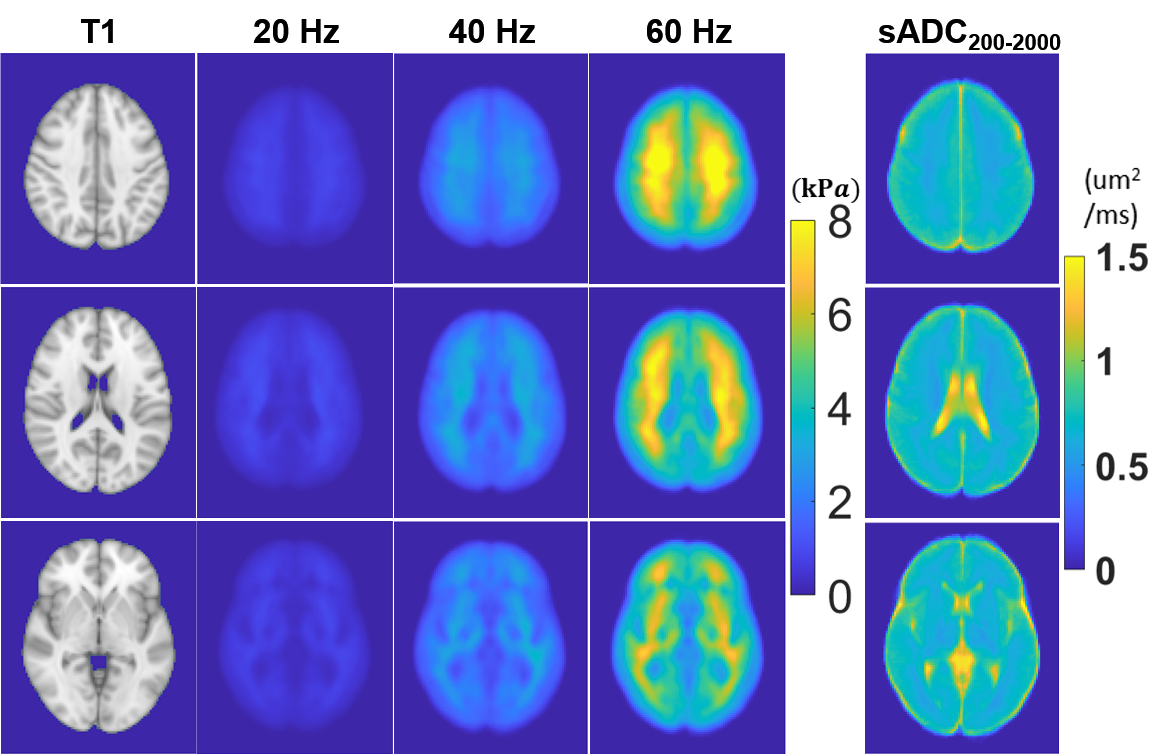
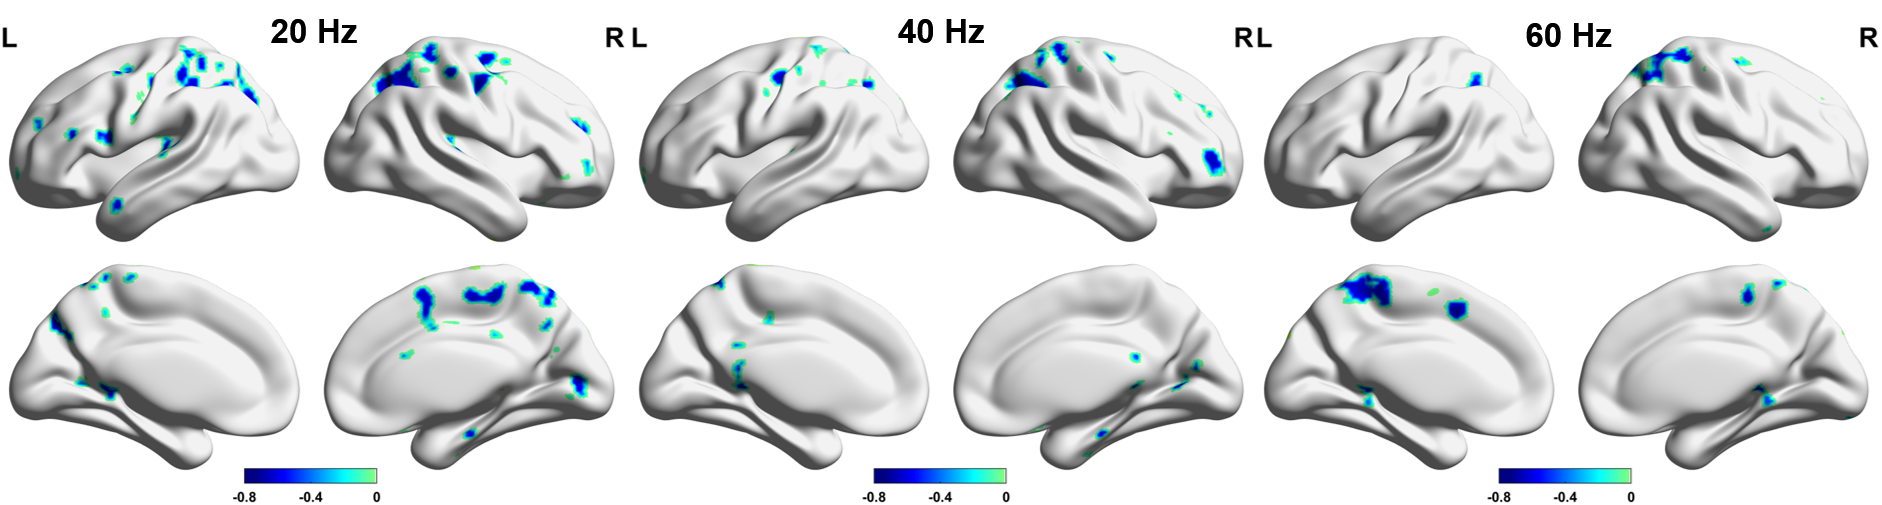
Based on the highest correlation between the shear modulus and sADC at each frequency, we determined the 2 key b-vlaues as 200 s/mm2 and 2000 s/mm2. T1-weighted images, average shear modulus, and average sADC values over the 32 subjects are shown in Figure 2. We observed the anatomical features of the brain such as white matter and ventricle regions could be identified base on the modulus and sADC maps.Voxel correlation results along 3 equally spaced frequencies are shown in Figure 3. The voxels with significant correlation had been shown illustrated. For all 3 actuation frequencies, large amount of contiguous significant voxels were observed only in parietal lobe.
The results from linear regression study confirmed the specificity of parietal lobe found in voxel correlation maps in Figure 3. Significant linear correlation was observed for all 3 frequencies in parietal lobe. However, significant correlations were observed for frontal and occipital lobes at 20 and 40 Hz. As for the temporal lobe, there was no significant correlation at any of the measured frequency.
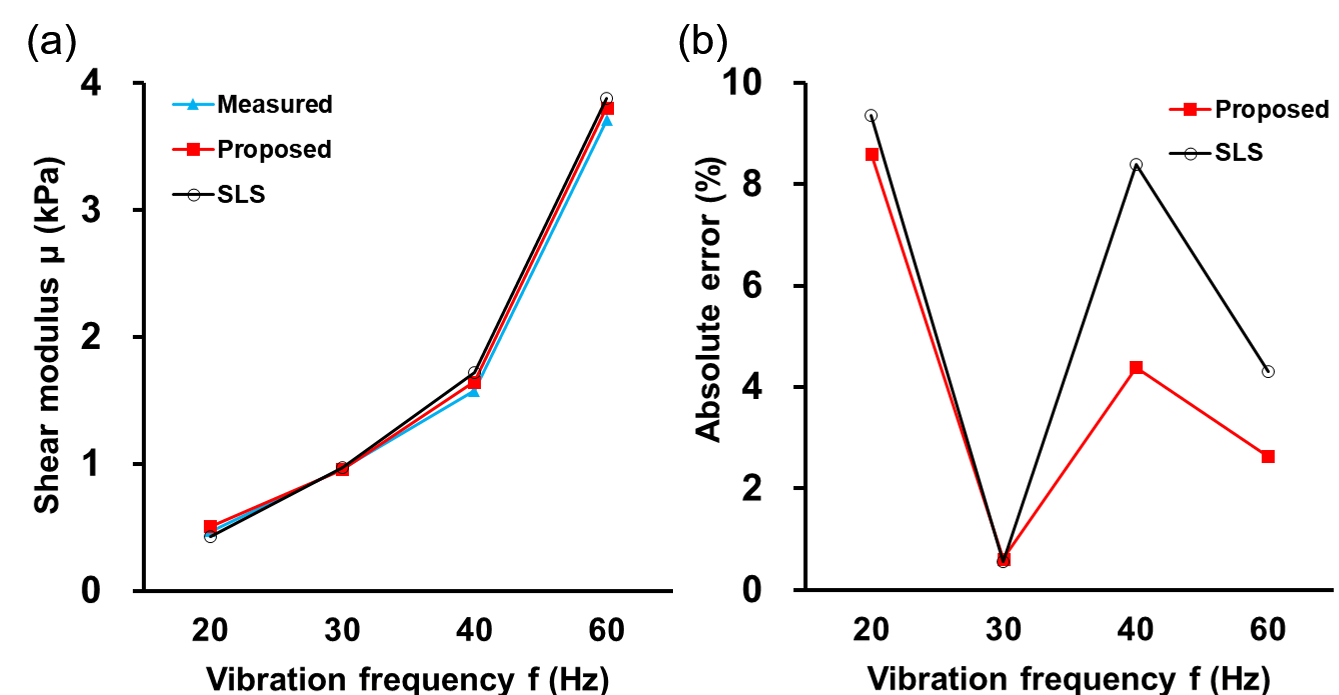
The predicted mean values from the proposed model and the standard linear solid (SLS) model of the 11 validation subjects are shown in Figure 5(a). For absolute error comparing with the measured results, the proposed model outperforms SLS model at 20, 40 and 60 Hz (Figure 5b). Especially for 40 Hz and 60 Hz, around 50% error decrease could be achieved by using the proposed model. These indicated the proposed model had better performance at high frequencies.
CONCLUSION
In this study, we proposed a phenomenological model for parietal lobe to describe the shear modulus by sADC at multiple frequencies. The validation results highlighted the utility of the empirical model compared with the classic spring-dashpot models. These results also demonstrated a strong correlation between mechanical properties and structural properties in parietal lobe.Acknowledgements
Funding support from grant 31870941 from National Natural Science Foundation of China (NSFC) and grant 19441907700 from Shanghai Science and Technology Committee (STCSM) are acknowledged.References
1. Hiscox LV, Johnson CL, Barnhill E, et al. Magnetic resonance elastography (MRE) of the human brain: technique, findings and clinical applications. Phys Med Biol. Dec 21 2016;61(24):R401-R437. doi:10.1088/0031-9155/61/24/R401
2. Feng Y, Okamoto RJ, Namani R, Genin GM, Bayly PV. Measurements of mechanical anisotropy in brain tissue and implications for transversely isotropic material models of white matter. J Mech Behav Biomed Mater. Jul 2013;23:117-32. doi:10.1016/j.jmbbm.2013.04.007
3. Feng Y, Lee CH, Sun L, Ji S, Zhao X. Characterizing white matter tissue in large strain via asymmetric indentation and inverse finite element modeling. J Mech Behav Biomed Mater. Jan 2017;65:490-501. doi:10.1016/j.jmbbm.2016.09.020
4. Murphy MC, Huston J, 3rd, Ehman RL. MR elastography of the brain and its application in neurological diseases. Neuroimage. Feb 15 2019;187:176-183. doi:10.1016/j.neuroimage.2017.10.008
5. Baliyan V, Das CJ, Sharma R, Gupta AK. Diffusion weighted imaging: Technique and applications. World J Radiol. Sep 28 2016;8(9):785-798. doi:10.4329/wjr.v8.i9.785
6. Le Bihan D, Ichikawa S, Motosugi U. Diffusion and Intravoxel Incoherent Motion MR Imaging-based Virtual Elastography: A Hypothesis-generating Study in the Liver. Radiology. Nov 2017;285(2):609-619. doi:10.1148/radiol.2017170025
7. Qiu S, He Z, Wang R, et al. An electromagnetic actuator for brain magnetic resonance elastography with high frequency accuracy. NMR Biomed. Jul 21 2021:e4592. doi:10.1002/nbm.4592
Figures