3211
A traveling-wave expansion based subspace search (TWESS) for shear modulus estimation using magnetic resonance elastography1School of Biomedical Engineering, Shanghai Jiao Tong University, Shanghai, China
Synopsis
We proposed a traveling-wave expansion based subspace search (TWESS) algorithm for modulus estimation of MRE. Based on a traveling wave decomposition model, we explore the orthogonal characteristics of the signal subspace and the noise subspace. Eigenvalue decomposition of the covariance matrix of the wave data were used to search the wavenumber and retrieve the local modulus. Results showed the proposed method could provide better delineation of the inclusion boundaries, even when signal-to-noise ratio of the image was low.
Introduction
Many algorithms have been proposed to estimate the shear modulus of soft tissues based on wave images acquired from magnetic resonance elastography (MRE)1. Based on wave equation, Direct Inversion (DI) is widely adopted by using the numerical Laplace operator. However, DI is not good at distinguishing tissue boundaries, especially when the signal-to-noise ratio of the wave image is low. Multifrequency dual elastovisco inversion (MDEV)2 could provide modulus estimates with good anatomical features, but needs multi-frequency data. Baghani first used traveling-wave expansion (TWE)3 for modulus estimation, but spatial resolution was compromised for indeterminacy of the problem. Therefore, based on the TWE model, we adopted a subspace search to improve the resolution and to reduce the fitting windows size requirements. Simulation and real data were used for verifications.Methods
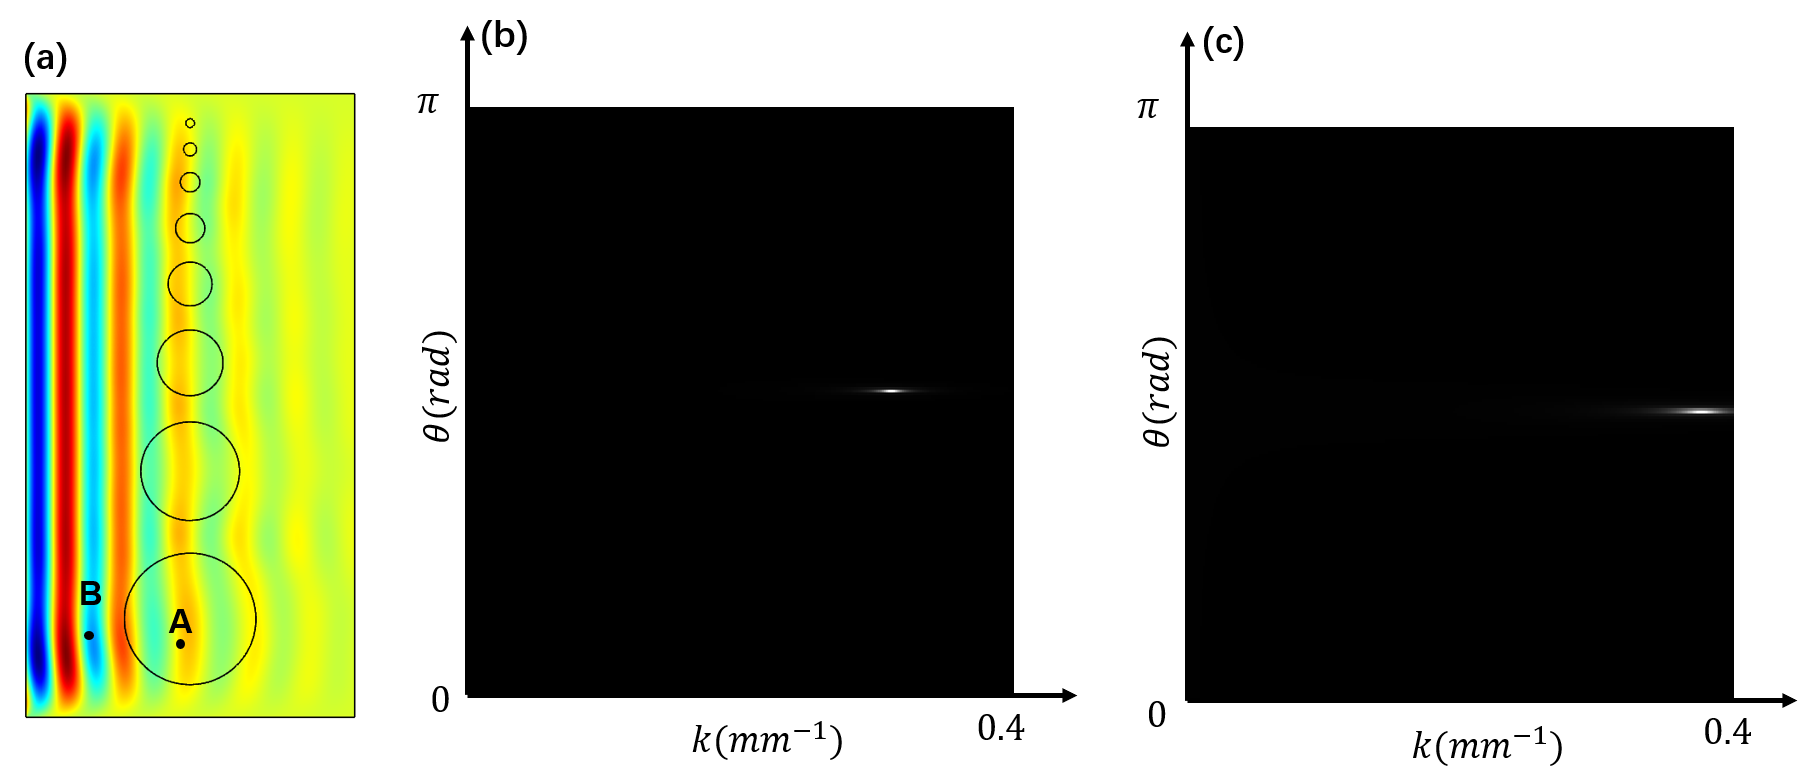
For harmonic excitation, we set the shear motion coding in the z-axis. Under the assumption of local homogeneity and isotropy, the general solution of the wave equation at position $$$\textbf{x}_n$$$ can be written as a combination of $$$M$$$ traveling waves with different directions but the same wavenumber $$$k$$$.$$u_z(\textbf{x}_n)=\sum_{m=1}^{M}s_me^{jk\textbf{d}_m\cdot \textbf{x}_n}+\epsilon_n $$
Where, $$$\textbf{d}_m$$$ denotes unit direction vector with direction angle $$$\theta_m$$$, $$$s_m$$$ denotes the complex amplitude in this direction, $$$\epsilon$$$ represents sampling noise that can be treated as independently distributed Gaussian noise. The local $$$N$$$ points share the same wavenumber $$$k$$$ and the same set of complex amplitudes $$$s_m$$$. $$$\textbf{U}_z \in \mathbb{C}^{N\times 1}$$$ is the sample complex wave data of the local patch, $$$\textbf{A} \in \mathbb{C}^{N\times M}$$$ is the manifold matrix, where $$$\textbf{A}=\begin{bmatrix} \textbf{a}_1(k) & \dots & \textbf{a}_M(k) \end{bmatrix}$$$ and $$$\textbf{a}_m(k)=\begin{bmatrix} e^{jk\textbf{d}_m\cdot \textbf{x}_1}& \dots & e^{jk\textbf{d}_m\cdot \textbf{x}_N}\end{bmatrix}^T$$$. $$$ \textbf{S}=\begin{bmatrix} s_1& \dots & s_M\end{bmatrix}^T $$$ denotes complex amplitudes and $$$\textbf{B}=\begin{bmatrix} \epsilon _1& \dots & \epsilon _N\end{bmatrix}^T$$$ denotes complex sample noise. The wave data of the local patch can be expressed as a matrix form:
$$\textbf{U}_z=\textbf{A}(k)\textbf{S}+\textbf{B} $$
A subspace search was used to estimate the wavenumber $$$k$$$ 4. The covariance matrix $$$\textbf{R}$$$ of $$$\textbf{U}_z$$$ was decomposed by eigenvalue decomposition. The large $$$D$$$ eigenvalues correspond to the $$$D$$$ non-zero components in $$$\textbf{S}$$$, the eigenvectors corresponding to these eigenvalues form the signal subspace $$$\textbf{U}_\textbf{S}$$$, and the other $$$N-D$$$ construct the noise subspace $$$\textbf{U}_\sigma $$$.
$$\textbf{R}=\textbf{E}\left(\textbf{U}\textbf{U}^H\right)=\textbf{AS}\textbf{S}^H\textbf{A}^H+\textbf{B}\textbf{B}^H=\textbf{A}\textbf{R}_\textbf{s}\textbf{A}^H+\sigma^2\textbf{I}=\textbf{U}_\textbf{S}\Sigma_\textbf{S}\textbf{U}_\textbf{S}^H+\textbf{U}_\sigma\Sigma _\sigma\textbf{U}_\sigma^H$$
Where, $$$\textbf{R}_\textbf{s}=\textbf{S}\textbf{S}^H$$$ denotes the covariance matrix of $$$\textbf{S}$$$ and $$$\sigma^2\textbf{I}$$$ denotes the noise covariance matrix with the variance of $$$\sigma^2$$$. The $$$N$$$ eigenvalues are $$$\lambda_1\ge \lambda _2\ge \dots\ge \lambda _{D-1}\ge\lambda _D\ge\sigma^2=\lambda_{D+1}=\lambda_{D+2}=\dots=\lambda _{N-1}=\lambda _{N}$$$, so $$$\Sigma_{\textbf{S}}$$$ denotes $$$diag(\lambda _1,\dots,\lambda _D)$$$ and $$$\Sigma_{\sigma}$$$ denotes $$$diag(\lambda _{D+1},\dots,\lambda _N)$$$.
The column $$$\textbf{a}_m(k)$$$ of the manifold matrix corresponding to the non-zero element in $$$S$$$ is orthogonal to the noise subspace $$$\textbf{U}_\sigma$$$. So,
$$\textbf{a}^H_m(k)\textbf{U}_\sigma=0$$
Therefore, the wavenumber $$$k$$$ can be estimated by performing a two-dimensional search for each patch and the corresponding shear modulus $$$G$$$ can also be obtained.
$$\min_{m,k} \textbf{a}^H_m(k)\textbf{U}_\sigma \textbf{U}^H_\sigma \textbf{a}_m(k)$$
$$G=\rho c^2=\rho(\frac{2\pi f}{k} )^2$$
Results
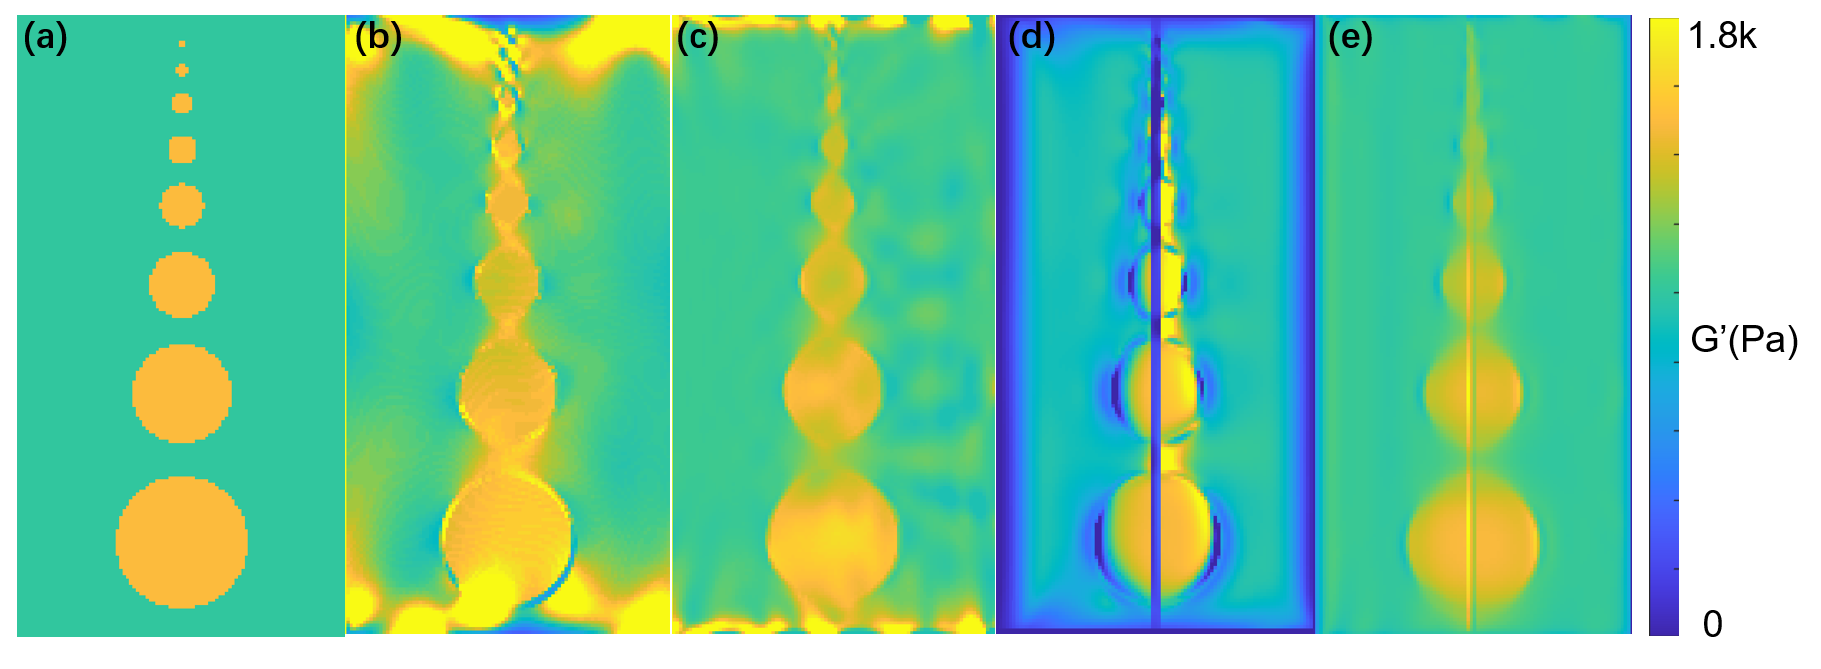
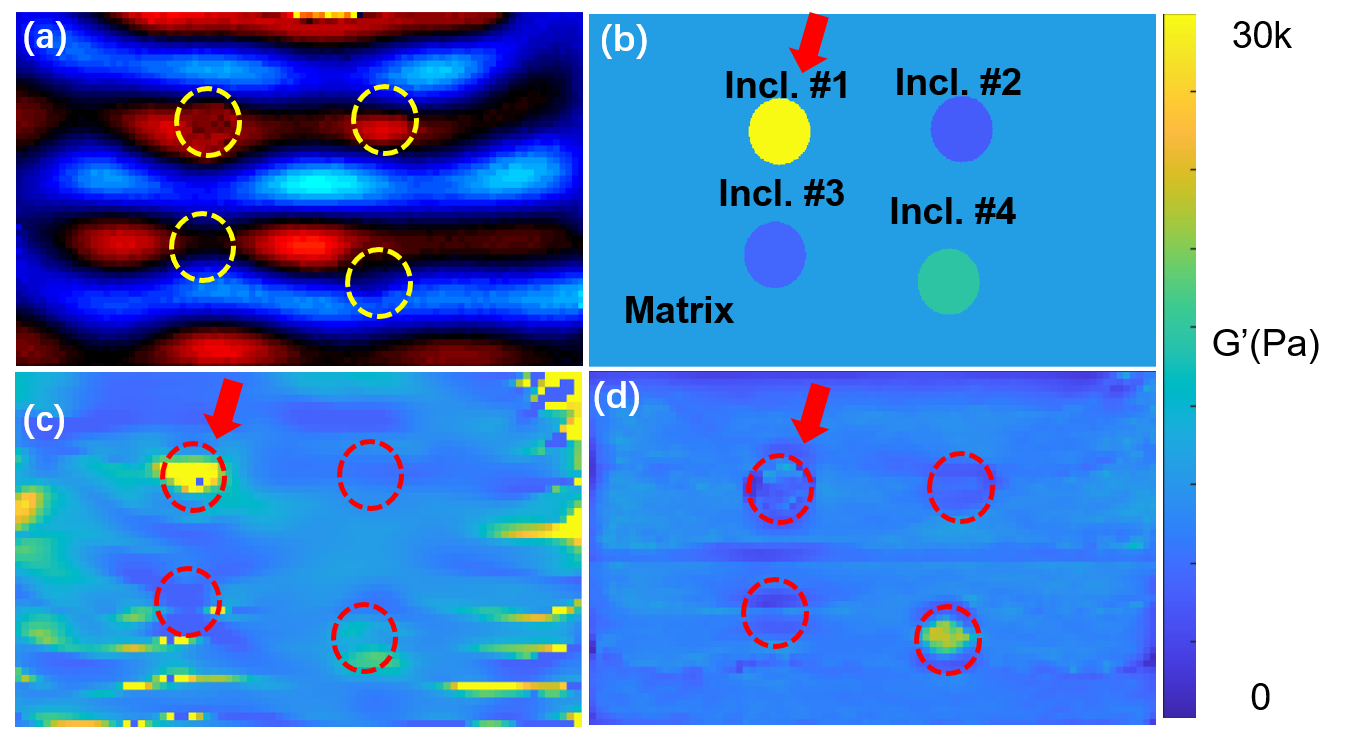
To test the spatial resolution of the proposed algorithm, a phantom (100X190mm2) with 8 spherical inclusions was constructed using COMSOL with a resolution of 1mm (Figure 1a). Each inclusion had a shear modulus of 1.5 kPa with radii ranged from 1.6 to 16 mm. The phantom background had a modulus of 1 kPa. The shear waves were transmitted from the left side (Figure 1a). We observed that the proposed method generated modulus maps with better boundaries under both 20Hz (Figure 2b,d) and 60Hz (Figure 2c,e), especially for small inclusions.A public data set from the ISMRM MRE study group5 were adopted for the evaluation of performance of the low signal-to-noise ratio region. Inclusion #1 has a higher modulus and longer wavelength, and the signal-to-noise ratio is much lower than that in other regions (Figure 3a). We use one slice data under 100Hz for 2D modulus estimation, the true shear modulus, the mean modulus estimated by TWESS, and DI at inclusion #1 are 43 kPa, 36 kPa, 7 kPa, respectively (Figure 3a, b, c). We can see that the estimated modulus of DI for inclusion #1 is much lower than the real value, while that of the proposed method is closer to the real value.
Discussion
We proposed TWESS to estimate the local wavenumber from wave images. Without Laplace operator, TWESS can resolve wave reflection and noise problems better. Therefore, TWESS has potential in scenes that require high spatial resolution, such as tumor evaluation6, and scenes with high anti-noise performance of inversion algorithms such as lung MRE7.Conclusions
We proposed a traveling-wave expansion based subspace search algorithm for modulus estimation. Evaluation based on the simulation and phantom data test demonstrated the potential of the TWESS to solve the two problems of MRE modulus estimation: spatial resolution and robustness to noise.Acknowledgements
Funding support from grant 31870941 from National Natural Science Foundation of China (NSFC) and grant 19441907700 from Science and Technology Commission of Shanghai Municipality (STCSM) are acknowledged.References
1. Fovargue D, Nordsletten D, Sinkus R. Stiffness reconstruction methods for MR elastography. Nmr in Biomedicine. Oct 2018;31(10)e3935. doi:10.1002/nbm.3935
2. Hirsch S, Guo J, Reiter R, et al. MR Elastography of the Liver and the Spleen Using a Piezoelectric Driver, Single-Shot Wave-Field Acquisition, and Multifrequency Dual Parameter Reconstruction. Magnetic Resonance in Medicine. Jan 2014;71(1):267-277. doi:10.1002/mrm.24674
3. Baghani A, Salcudean S, Honarvar M, Sahebjavaher RS, Rohling R, Sinkus R. Travelling Wave Expansion: A Model Fitting Approach to the Inverse Problem of Elasticity Reconstruction. Ieee Transactions on Medical Imaging. Aug 2011;30(8):1555-1565. doi:10.1109/tmi.2011.2131674
4. Schmidt R. Multiple emitter location and signal parameter estimation. TAP. 1986;34(3):276-280. doi:10.1109/TAP.1986.1143830
5. Papazoglou S, Hirsch S, Braun J, Sack I. Multifrequency inversion in magnetic resonance elastography. Physics in Medicine and Biology. Apr 21 2012;57(8):2329-2346. doi:10.1088/0031-9155/57/8/2329
6. Mariappan YK, Glaser KJ, Levin DL, et al. Estimation of the Absolute Shear Stiffness of Human Lung Parenchyma Using H-1 Spin Echo, Echo Planar MR Elastography. Journal of Magnetic Resonance Imaging. Nov 2014;40(5):1230-1237. doi:10.1002/jmri.24479
7. Pepin KM, Chen J, Glaser KJ, et al. MR Elastography Derived Shear Stiffness-A New Imaging Biomarker for the Assessment of Early Tumor Response to Chemotherapy. Magnetic Resonance in Medicine. May 2014;71(5):1834-1840. doi:10.1002/mrm.24825
Figures