3208
T1 mapping for liver with EOB enhanced MRI: comparison of look-locker inversion recovery and B1 inhomogeneity-corrected method1The First Affiliated Hospital of Guangxi Medical University, Nanning, China, 2MR Scientific Marketing, Siemens Healthineers, Wuhan, China, 3MR Application Predevelopment, Siemens Healthcare GmbH, Erlangen, Germany
Synopsis
Two different T1 mapping sequences, based on the inversion recovery SNAPSHOT-FLASH sequence (LLIR-T1) and on B1 inhomogeneity-corrected variable flip angle (VFA-T1) acquisitions, were compared in a clinical setting. Results showed that the LLIR-T1 method had better image quality, and higher contrast between tumor and healthy liver tissue.c had a strong correlation with VFA-T1 method whether at different time point or regions. But LLIR-T1 had lower T1 in healthy liver lobe and higher T1 in tumor compared with VFA-T1.
Introduction
T1 relaxometry obtained from B1 inhomogeneity-corrected variable flip angle (VFA) sequence has been suggested as a reliable method to assess liver function with the uptake characteristics of Gd-EOB-DTPA1,2. The VFA method acquires spoiled gradient echo sequences with different flip angles and then determines the T1 values from the signal model of the steady-state3. As the signal model is sensitive to the actual value of the flip angle in a given voxel, a B1 correction needs to be performed to reduce B1 inhomogeneity effects. In this study, we assessed the feasibility of a new T1 mapping method based on a prototypical inversion recovery SNAPSHOT-FLASH sequence with respective reconstruction. The employed prototype performs a pixelwise processing as outlined in the study by Deichmann et al4. We compared it with the B1 inhomogeneity-corrected VFA T1 mapping method in liver for Gd-EOB-DTPA-enhanced MRI.Methods
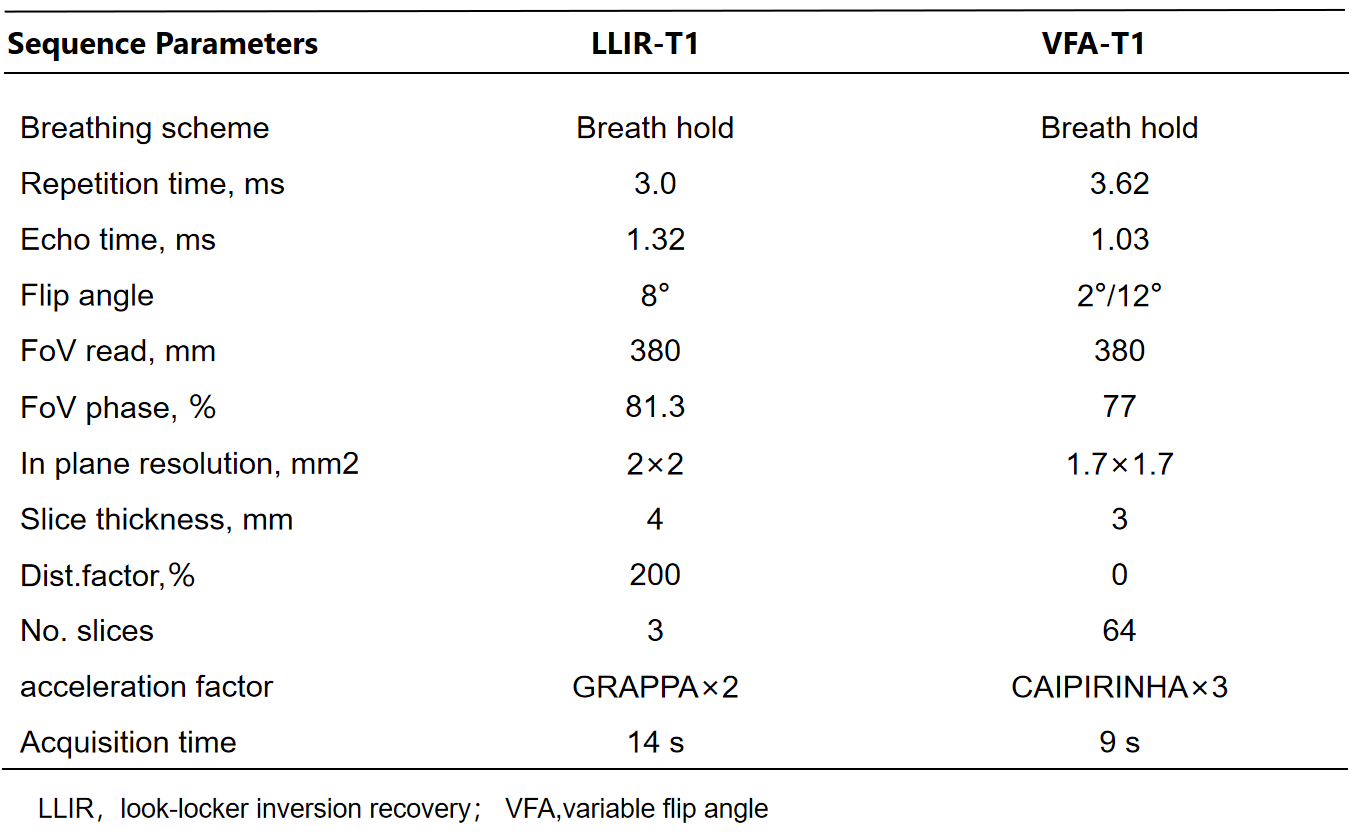
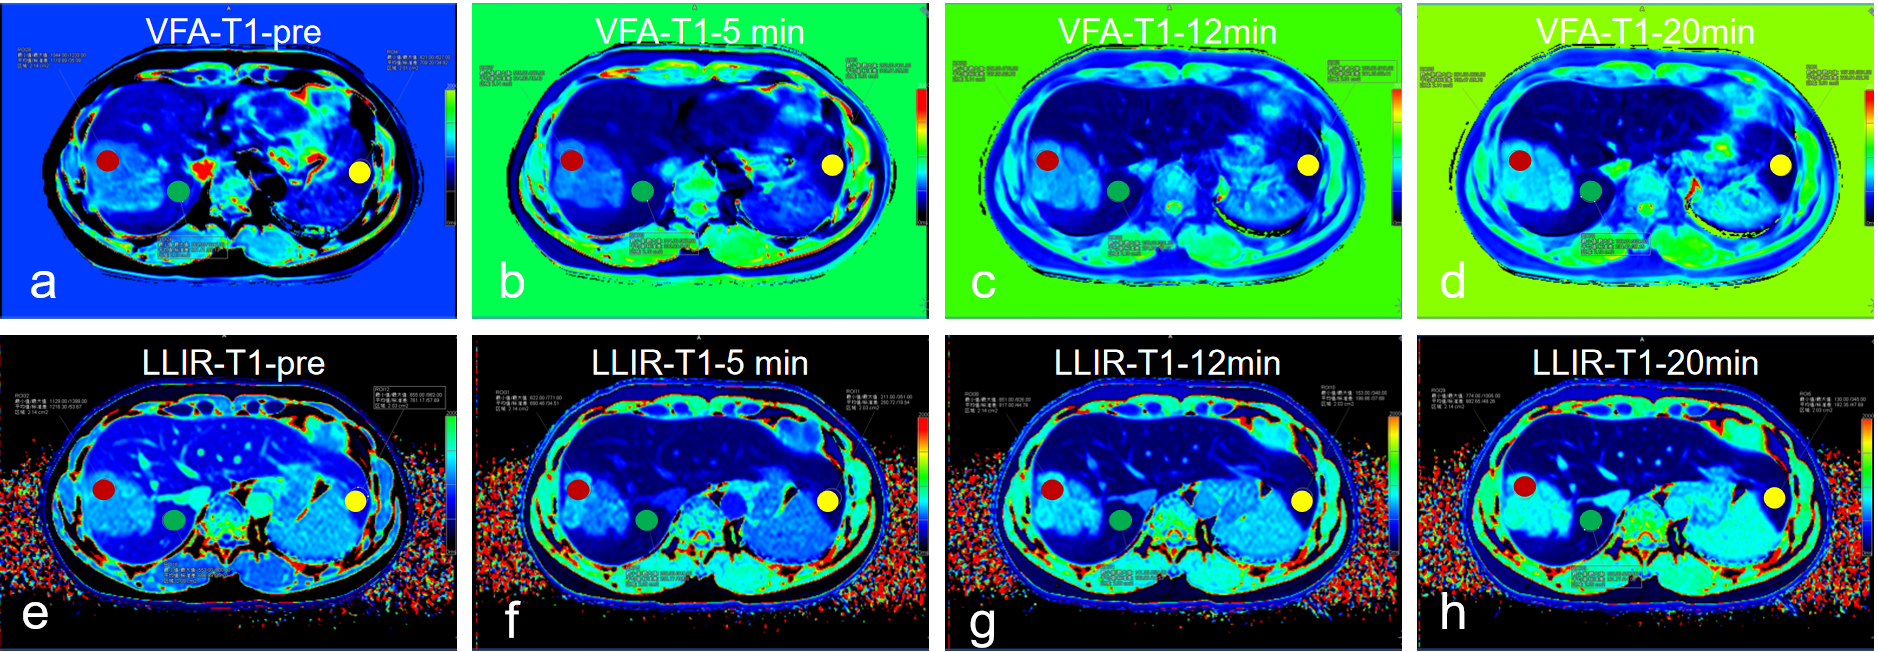
This prospective study included 25 patients (17male, 8 female, age 53 +/- 12 years) with hepatocellular carcinoma (HCC), who underwent magnetic resonance imaging (MRI) before surgery on a 3T MRI system (MAGNETOM Prisma, Siemens Healthcare, Erlangen, Germany). In addition to routine imaging sequences, T1 maps using LLIR and B1 inhomogeneity-corrected VFA methods were obtained four times at the precontrast phase and at 5-min, 12-min and 20-min after the injection of 0.025 mmol of Gd-EOB-DTPA (Bayer Healthcare) per kg of body weight at a rate of 2.0 ml/s. For LLIR-T1 map three axial slices were obtained with the tumor in the center. The imaging parameters are listed in Table 1. Three similar-sized elliptical regions of interest (ROI, area range: 1.7-2.0mm2) were drawn at left lobe, right lobe and tumor of precontrast LLIR-T1 map by a gastrointestinal radiologist with 10 years of clinical experience who was blinded to the clinical results, carefully avoiding major branches of the vessels . The ROIs were then copied to the same anatomical location of both other T1 maps (Figure 1). The mean values of the measured T1 in each ROI at corresponding time-points (T1-pre, T1-5 min, T1-12 min, T1-20min) and regions (T1-Left, T1-Right, T1-Tumor) were considered representative T1 relaxation times (as shown in Figure 1). For this assessment, the image series were evaluated using the RadiAnt DICOM viewer 2021.1 software (Medixant Company, Poland). Statistical analyses were performed using the MedCalc Software (MedCalc Software Ltd, Belgium). To evaluate the agreement and relationship for T1 relaxation times between the two methods at different regions and time-points respectively, Bland-Altman and Pearson analysis were performed. p<0.05 was considered statistically significant.Results
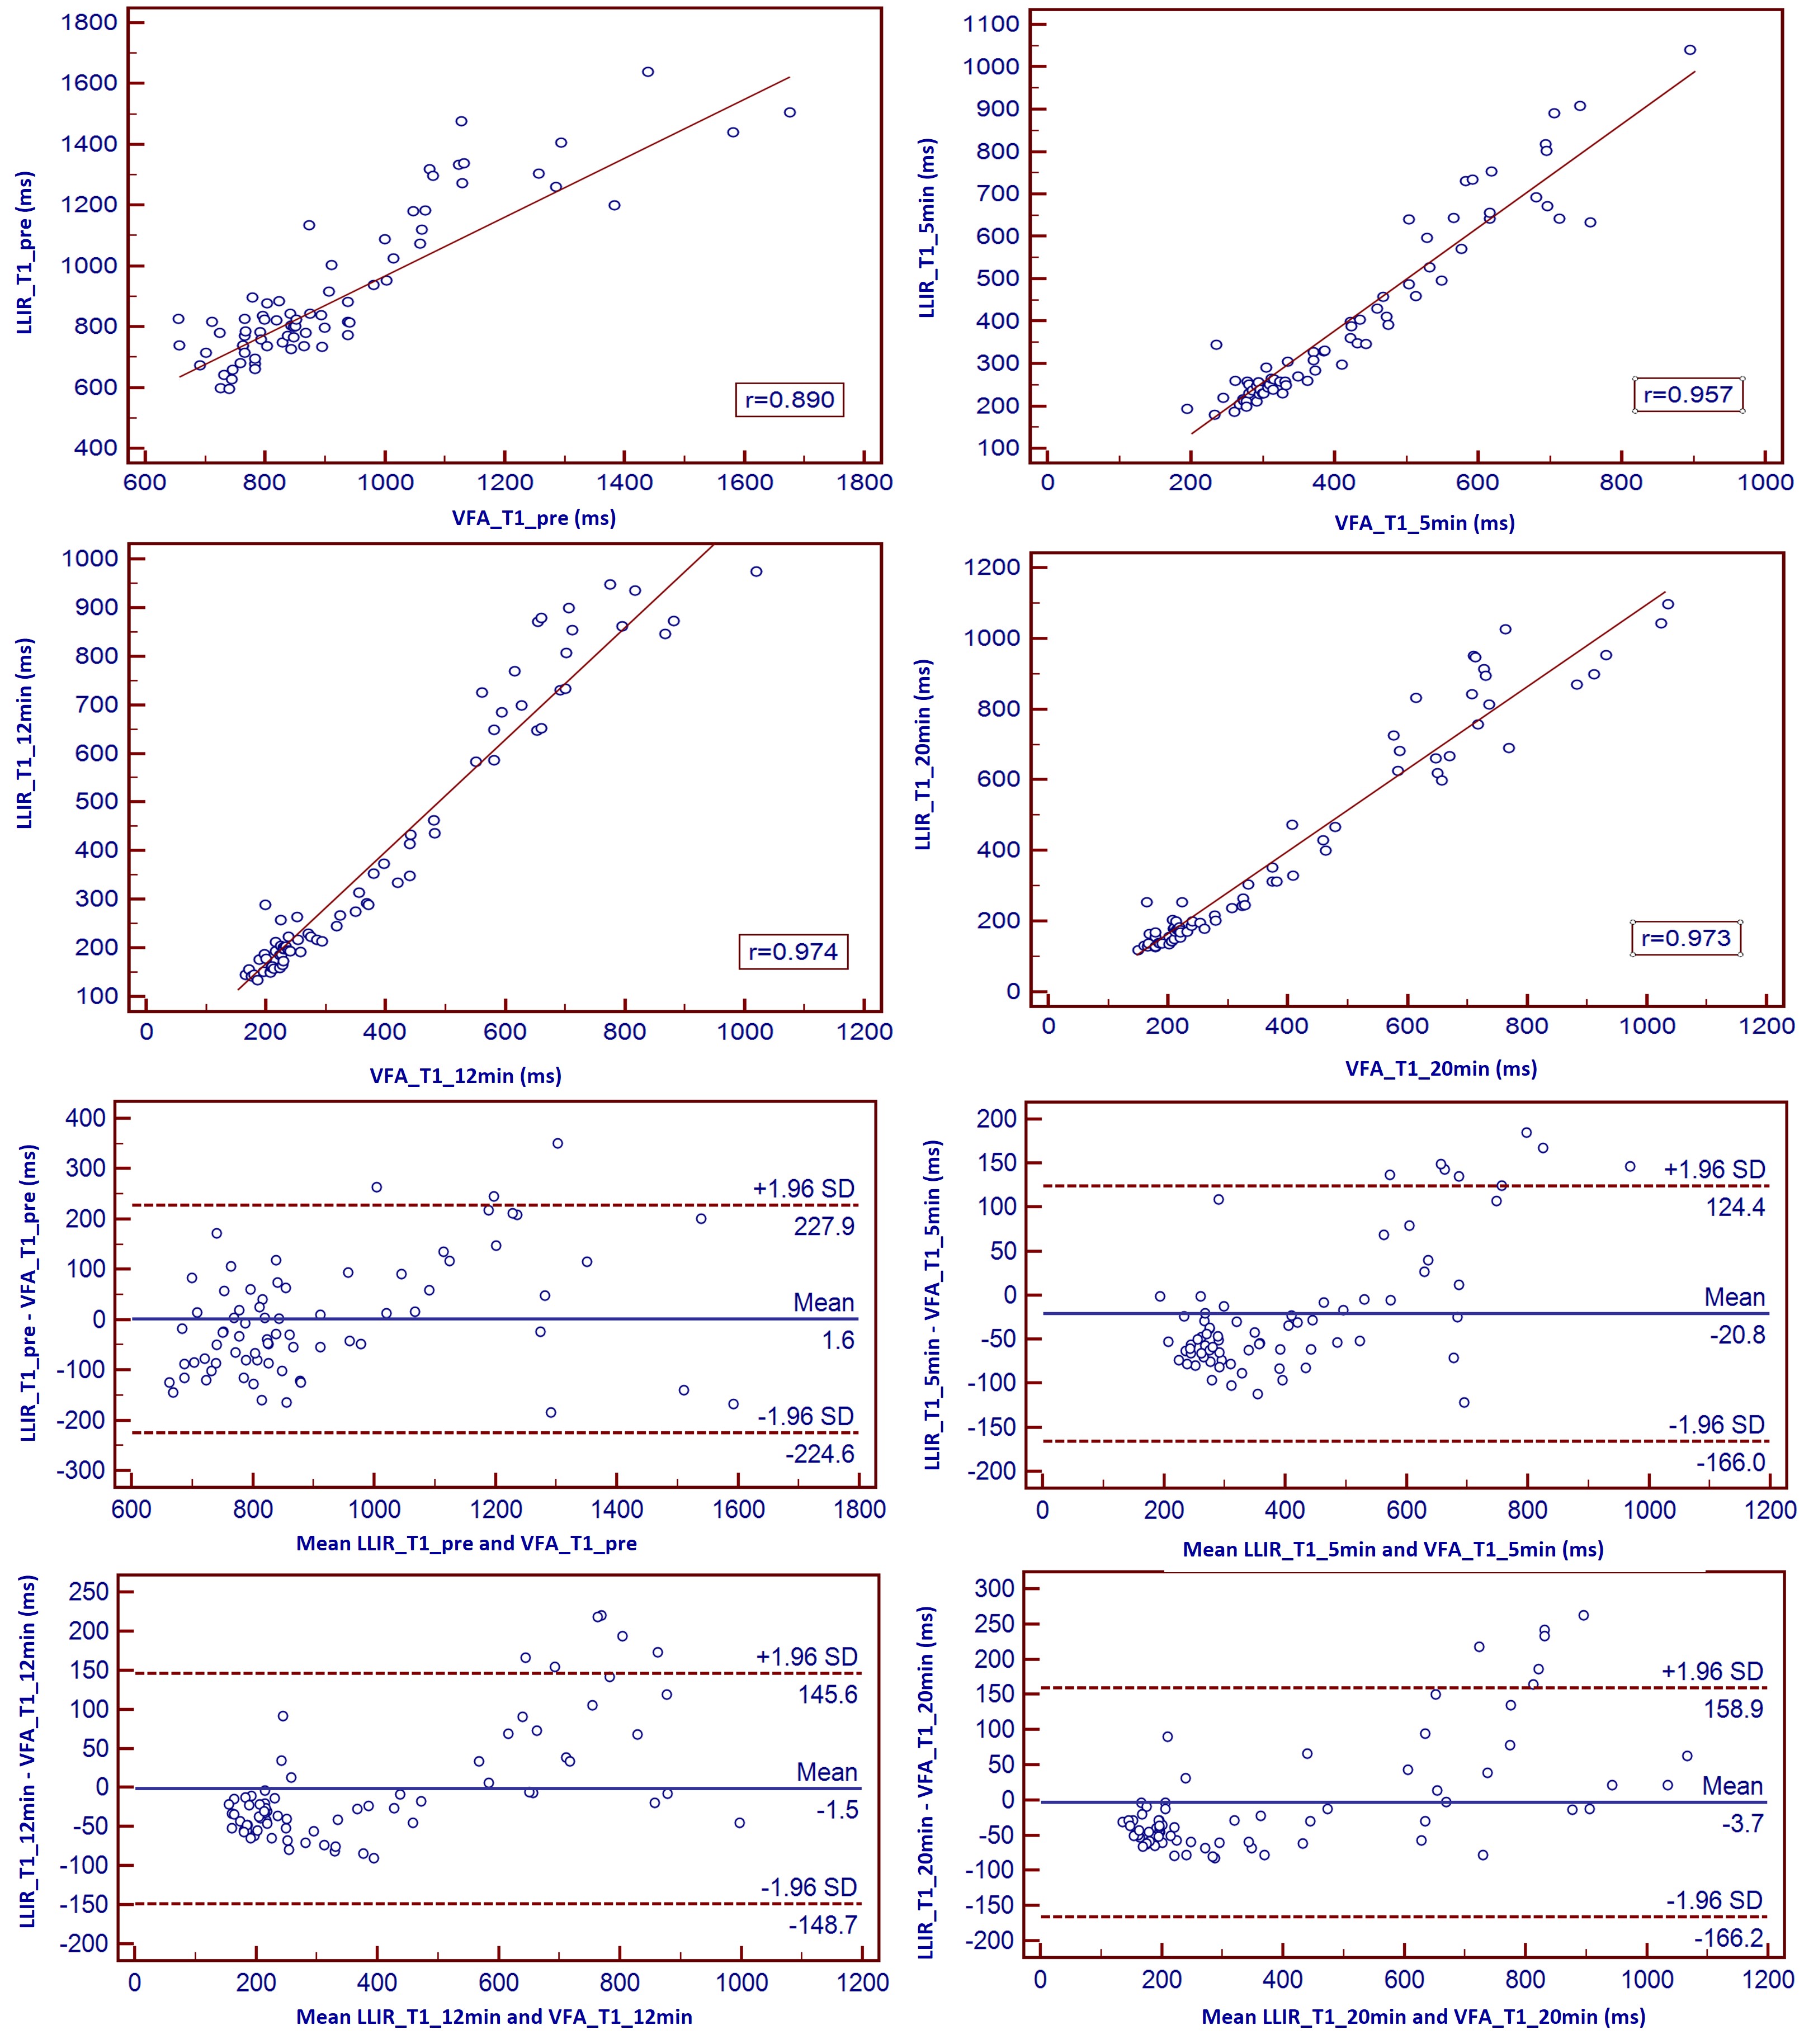
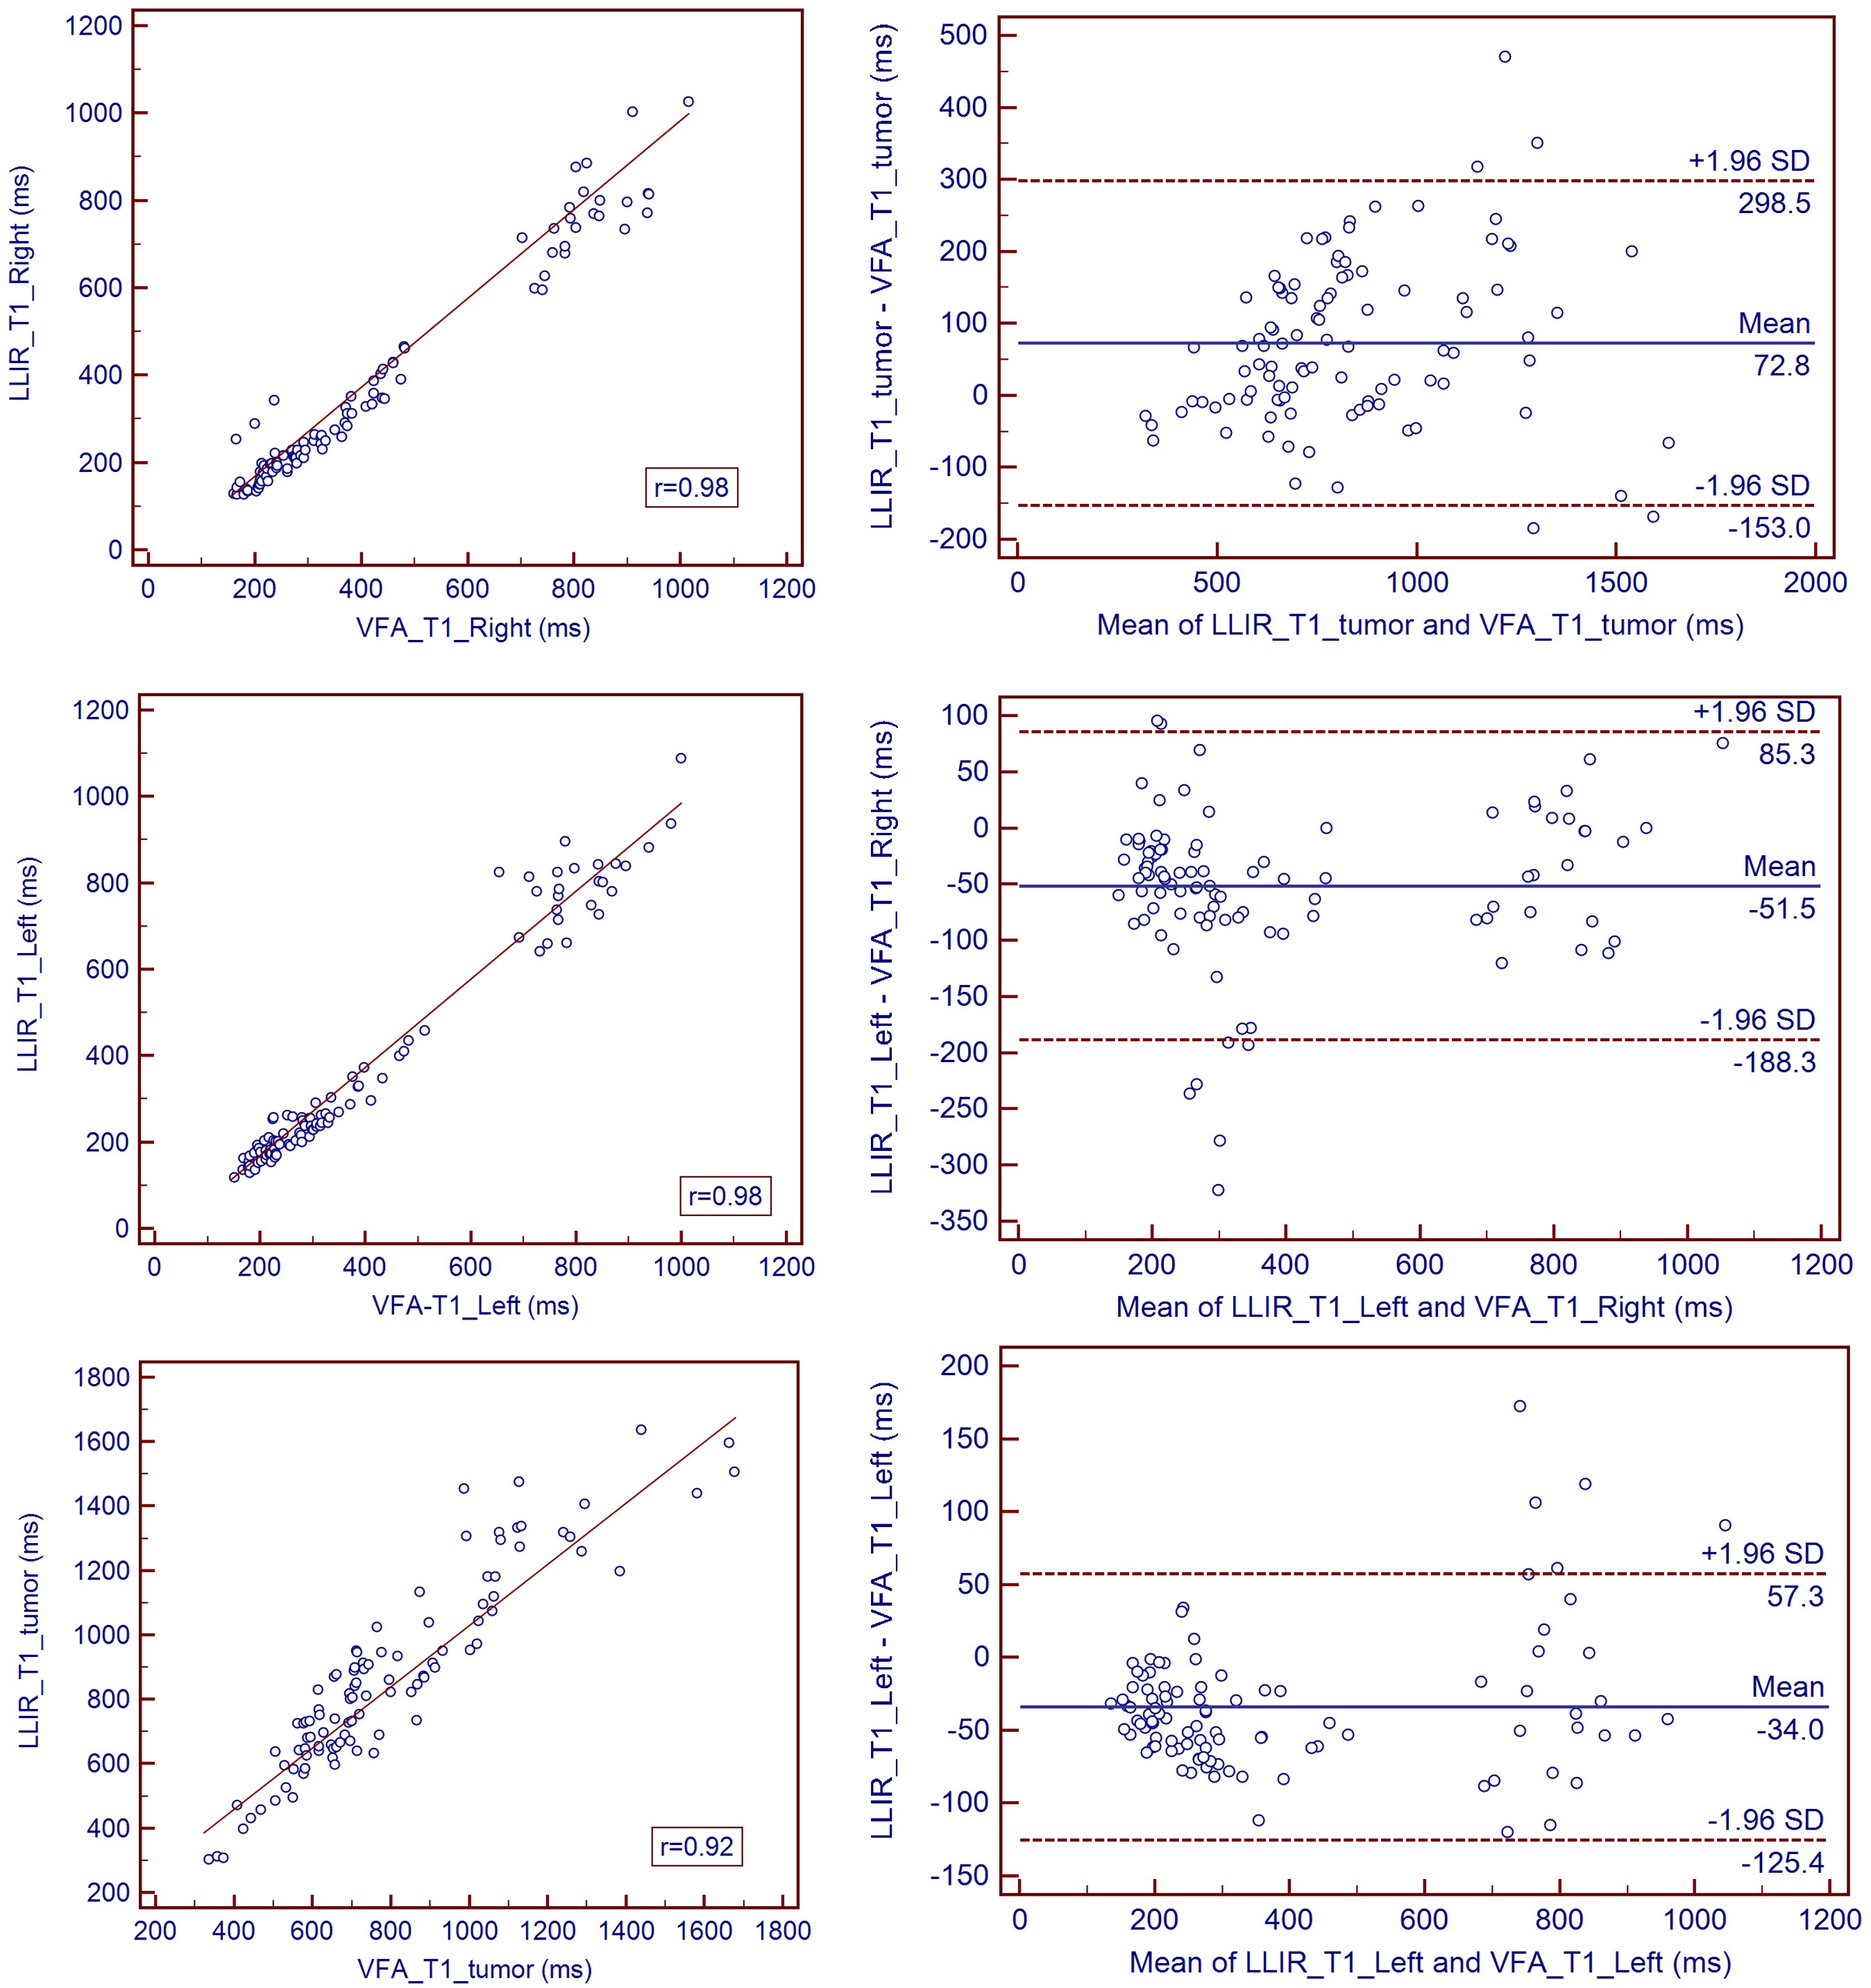
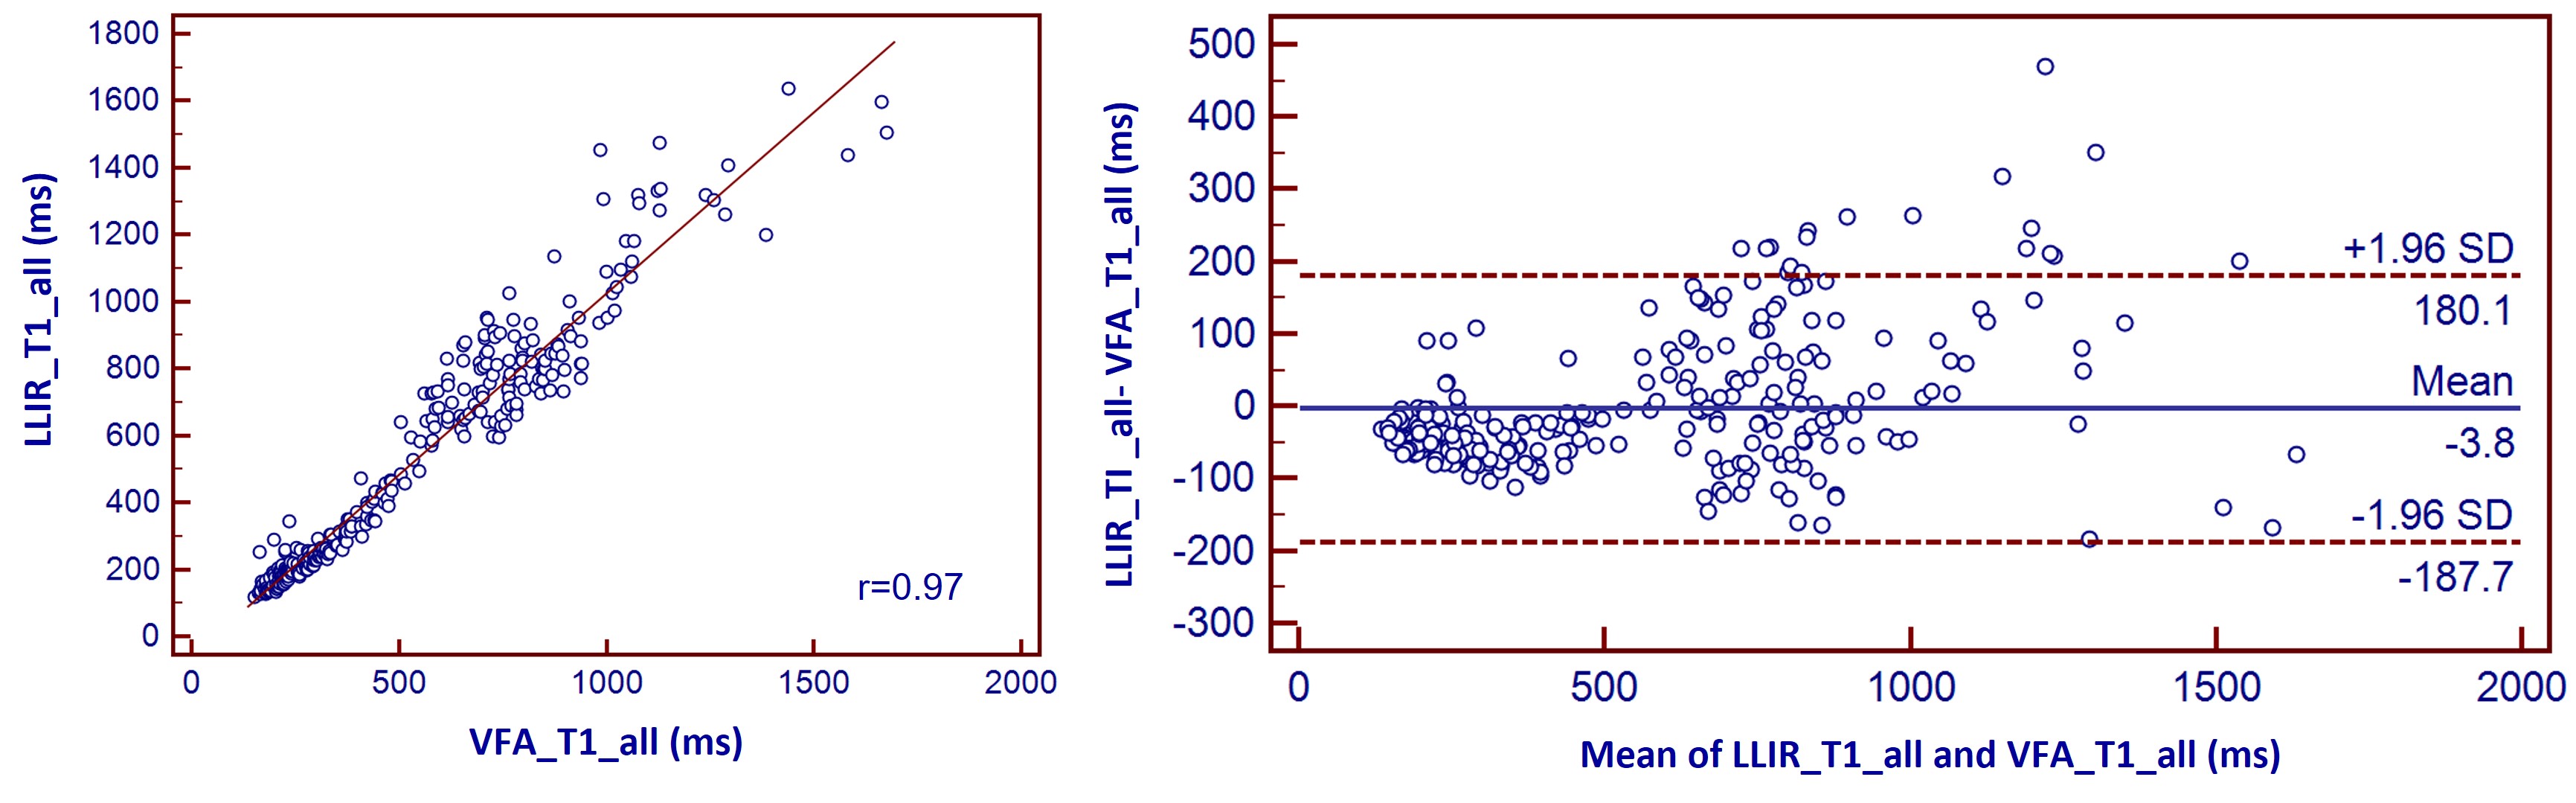
Figure 1 shows the LLIR-T1 map and VFA-T1 map at different time points, and LLIR-T1 map had better image quality in sharpness of organ edges and visualization of liver vessels. High correlations and good agreements were obtained between LLIR-T1 and VFA-T1 for all time points (Figure 2), and the same results were also obtained according to the different regions (Figure 3) and for all data according to time points and regions between the two methods (Figure 4).Discussion
According to our results, T1 relaxation times showed high correlation between VFA-T1 and LLIR-T1 methods in terms of different time points after administration of Gd-EOB-DTPA. Except the T1 value having larger difference at the 5min post contrast (p<0.05), there were no significant differences at other time points.This was consistent with a previous study that found that in some time points the agreement between the two methods was not good, and that the two methods can not be interchanged5. In addition, we found that compared with VFA-T1 method, the T1 value of LLIR-T1 method were lower in the healthy liver tissue, which was consistent with the findings of previous studies6, however, it increased in the tumor tissue, resulting in higher contrast of tumor and healthy liver tissue and sharper edges of organ, as shown in Figure 1. Although both methods have low sensitivity to B1 inhomogeneities, they adopt different methods. Our results showed that LLIR-T1 had better image quality, especially in the left lobe of liver, which had less blur.Conclusions
LLIR-T1 had a strong correlation with VFA-T1 method, but the T1 was lower in healthy liver lobe and higher in tumor.Acknowledgements
No acknowledgement found.References
1.Haimerl M, Schlabeck M, Verloh N et al (2016), Volume-assisted estimation of liver function based on Gd-EOB-DTPA-enhanced MR relaxometry. Eur Radiol 26:1125–1133.
2. Yoon JH, Lee JM, Kim E, Okuaki T, Han JK (2017), Quantitative liver function analysis: volumetric T1 mapping with fast multisection B1 inhomogeneity correction in hepatocyte-specific contrast-enhanced liver MR imaging. Radiology 282:408–417.
3. Deoni, SC, Rutt, BK, Peters, TM (2003), Rapid combined T1 and T2 mapping using gradient recalled acquisition in the steady state. Magn Reson Med 49: 515-526.
4. Deichmann R, Haase A. (1969), Quantification of T1 values by SNAPSHOT-FLASH NMR imaging. Journal of Magnetic Resonance 96:608-612.
5. Ji Eun Kim, Hyun Ok Kim, Kyungsoo Bae, et al. (2019) T1 mapping for liver function evaluation in gadoxetic acid–enhanced MR imaging: comparison of look-locker inversion recovery and B1 inhomogeneity–corrected variable flip angle method. European Radiology. 29(7):3584-3594.
6. Stikov N, Boudreau M, Levesque IR, et al. (2015) On the accuracy of T1 mapping: searching for common ground. Magn Reson Med 73:514–522.
Figures