3207
Investigation of synthetic magnetic resonance imaging applied in the evaluation of the prognostic factors of rectal adenocarcinoma1Sun Yat-sen University Cancer Center, guangzhou, China, 2MR Research, GE Healthcare, Beijing, China, guangzhou, China
Synopsis
The clinical significance of synthetic MRI in rectal adenocarcinoma remains unclear. This study aimed to explore the of quantitative parameters derived from SyMRI clinical stage according to “DISTANCE” criteria and differentiation of rectal adenocarcinoma. Our preliminary study demonstrated that quantitative T2 and PD values obtained by SyMRI might be used for noninvasive evaluation of prognostic factors of rectal adenocarcinoma. Furthermore, combining the two quantitative relaxation metrics further improved their diagnostic performance of mrN stage in rectal adenocarcinoma.
Introduction
Synthetic MRI (SyMRI), as a novel quantitative MR technology, performed using a multidynamic multi-echo (MDME) sequence, enables the simultaneous quantification of longitudinal and transverse relaxation times (T1 and T2) and proton density (PD) in a single scan within a vastly shortened examination time compared with conventional MRI [1], which can reflect the flow water content and cellular density in different tissues, or assessing myocardial diffuse fibrosis [2]. This technique has been successfully applied in determining the viability of bone metastases in prostate cancer, differentiating benign and malignant lesions in breast, and showing promise in various central nervous system diseases [3-5], and has shown excellent correlation with conventional mapping techniques and no inferior image quality to conventional contrast-weighted images. Nevertheless, the clinical significance of synthetic MRI in rectal adenocarcinoma remains unclear. This study aimed to explore the of quantitative parameters derived from SyMRI clinical stage according to “DISTANCE” criteria [6] and differentiation of rectal adenocarcinoma.Materials and methods
This prospective study included 87 patients (55 men and 32 women, mean age, 59±11 years) from January 22, 2019 to August 16, 2021. The quantitative metrics derived from SyMRI and diffusion-weighted imaging (DWI) at 3.0T MR system (Signa Pioneer, GE Healthcare, Milwaukee, WI) with a 32-channel phased array body coil, including T1, T2, PD and ADC values, were measured in rectal adenocarcinoma, which were manually delineated on the slice with the largest tumor diameter, avoiding margins and the intestinal lumen, by two radiologists respectively (read 1 and 2, with 10 and 3 years of experience in rectal imaging). Interobserver variability was evaluated using the interclass correlation coefficient (ICC). The diagnostic performance of SyMRI was evaluated with independent sample t-test or Mann–Whitney U test, receiver operating characteristic curve analysis and multivariate logistic regression analysis. The AUCs of quantitative values were compared using Delong test.Results
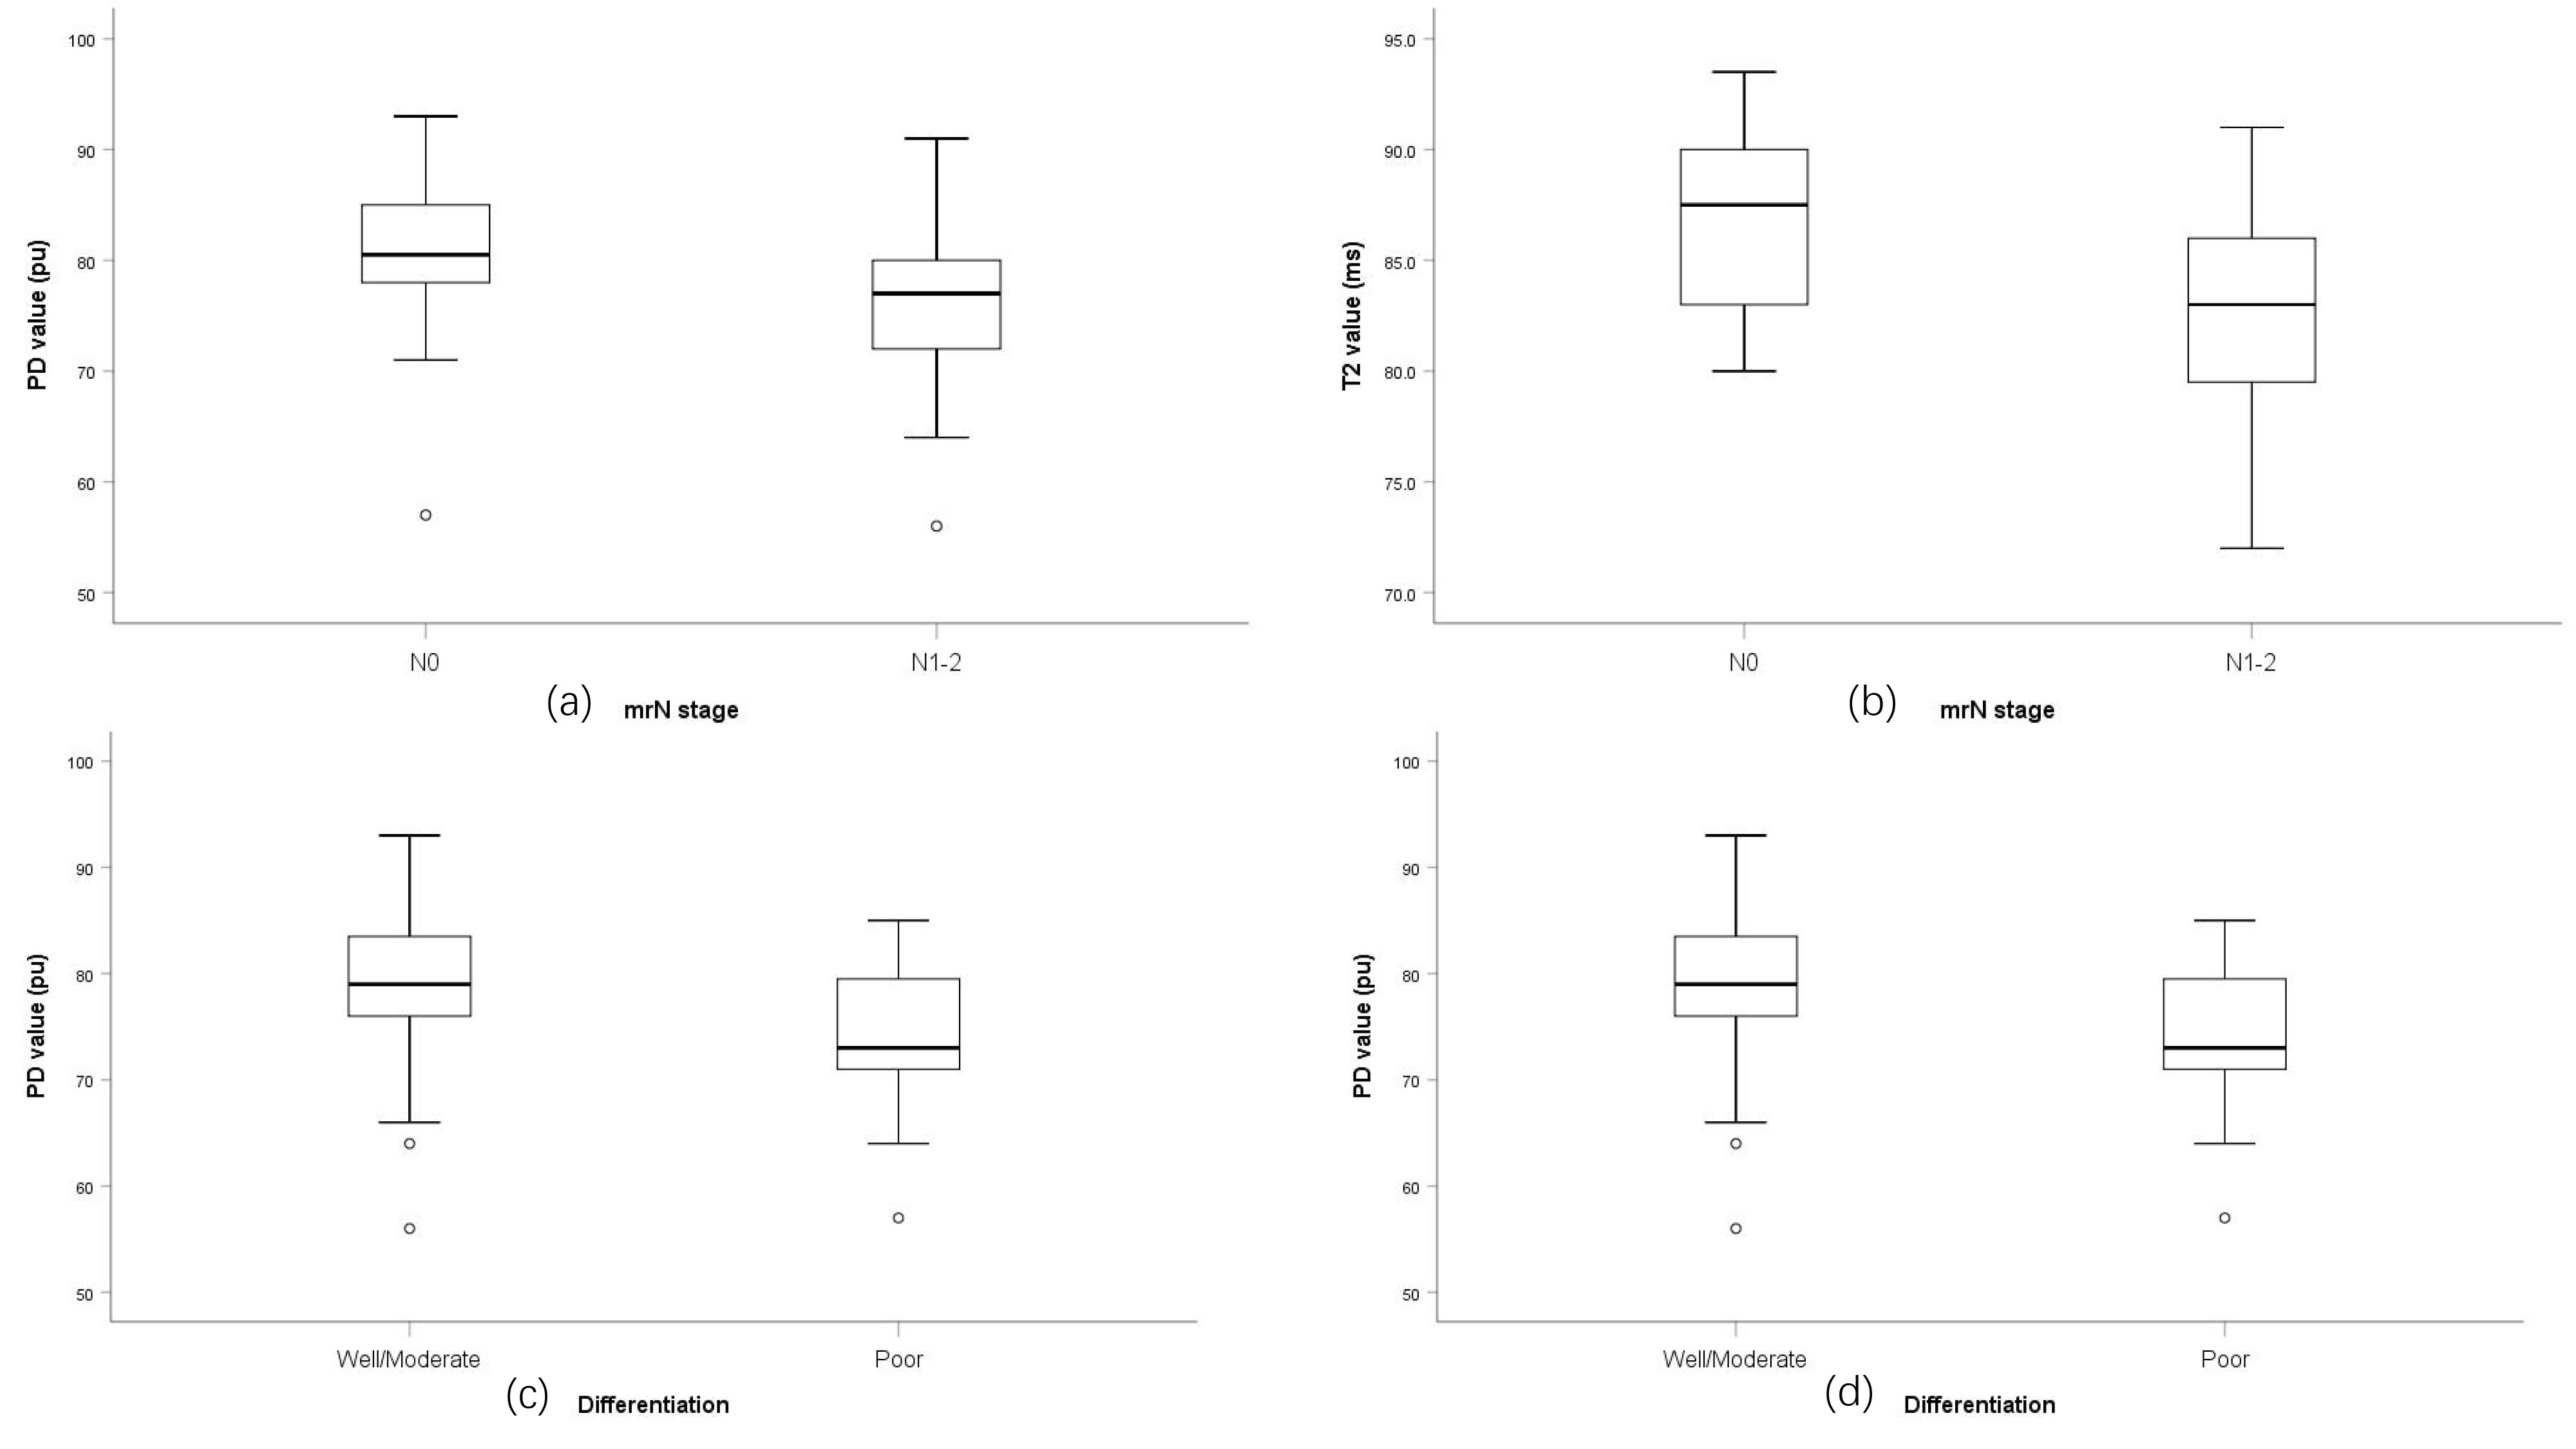
There was excellent interobserver agreement of two radiologists in the measurement of quantitative parameters. The ICCs of the T1, T2, PD, and ADC values were 0.888 (95% CI: 84.1–92.1%), 0.946 (95% CI: 92.3–96.2%), 0.949 (95% CI: 92.7–96.4%), and 0.891 (95% CI: 84.5–92.4%), respectively. The differences in T1, T2, PD and ADC values in each subgroup are shown in Table 1. The T2 and PD values decreased significantly in patients with poor differentiation, and lymph node metastasis in rectal adenocarcinoma. No significant differences in T1 and ADC values were observed in each subgroup. The comparison of T2 and PD values in two subgroups of mrN stage and differentiation was demonstrated in Figure 1. Representative images of synthetic MRI were shown in Figure 2. The AUC values of T2 and PD values for well or moderate differentiation versus poor differentiation were 0.673 (95% CI: 0.510-0.836), 0.686 (95% CI: 0.534-0.838), respectively. The AUC values of T2 and PD values for mrN0 versus mrN1-2 were 0.734 (95% CI: 0.624-0.863), 0.682 (95% CI: 0.566-0.797), respectively. Combining the T2, PD values and CEA improved their diagnostic performance in the identification of mrN stage (figure 3).Conclusion
Quantitative T2 and PD values obtained by SyMRI might be used for noninvasive evaluation of prognostic factors of RC in mrN and differentiation. Furthermore, combining the two quantitative relaxation metrics further improved their diagnostic performance of mrN stage in RC.Acknowledgements
We thank the study participants and referring technicians for their participation in this study.References
1 Hagiwara A, Warntjes M, Hori M et al (2017) SyMRI of the Brain: Rapid Quantification of Relaxation Rates and Proton Density, With Synthetic MRI, Automatic Brain Segmentation, and Myelin Measurement. Investigative radiology 52:647-657
2 Cui Y, Han S, Liu M et al (2020) Diagnosis and Grading of Prostate Cancer by Relaxation Maps From Synthetic MRI. Journal of magnetic resonance imaging : JMRI 52:552-564
3 Arita Y, Takahara T, Yoshida S et al (2019) Quantitative Assessment of Bone Metastasis in Prostate Cancer Using Synthetic Magnetic Resonance Imaging. Investigative radiology 54:638-644
4 Gao W, Zhang S, Guo J et al (2021) Investigation of Synthetic Relaxometry and Diffusion Measures in the Differentiation of Benign and Malignant Breast Lesions as Compared to BI-RADS. Journal of magnetic resonance imaging : JMRI 53:1118-1127
5 Ji S, Yang D, Lee J, Choi S, Kim H, Kang K (2020) Synthetic MRI: Technologies and Applications in Neuroradiology. Journal of magnetic resonance imaging : JMRI. 10.1002/jmri.27440
6 Nougaret S, Reinhold C, Mikhael H, Rouanet P, Bibeau F, Brown G (2013) The use of MR imaging in treatment planning for patients with rectal carcinoma: have you checked the "DISTANCE"? Radiology 268:330-344
Figures