3206
Accurate and simultaneous acquisition of T1, T2, PD weighted, and MT weighted images using SPGR and DESS
Yi-Cheng Hsu1, Patrick Liebig2, and Ying-Hua Chu1
1Siemens Healthineers Ltd., Shanghai, China, 2Siemens Healthcare GmbH, Erlangen, Germany
1Siemens Healthineers Ltd., Shanghai, China, 2Siemens Healthcare GmbH, Erlangen, Germany
Synopsis
We proposed a method to simultaneously acquire T1, T2, PD weighted, and MT weighted images. The scan time is the same as conventional SPGR T1 and DESS T2 mapping but with higher accuracy. This method will benefit diagnosis on muscular dystrophy, inflammation, fibrosis, and cartilage integrity.
Introduction
Quantitative MRI isolates tissue properties from the influence of MR parameters and aid in earlier disease detection1, longitudinal studies2, and monitoring treatment3. Moreover, a good quantitative map depends mildly on protocols and scanners and can be used for machine-learning diagnosis without retraining for different protocol and hardware.The gold standard methods of T1 and T2 mapping methods require long acquisition times. For clinical applications, several accelerated methods were proposed. MOLLI acquires several echoes during magnetization recovery and T1 maps can be calculated based on data collected in a single breath hold4. GRAPPATINNI accelerates multiple spin-echo acquisitions by reducing spatial encodings and reconstructs the T2 map using a model-based method5. However, the quantification is usually biased in the 2D methods due to the imperfect slice profile and B1 inhomogeneity. 3D mapping methods can reduce bias by 3D excitation and using actual flip angles in T1 and T2 estimates. By acquiring spoiled gradient echo (SPGR) images at two different flip angles, we can estimate T1 maps6. Two images from large flip angle dual-echo steady-state (DESS) can be combined to approximate a T2 map7. However, the signal equation for T1 estimation depends slightly on T2 values and vice versa. Here, we propose a new simultaneous T1 and T2 mapping method, which uses 3D excitation and actual flip angles in quantification. Moreover, a magnetization transfer (MT) weighted image will be simultaneously calculated without extra scan time.
Methods
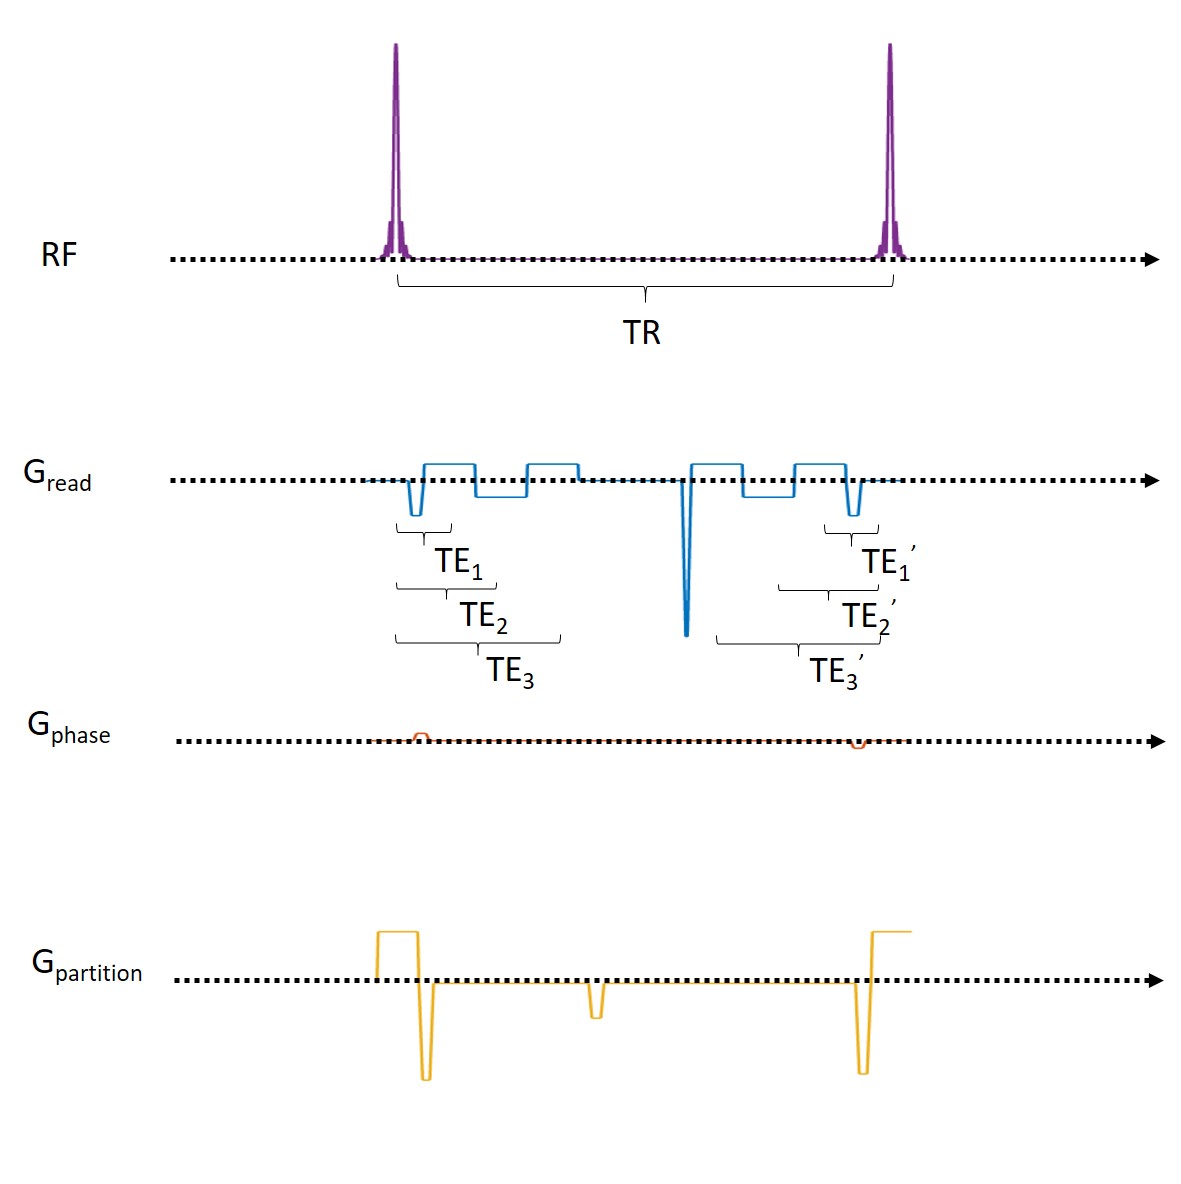
The pulse sequence of multi-echo DESS was shown in Figure 1. In this study, we only implemented a single-echo version of it. It’s crucial that TE1 equals TE1' such to eliminate the effect of T2’. The signals of SPGR and DESS were modeled based upon the extended phase graph theory8:$$S_{SPGR}(α,TR_{SPGR},TE)=M_{0,SPGR}×f_{EPG} (T_1,T_2,TR_{SPGR},α,Ψ)×\exp(-\frac{TE}{T2}-\frac{TE}{T2'}),$$
$$S_{DESS,0} (α,TR_{DESS},TE_n )=M_{0,DESS}× \tan(\alpha/2)⋅(1-(E_1-\cos\alpha )⋅r)⋅\exp(-\frac{TE_n}{T2}-\frac{TE_n}{T2' }),$$
$$S_{DESS,-1} (α,TR_{DESS},TE_m' )=M_{0,DESS}×\tan(\alpha/2)⋅(1-(1-E_1 \cos\alpha )⋅r)/E_2 ⋅\exp(-\frac{TR{DESS}-TE_m'}{T2}-\frac{TE_m'}{T2' }),$$
$$E_{1,2}=\exp(-\frac{TR_DESS}{T_{1,2}}),$$
$$p=1-E_1\cos\alpha-E_2^2(E_1-\cos\alpha),$$
$$q=E_2(1-E_1)(1+\cos\alpha),$$
$$r=(1-E_2^2) (p^2-q^2)^{-1/2}$$
, where fEPG is the F0 at steady-state and was calculated using numerical methods.
Ψ is the RF-pulse phase-difference increment for RF spoiling. By choosing the same TE and TE’ in SPGR and DESS, we can solve for the unknowns, T1, T2, $$$M_{0,SPGR}, M_{0,DESS}$$$ from four signal equations of $$$S_{SPGR} (\alpha_1,TR_{SPGR},TE),S_{SPGR} (\alpha_2,TR_{SPGR},TE),S_{DESS,0} (\alpha_3,TR_{DESS},TE),S_{DESS,-1} (\alpha_3,TR_{DESS},TE)$$$. Due to the large RF power difference between SPGR and DESS, $$$M_{0,SPGR}, M_{0,DESS}$$$ can be used to calculate MT weighted images: $$$MTw=(M_{0,SPGR}-M_{0,DESS})/M_{0,SPGR}$$$.
We acquired four sets of images of the knee using the SPGR (TE=3ms,TR=10ms,flip angle=4o/21o, FOV=160x160x56mm3, and matrix size=256x256x28) and the DESS (TE=3ms,TR=20ms, flip angle=40o, FOV=160x160x56mm3, and matrix size=256x256x28) sequences. We used the same protocol for the phantom studies apart from using a different matrix size (160x160x28). Flip angle maps were acquired using pre-saturation turbo fast low angle shot (FOV=200x200x87.5mm3, and matrix size=64x64x28). The flip angle maps were used to estimate T1 and T2. A phantom was built, consisting of four tubes to evaluate the accuracy of our method. Each tube contains 2.27%, 2.86%, 3.43%, and 4% of agarose respectively and 0.003M of CUSO4.
The gold standard T1 and T2 values of these four tubes were determined separately by a 1D spin-echo sequence (TE=10/30/50/70/90/110/130/150ms, and TR=20000ms) and inversion recovery spin-echo sequence (IR=200/400/600/800/1000/1200/1400/1600/1800/2000ms, TE=10ms, and TR=20000ms). We compared our method with three well-known T1 and T2 mapping techniques: the conventional B1 corrected SPGR with two flip angles for T1 mapping, DESS T2 mapping using the same data acquired as for our method, and the multi-echo spin-echo (MESE) method (TE= 13.8/27.6/41.4/55.2/69ms, TR=1980ms, FOV=128x128x56mm3, and matrix size=128x128x28) for T2 mapping. A healthy volunteer and the phantom were scanned. All experiments were conducted at a 3T MR scanner (MAGNETOM Prisma, Siemens, Erlangen, Germany).
Results
Figure 2AD shows the T1 and T2 maps using the proposed method. The T2 values are lower compared with those acquired using the MESE method (Figure 2C). Visually, T1 and T2 maps are similar to those reconstructed using SPGR and DESS separately (Figure 2). Table 1 compared the mean T1 and T2 values estimated by different methods. The T2 values estimated by the proposed method deviate less than 1% from the gold standard, whereas MESE presents a strong bias of T2 values. The T2 values were underestimated using DESS alone and the bias increases when T2 is higher. For T1 maps, the proposed method is more accurate than the SPGR method with 2% bias compared with the gold standard. Figure 3A and 3B shows the M0 images estimated for SPGR and DESS sequences. M0,SPGR has more homogeneous contrast, which is similar to the PD contrast image but M0,DESS presents hypo-intensities in muscle and cartilage. By combining these two images, an MT-weighted image (Figure 3C) was reconstructed. Figure 4 shows the T1 and T2 maps calculated by the proposed method.Discussion and Conclusion
We proposed a method to simultaneous acquire T1, T2, PD weighted, and MT weighted images. The scan time is the same as conventional SPGR T1 and DESS T2 mapping, but with an accuracy comparable to SE T2 and IR-SE T1 mapping. In the future, we will extend this approach to a multi-echo version and acquire T2’ map as well without extra scan time. Moreover, we can replace the SPGR sequence with multi-echo SPGR sequence or multi-echo DESS sequence to acquire more information for higher image quality.Acknowledgements
No acknowledgement found.References
- Klietz, Martin, et al. Cerebral microstructural alterations in patients with early Parkinson's disease detected with quantitative magnetic resonance measurements. Frontiers in Aging Neuroscience: 742.
- Gracien, René‐Maxime, et al. Longitudinal quantitative MRI assessment of cortical damage in multiple sclerosis: a pilot study. Journal of magnetic resonance imaging 46.5 (2017): 1485-1490.
- Lescher, Stephanie, et al. Quantitative T1 and T2 mapping in recurrent glioblastomas under bevacizumab: earlier detection of tumor progression compared to conventional MRI. Neuroradiology 57.1 (2015): 11-20.
- Messroghli, Daniel R., et al. Optimization and validation of a fully‐integrated pulse sequence for modified look‐locker inversion‐recovery (MOLLI) T1 mapping of the heart. Journal of Magnetic Resonance Imaging, 26.4 (2007): 1081-1086.
- Hilbert, Tom, et al. Accelerated T2 Mapping Combining Parallel MRI and Model-Based Reconstruction: GRAPPATINI. Journal of Magnetic Resonance Imaging, 48.2 (2018): 359–368.
- Homer J, Beevers MS. Driven-equilibrium single-pulse observation of T1 relaxation. A re-evaluation of a rapid 'new' method for determining NMR spin-lattice relaxation times. J Magn Reson, 63 (1985): 287–297.
- Welsch, Goetz H., et al. Rapid Estimation of Cartilage T2 Based on Double Echo at Steady State (DESS) with 3 Tesla. Magnetic Resonance in Medicine, 62.2 (2009): 544–549.
- Weigel, M., Schwenk, S., Kiselev, V. G., Scheffler, K. & Hennig, J. Extended phase graphs with anisotropic diffusion. Journal of magnetic resonance 205 (2010): 276–285.
Figures
Figure
1. Pulse sequence diagram of multi-echo dual-echo steady-state (DESS) sequence. For single-echo
application for T2 mapping, we should choose TE1=TE1’ to eliminate the
influence of T2’.
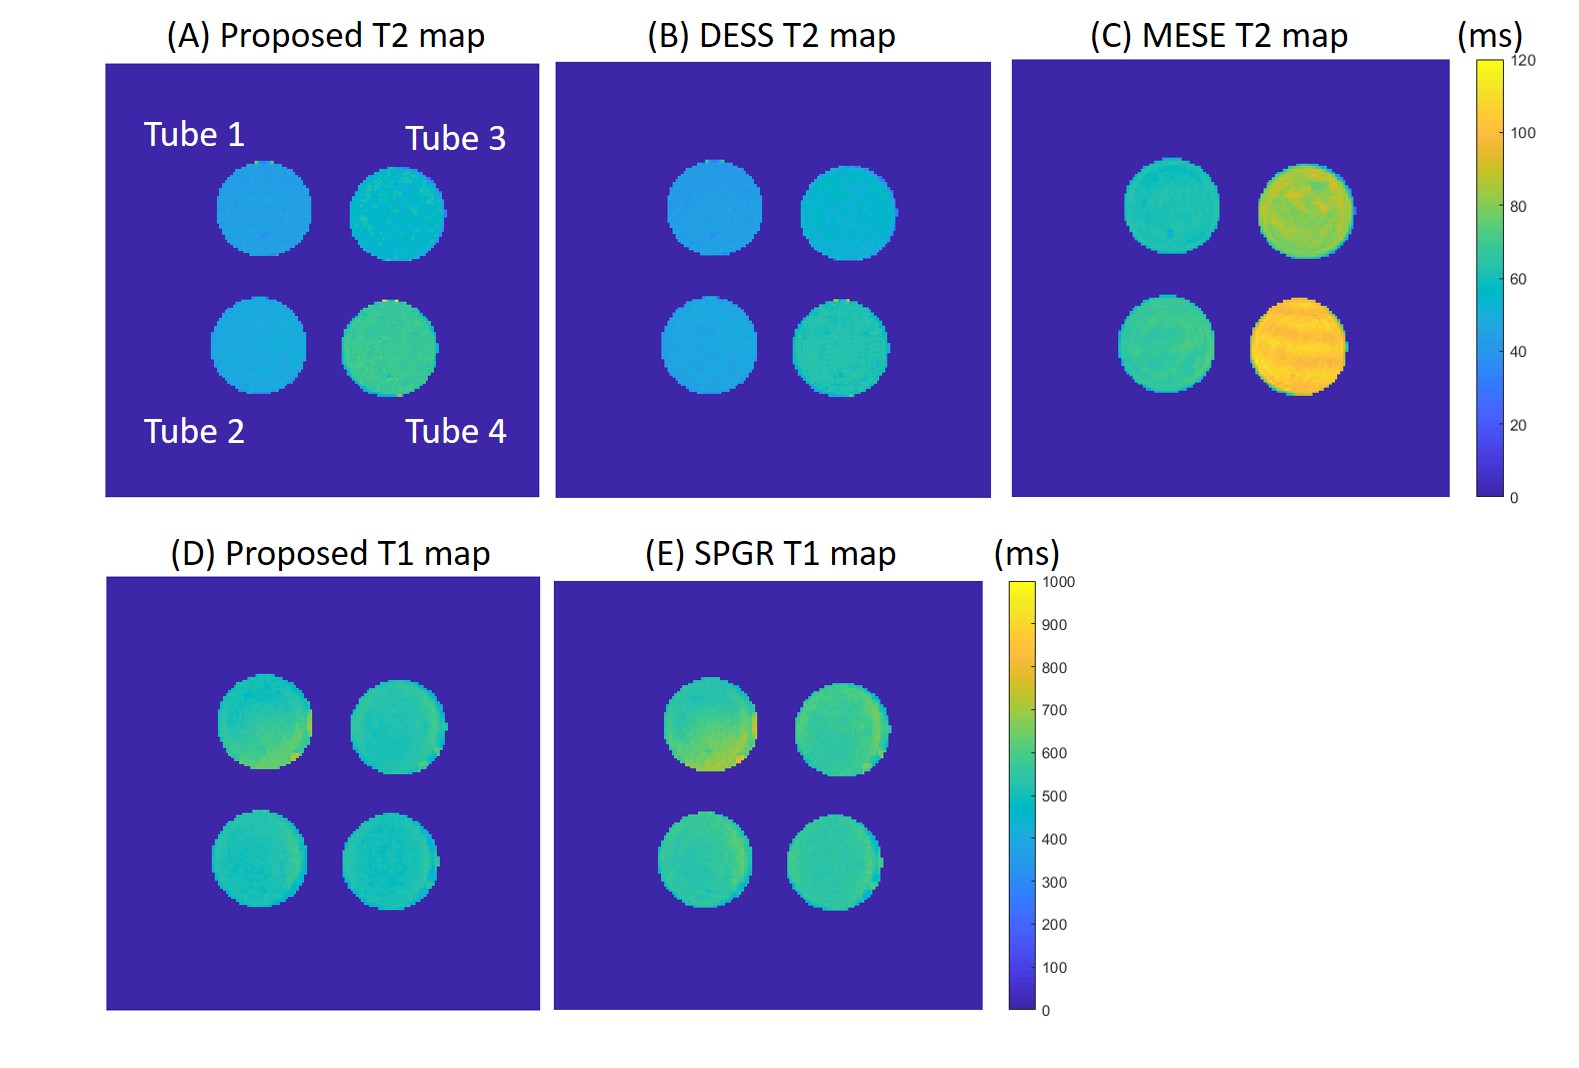
Figure 2. (A) The T2 and (D) T1 maps of the
phantom estimated by the proposed methods. The T2 map was estimated using (B)
DESS and (C) MESE sequence and the T1 map was estimated using (E) SPGR
sequence.
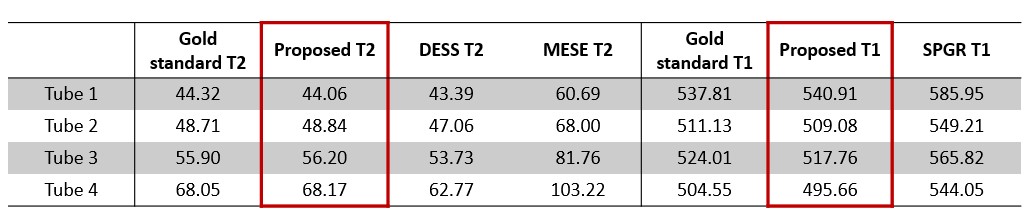
Table
1. The mean T1 and T2 values were estimated using the gold standard methods, the
proposed method, the DESS method, the MESE method, and the SPGR method.
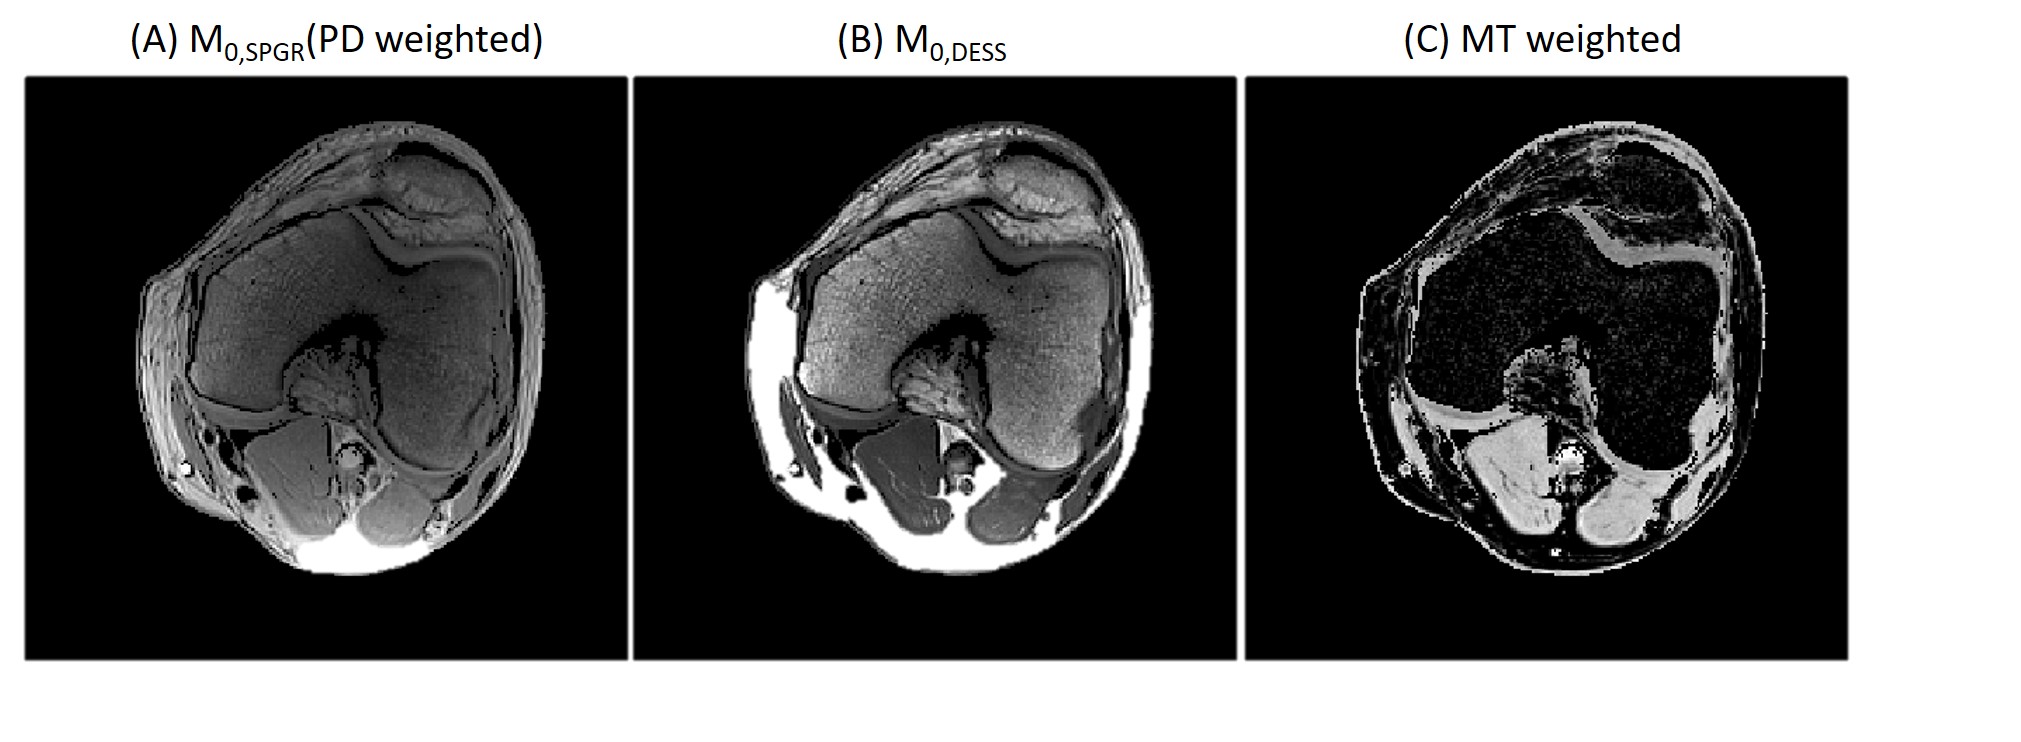
Figure 3. (A) the knee M0 image corresponds
to the SPGR sequence and (B) the knee M0 image corresponds to the DESS sequence. Higher
flip angle implemented in the DESS sequence results in higher MT effect. (C) the MT
weighted image was calculated from the M0 images of SPGR and DESS.
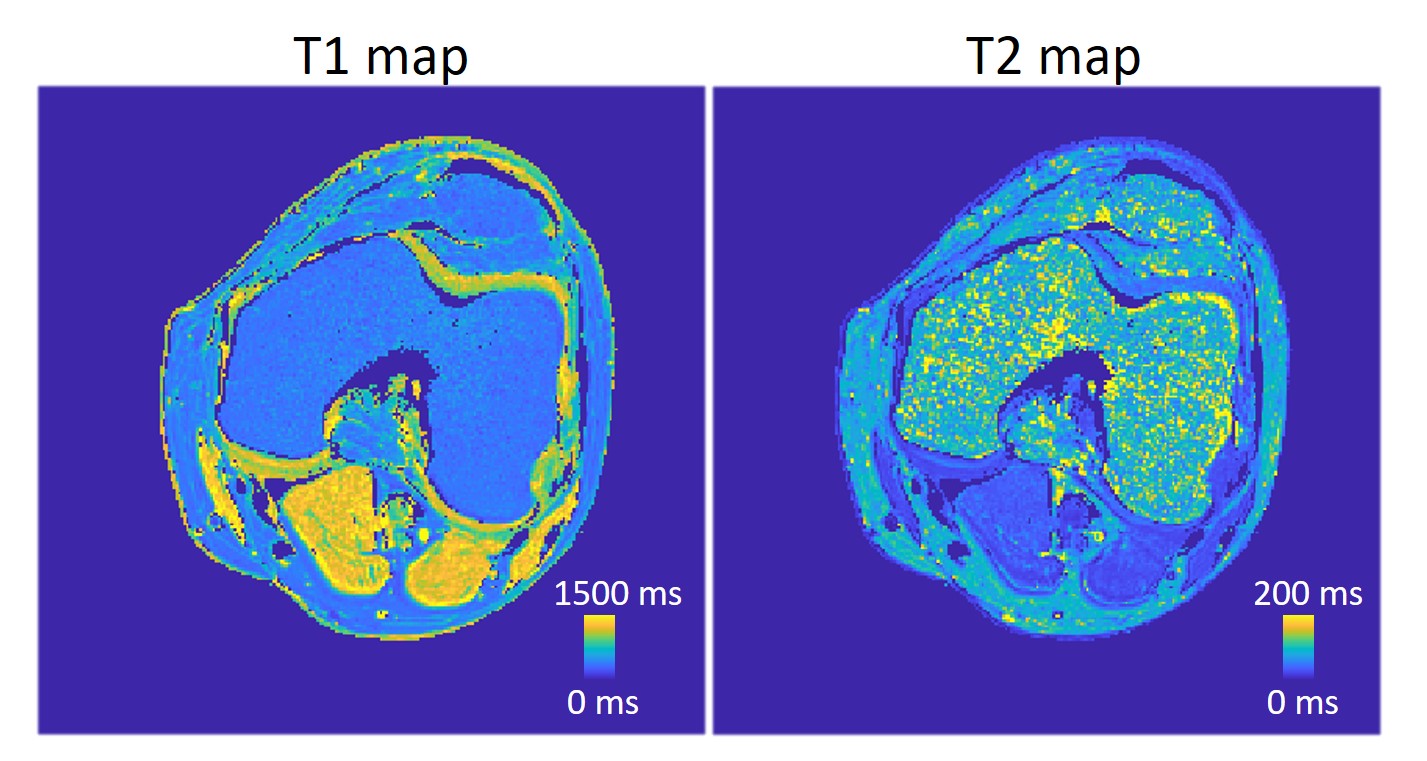
Figure 4. Knee T1 and T2 map of the healthy
volunteer estimated by the proposed method.
DOI: https://doi.org/10.58530/2022/3206