3205
Role of quantification of relaxation time from synthetic MRI in diagnosis and grading of prostate cancer1Department of Radiology, Yunnan Cancer Hospital, Third Affiliated Hospital of Kunming Medical University, Kunming, China, 2MR Research, GE Healthcare, Beijing, China
Synopsis
This study aims to investigate the value of quantitative relaxation time derived from synthetic MRI (SyMRI) in the diagnosis and grading of prostate cancer (PCa). The results of this study showed that the diagnostic efficiencies of SyMRI in distinguishing PCa from most benign prostate lesions and different Gleason grades of PCa were similar to that of DWI, and the combined index of SyMRI and DWI can obtain higher diagnostic efficiencies. In addition, SyMRI has the advantages of short scanning time, unified parameters and simple operation, so it has a good prospect of clinical application.
Introduction
MRI is recognized as the best non-invasive imaging method to diagnose PCa clinically, and the Prostate Imaging Reporting And Data System (PI-RADS) was introduced for multiparametric MRI standardized scans. However, the signal intensity of conventional MRI is influenced by scanner types and acquisition parameters, and a direct comparison between absolute signal intensities is meaningless, which leads to the evaluation of MRI mainly depends on the comparison between the lesion and surrounding tissues in the same slice. Synthetic MRI (SyMRI) is a new MR quantitative technology based on quantification of relaxation times and proton density by multi-echo acquisitions of a saturation-recovery using turbo spin-echo readout (QRAPMASTER) method, which can not only quickly quantify the values of T1, T2 and PD, but also can obtain multiple synthetic contrast-weighted images within a single 5 min scan simultaneously. At present, it has been applied in a variety of diseases and shows good diagnostic effects. Since there are only two reports on the study of PCa using Sy MRI, and no published study has distinguished between PCa and prostatitis using SyMRI, our study aims to furtherly investigate the diagnostic value of SyMRI in the diagnosis and grading of PCa.Material and Methods
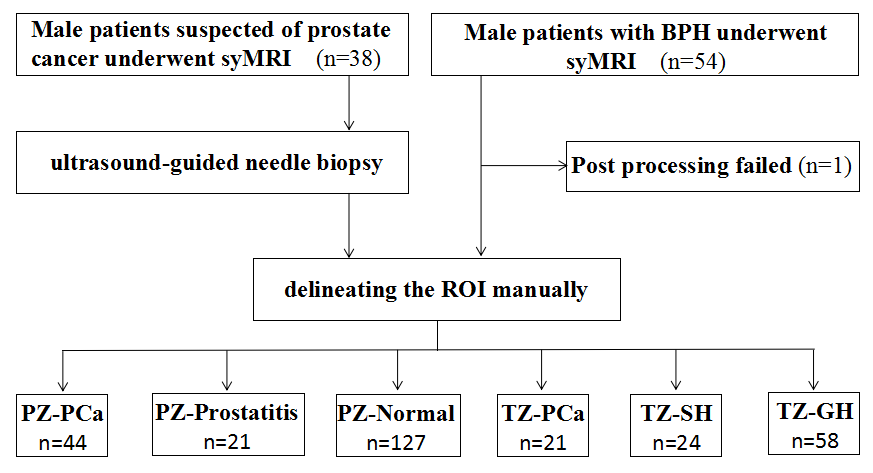
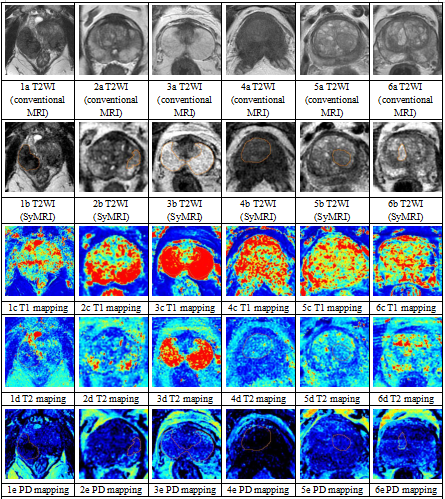
Patients 38 patients suspected of PCa due to PSA elevation were prospectively recruited, and 54 patients with clinically diagnosed benign prostatic hyperplasia were also randomly recruited, both of them underwent routine and SyMRI.MR imaging acquisition The MRI was performed on a 3T scanner (SIGNA Pioneer, GE Healthcare, Milwaukee, WI, USA). Conventional MRI sequences include T1-weighted imaging (T1WI), T2-weighted imaging (T2WI) and diffusion-weighted imaging (DWI); SyMRI sequences include T1WI and T2WI, and quantitative parameter maps are generated by MAGiC software of the scanner console.
Imaging data analysis and processing Two radiologists delineated regions of interest (ROIs). For PCa lesions and prostatitis lesions with puncture results, the ROI of each layer of image was outlined according to the biopsy site recorded by ultrasound puncture and the signal characteristics of T2WI and DWI; for prostatitis lesions without puncture results, ROIs were outlined according to the signal characteristics of low signal on T2WI and diffusion restriction on DWI; for glandular hyperplasia (GH) and stromal hyperplasia (SH), ROIs were outlined according to the signal characteristics on T2WI, GH and SH show well-defined, homogeneous hyper- and hypointense nodules, respectively; for the normal PZ area, ROIs were outlined according to the high signal characteristics on T2WI. ROIs were drawn to exclude hemorrhage, necrosis and calcification.
Statistical analysis The comparison of the data was analyzed by unpaired t test and the Wilcoxon rank sum test between two groups. The Kruskal–Wallis test was used for multiple group comparison. Receiver operating characteristic (ROC) curve and the The DeLong test were used to assess the diagnostic efficiencies of the different parameters.
Results
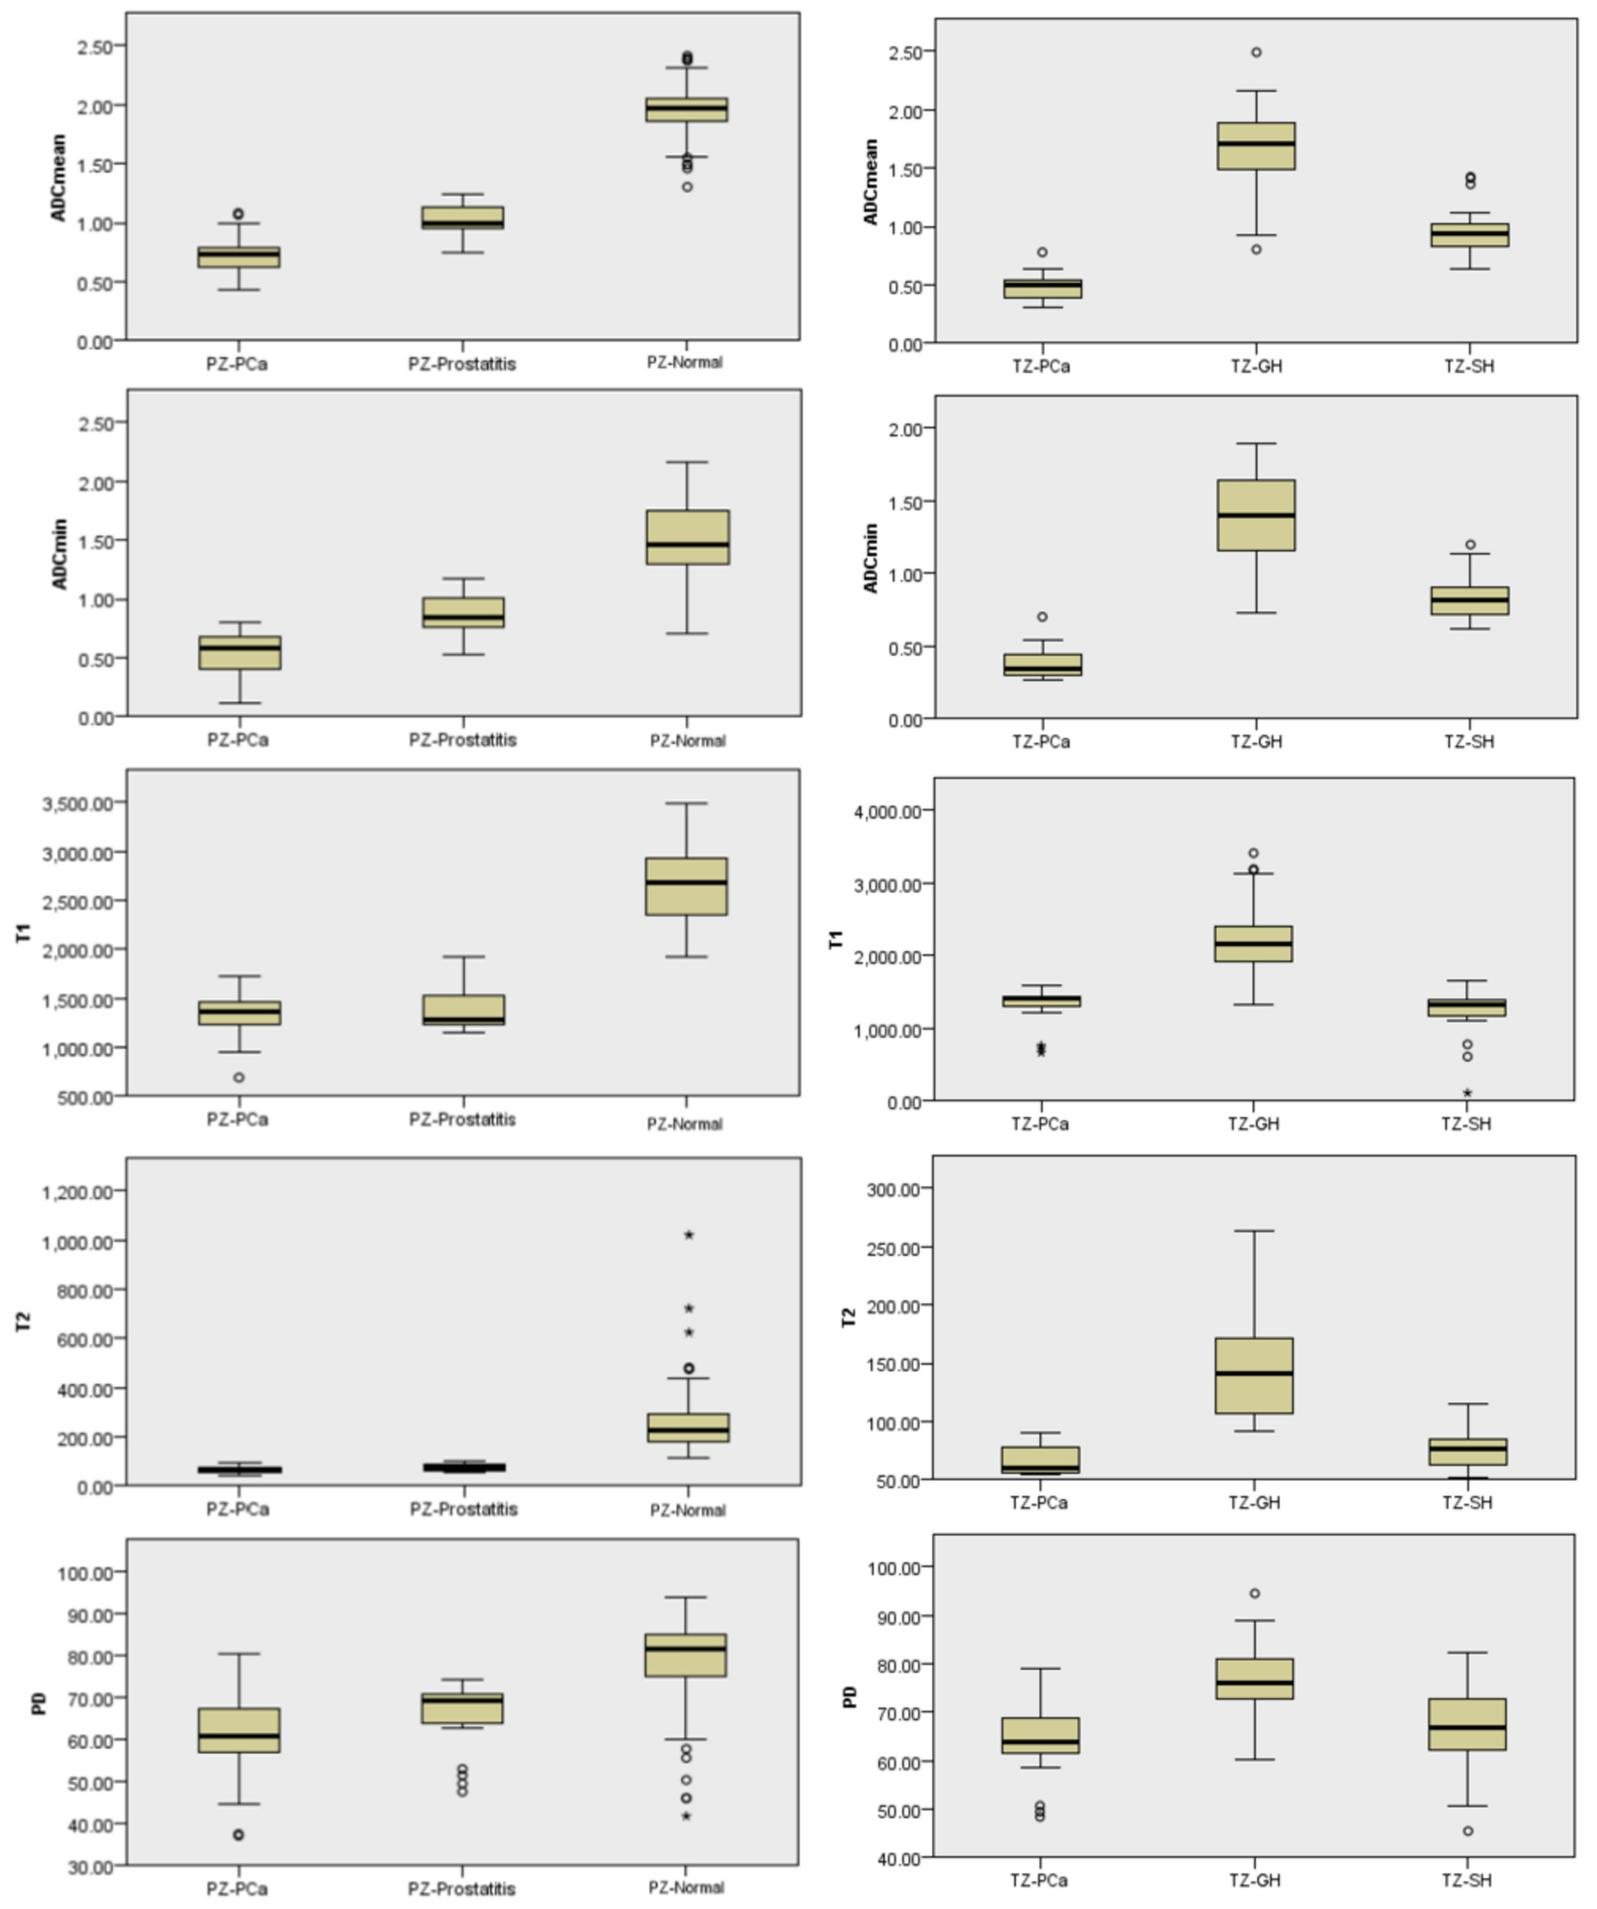
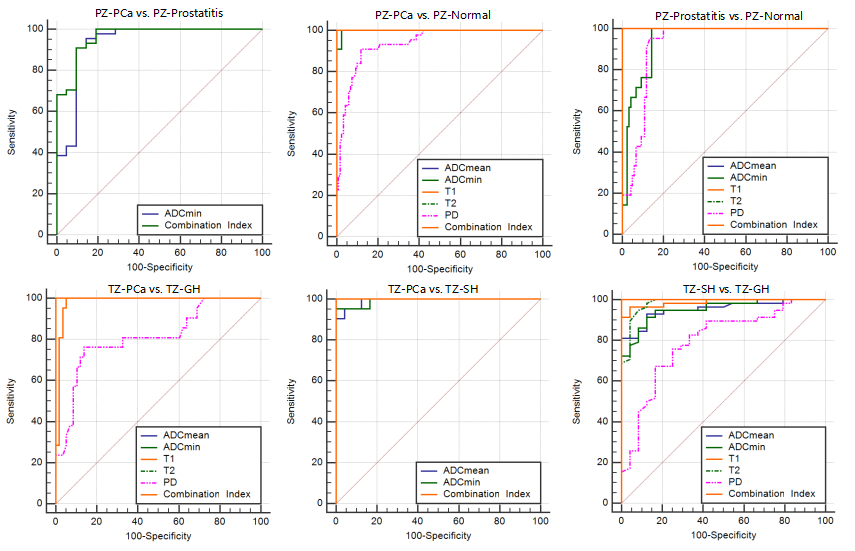
In the peripheral zone lesions, T1, T2, ADCmean, ADCmin and PD values in PCa were lower than those in normal prostate tissue (P < 0.05), the first four values have better AUCs (the area under the curve) than PD value (P < 0.05); the ADCmin of PCa was lower than that of prostatitis (P < 0.05), and none of the other parameters were statistically significant between two groups; T1, T2, ADCmean, ADCmin and PD values in prostatitis were lower than those in normal prostate tissue (P < 0.05), they all have higher AUCs, and the first three values have better AUCs than that of the last two(P < 0.05). In the transitional zone lesions, T2, ADCmean, ADCmin and PD values of PCa were lower than those of GH, and the T1 value of PCa was higher than that of GH (P < 0.05), the first four values have better AUCs than PD value (P < 0.05); ADCmean and ADCmin values of PCa were lower than those of SH (P < 0.05), and both of them have higher AUCs; T1, T2, ADCmean, ADCmin and PD values in SH were lower than those in GH (P < 0.05), the first four values have better AUCs than PD value (P < 0.05). In the comparison of Gleason grade of PCa, ADCmean, ADCmin and T2 values of HG PCa were lower than those of LG PCa, and the T1 value were higher than that of LG PCa (P < 0.05), they all have higher AUCs.Discussion
Our study aims to investigate the diagnostic value of SyMRI in the diagnosis and grading of PCa. ROC curve analysis showed that the diagnostic efficiencies of SyMRI in distinguishing PCa from most benign prostate lesions and different Gleason grades of PCa were similar to that of DWI, the diagnostic efficiencies of SyMRI in distinguishing PCa from prostatitis and SH were not superior to DWI, and the combined index of SyMRI and DWI can obtain higher diagnostic efficiencies. At the same time, SyMRI has the advantages of short scanning time, unified parameters and simple operation. It could become a useful adjunct for MRI diagnosis and grading of PCa.Conclusion
SyMRI is helpful to the diagnosis and grading of PCa, and has the advantages of short scanning time, unified parameters and simple operation. Therefore, it has a good prospect of clinical application.Acknowledgements
No acknowledgement found.References
1. H. Sung, J. Ferlay, R.L. Siegel, M. Laversanne, I. Soerjomataram, A. Jemal, F. Bray, Global cancer statistics 2020: GLOBOCAN estimates of incidence and mortality worldwide for 36 cancers in 185 countries, CA Cancer J Clin. 71 (2021) 209-249, https://doi.org/10.3322/caac.21660.
2. B. Turkbey, A.B. Rosenkrantz, M.A. Haider, A.R. Padhani, G. Villeirs, K.J. Macura, C.M. Tempany, P.L. Choyke, F. Cornud, D.J. Margolis, H.C. Thoeny, S. Verma, J. Barentsz, J.C. Weinreb, Prostate Imaging Reporting and Data System Version 2.1: 2019 Update of Prostate Imaging Reporting and Data System Version 2, Eur Urol. 76(2019) :340-351, https://doi.org/10.1016/j.eururo.2019.02.033.
3. T.T. Stolk, I.J. de Jong, T.C. Kwee, H.B. Luiting, S.V.K Mahesh, B.H.J Doornweerd, P.M. Willemse, D. Yakar, False positives in PIRADS (V2) 3, 4, and 5 lesions: relationship with reader experience and zonal location, Abdom Radiol (NY). 44(2019) :1044-1051, https://doi.org/10.1007/s00261-019-01919-2.
4. F.V. Mertan, M.D. Greer, J.H. Shih, A.K. George, M. Kongnyuy, A. Muthigi, M.J. Merino, B.J. Wood, P.A. Pinto, P.L. Choyke, Prospective Evaluation of the Prostate Imaging Reporting and Data System Version 2 for Prostate Cancer Detection, J Urol. 196 (2016) :690-696, https://doi.org/10.1016/j.juro.2016.04.057.
5. T. Dang, G.Y. Liou, Macrophage Cytokines Enhance Cell Proliferation of Normal Prostate Epithelial Cells through Activation of ERK and Akt, Sci Rep. 8(2018) :7718, https://doi.org/10.1038/s41598-018-26143-8.
6. S.J. Hectors, S. Semaan, C. Song, S. Lewis, G.K. Haines, A. Tewari, A.R. Rastinehad, B. Taouli, Advanced Diffusion-weighted Imaging Modeling for Prostate Cancer Characterization: Correlation with Quantitative Histopathologic Tumor Tissue Composition—A Hypothesis-generating Study, Radiology. 286 (2018) :918-928, https://doi.org/10.1148/radiol.2017170904.
7. N. He, Z. Li, X. Li, W. Dai, J. Liang, Intravoxel Incoherent Motion Diffusion-Weighted Imaging Used to Detect Prostate Cancer and Stratify Tumor Grade: A Meta-Analysis, Front Oncol. 10 (2020) :1623, https://doi.org/10.3389/fonc.2020.01623.
8. Y. Liu, X. Wang, Y. Cui, Y. Jiang, Y. Jiang, L. Yu, M. Liu, W Zhang, K. Shi, J Zhang, C. Zhang, C. Li, M. Chen, Comparative Study of Monoexponential, Intravoxel Incoherent Motion, Kurtosis, and IVIM-Kurtosis Models for the Diagnosis and Aggressiveness Assessment of Prostate Cancer, Front Oncol. 10 (2020) :1763, https://doi.org/10.3389/fonc.2020.01763.
9. J. Mai, M. Abubrig, T. Lehmann, T. Hilbert, E. Weiland, M.O. Grimm, U. Teichgräber, T Franiel, T2 Mapping in Prostate Cancer, Invest Radiol. (2019) :146-152, https://doi.org/10.1097/RLI.0000000000000520.
10. P.J.V. Houdt, H.K. Agarwal, L.D.V. Buuren, S.W.T.P.J. Heijmink, S. Haack, H.G.V.D Poel, F.J. Pos, J.M. Peeters, P.L. Choyke, U.A.V.D. Heide, Performance of a fast and high-resolution multi-echo spin-echo sequence for prostate T2 mapping across multiple systems, Magn Reson Med. 79 (2018) :1586-1594, https://doi.org/10.1002/mrm.26816.
11. M. Raudner, M. Schreiner, T. Hilbert, T. Kober, M. Weber, R. Windhager, S. Trattnig, V. Juras, Accelerated T2 Mapping of the Lumbar Intervertebral Disc: Highly Undersampled K-Space Data for Robust T2 Relaxation Time Measurement in Clinically Feasible Acquisition Times, Invest Radiol. 55 (2020) :695-701, https://doi.org/Invest Radiol.2020V55N11:695-701.
12. J.B.M. Warntjes, O.D. Leinhard, J. West, P. Lundberg, Rapid magnetic resonance quantification on the brain: Optimization for clinical usage, Magn Reson Med. 60 (2008) :320-329, https://doi.org/10.1002/mrm.21635.
13. A. Hagiwara, M. Warntjes, M. Hori, C. Andica, M. Nakazawa, K.K. Kumamaru, O. Abe, S. Aoki, SyMRI of the Brain: Rapid Quantification of Relaxation Rates and Proton Density, With Synthetic MRI, Automatic Brain Segmentation, and Myelin Measurement, Invest Radiol. 52 (2017) :647-657, https://doi.org/10.1097/RLI.0000000000000365.
14. A. Hagiwara, M. Hori, K. Yokoyama, M.Y. Takemura, C. Andica, T. Tabata, K. Kamagata, M. Suzuki, K.K. Kumamaru, M. Nakazawa, N. Takano, H. Kawasaki, N. Hamasaki, A. Kunimatsu, S. Aoki, Synthetic MRI in the Detection of Multiple Sclerosis Plaques, AJNR Am J Neuroradiol. 38 (2017) :257-263, https://doi.org/10.3174/ajnr.A5012.
15. W. Krauss, M. Gunnarsson, M. Nilsson, P. Thunberg, Conventional and synthetic MRI in multiple sclerosis: a comparative study, Eur Radiol. 28 (2018) :1692-1700, https://doi.org/10.1007/s00330-017-5100-9.
16. M. Matsuda, T. Tsuda, E. Rui, W. Toshimori,S. Takeda, K. Okada, K. Nakasuka, Y. Shiraishi, H. Suekuni, Y. Kamei, M. Kurata, R. Kitazawa, T. Mochizuki, T. Kido, Enhanced Masses on Contrast-Enhanced Breast: Differentiation Using a Combination of Dynamic Contrast-Enhanced MRI and Quantitative Evaluation with Synthetic MRI, J Magn Reson Imaging. 53 (2021) :381-391, https://doi.org/10.1002/jmri.27362.
17. Q. Li, Q. Xiao, M. Yang, Q. Chai, Y. Huang, P.Y. Wu, Q. Niu, Y. Gu, Histogram analysis of quantitative parameters from synthetic MRI: Correlations with prognostic factors and molecular subtypes in invasive ductal breast cancer, Eur J Radiol. 139 (2021) :109697, https://doi.org/10.1016/j.ejrad.2021.109697.
18. N.M. Kumar, F. Benjamin, S.E. Stern, W.J.B. Marcel, L.C.Y. Mei, F Jan, Synthetic MRI of the Knee: Phantom Validation and Comparison with Conventional MRI, Radiology. 289 (2018) :465-477, https://doi.org/10.1148/radiol.2018173007.
19. J. Yi, Y.H. Lee, H.T. Song, J.S. Suh, Double-inversion recovery with synthetic magnetic resonance: a pilot study for assessing synovitis of the knee joint compared to contrast-enhanced magnetic resonance imaging, Eur Radiol. 29 (2019) :2573-2580, https://doi.org/10.1007/s00330-018-5800-9.
20. Y. Cui, S. Han, M. Liu. P. Wu. W. Zhang, J. Zhang, C. Li, M. Chen, Diagnosis and Grading of Prostate Cancer by Relaxation Maps From Synthetic MRI, J Magn Reson Imaging. 52 (2020) :552-564, https://doi.org/10.1002/jmri.27075.
21. Y. Arita, T. Takahara, S. Yoshida, T.C. Kwee, S. Yajima, C.Ishii, R. Ishii, S. Okuda, M. Jinzaki, Y. Fujii, Quantitative Assessment of Bone Metastasis in Prostate Cancer Using Synthetic Magnetic Resonance Imaging, Invest Radiol. 54 (2019 ) :638-644, https://doi.org/10.1097/RLI.0000000000000579.
22. J.J. Lee, S. Liu, M.S. Nacif, M. Ugander, J. Han, N. Kawel, C.T. Sibley, P. Kellman, A.E. Arai, D.A. Bluemke, Myocardial T1 and extracellular volume fraction mapping at 3 tesla, J Cardiovasc Magn Reson. 13 (2011) :75, https://doi.org/10.1186/1532-429X-13-75.
23. N. Kawelboehm, M Nacif, A. Zavodni, J. Jones, S. Liu, C.T. Sibley, D.A. Bluemke, T1 mapping of the myocardium: intra-individual assessment of the effect of field strength, cardiac cycle and variation by myocardial region, J Cardiovasc Magn Reson. 14 (2012) :27, https://doi.org/10.1186/1532-429X-14-27.
24. H.J.A Crooijmans, K. Scheffler, O. Bieri, Finite RF pulse correction on DESPOT2, Magn Reson Med. 65 (2011) :858-862, https://doi.org/10.1002/mrm.22661.
25. K.N.A Nagel, M.G. Schouten, T. Hambrock, G.J.S. Litjens, C.M.A. Hoeks, B.T. Haken, J.O. Barentsz, J.J. Futterer, Differentiation of Prostatitis and Prostate Cancer by Using Diffusion-weighted MR Imaging and MR-guided Biopsy at 3 T, Radiology. 267 (2013) :164-172, https://doi.org/10.1148/radiol.12111683.
26. T. Tamada, T. Sone, Y. Jo, A. Yamamoto, K. Ito, Diffusion-weighted MRI and its role in prostate cancer, NMR Biomed. 27 (2014) :25-38, https://doi.org/10.1002/nbm.2956.
27. J.I. Epstein, L. Egevad, M.B. Amin, B. Delahunt, J.R. Srigley, P.A. Humphrey, The 2014 International Society of Urological Pathology (ISUP) Consensus Conference on Gleason Grading of Prostatic Carcinoma: Definition of Grading Patterns and Proposal for a New Grading System, Am J Surg Pathol. 40 (2016) :244-252, https://doi.org/10.1097/PAS.0000000000000530.
28. S. Mirinae, R.J. Kyu, J. Geon-Ho, S. Yu-Mee, R.S. Jung, O. Jang-Hoon, W, Kyu-Yeoun, Estimation of T2* Relaxation Time of Breast Cancer: Correlation with Clinical, Imaging and Pathological Features, Korean J Radiol. 18 (2017) :238-248, https://doi.org/10.3348/kjr.2017.18.1.238.
29. L. Liu, B. Yin, K. Shek, D. Geng, Y. Lu, J. Wen, X. Kuai, W. Peng, Role of quantitative analysis of T2 relaxation time in differentiating benign from malignant breast lesions. J Int Med Res. 46 (2018) :1928-1935, https://doi.org/10.1177/0300060517721071.
30. R. Renard Penna, G. Cancel-Tassin, E. Comperat, P. Mozer, P. Léon, J. Varinot, M. Roupret, M.O. Bitker, O. Lucidarme, O. Cussenot, Apparent diffusion coefficient value is a strong predictor of unsuspected aggressiveness of prostate cancer before radical prostatectomy, World J Urol. 34 (2016) :1389-1395, https://doi.org/10.1007/s00345-016-1789-3.
31. I. Jambor, M. Pesola, H. Merisaari, P. Taimen, P.J. Boström, T. Liimatainen, H.J. Aronen, Relaxation along fictitious field, diffusion-weighted imaging, and T2 mapping of prostate cancer: Prediction of cancer aggressiveness, Magn Reson Med. 75 (2016) :2130-2140, https://doi.org/10.1002/mrm.25808.
32. W. Liu, X.H. Liu, W. Tang, H.B. Gao, B.N. Zhou, L.P. Zhou, Histogram analysis of stretched-exponential and monoexponential diffusion-weighted imaging models for distinguishing low and intermediate/high gleason scores in prostate carcinoma, J Magn Reson Imaging. 48(2018) :491-498, https://doi.org/10.1002/jmri.25958.
33. A.M. Betts, J.L. Leach, B.V. Jones, B. Zhang, S. Serai,Brain imaging with synthetic MR in children: clinical quality assessment, Neuroradiology, 58 (2016) :1017-1026, https://doi.org/10.1007/s00234-016-1723-9.
34. S.M. Lee, Y.H. Choi, J.E. Cheon, I.O. Kim, S.H. Cho, W.H. Kim, H.J. Kim, H.H. Cho, S.K. You, S.H. Park, M.J. Hwang, Image quality at synthetic brain magnetic resonance imaging in children, Pediatr Radiol. 47 (2017) :1638-1647, https://doi.org/10.1007/s00247-017-3913-y.
Figures