3203
Improved Parallelized Blind MR Image Denoising using Asymmetric Weighting coefficients1Utsunomiya university, Utsunomiya, Japan
Synopsis
Parallelized blind image denoising (ParBID) is an improved CNN based denoising method in which weighted average of slice images are denoised using blind denoising CNN followed by image separation. To further improve the denoising performances, weighting coefficients (wc) of slice image averaging was examined. Negative value wc resulted in a significant change in the noise distribution, resulting in a change in the noise distribution and consequently changes the degree of noise reduction. Experimental studies showed that the PSNR was improved compared to the previous method using positive value wc at all noise levels.
Introduction
A new improved CNN based denoising method was proposed in the last year ISMRM1 in which weighted average of slice images are denoised using blind denoising CNN (BDnCNN)2 followed by image separation using the inverse matrix calculation. To further improve the denoising performances, we studied a new denoising scheme in which negative weighting coefficients are used that have the effects of inversion of noise distribution of corresponding slice and varying the noise reduction effects of summed image. Proposed scheme was compared with previous proposed method using positive-weighting coefficients.Method
Figure 1 illustrates the scheme of the parallelized blind image denoising (hereafter ParBID). The first step is the weighting average of slice images with given weight values. Let the k-th slice image be $$$r_k =\rho_k +\delta_k $$$ where $$$\rho_k $$$ is a noise-free image, and $$$\delta_k $$$ is the noise, then weighted average of slice images $$$i_s$$$ are written as follows:$$i_s = \sum_{k} a_{s,k} r_k, … (1) $$
where $$$a_{s,k}$$$ mean weighting coefficients (hereafter wc). Equation (1) can be written as:
$${\bf I^T= A R^T}, … (2) $$
where $$${\bf R} =(r_1, r_2,..., r_n)$$$, $$${\bf I}=(i_1, i_2,..., i_m) $$$. The second step is blind denoising of the summed images, $$$d_s={\rm DnCNNB}(i_s)$$$ where BDnCNN refers to Blind DnCNN operation2, and $$$d_s$$$ indicates the denoised image. The third step is the separation of weighted averaged images by solving generalized inverse problem:
$${\bf P^T= (\bf A^{T} \bf A)^{-1} \bf A^{T} \bf D^{T}}, ... (3)$$
where $$${\bf P} =(p_1, p_2, ..p_n)$$$ and $$${\rm \bf D} =(d_1, d_2, ..d_m)$$$. Image sequence $$$(p_1, p_2, ..p_n)$$$ is the output of ParBID. When negative value wc are used as shown in Fig.2(g) or (h), noise on the image $$$r_1 $$$ is inverted in calculating $$$ -0.3 r_1+1.3 r_2 $$$. Since the distribution of the noise on the summed image i2 (Fig(g)) is completely different from that of the additive summed image $$$i_1$$$ (Fig(e)), the degree of noise reduction in $$$i_2$$$ by blind DnCNN will be different from that of in $$$i_1$$$.
Let the noises on $$$r_1$$$ and $$$ r_2$$$ be $$$n_1$$$ and $$$n_2$$$ and noise reduction factor by BDnCNN be $$$\alpha_1$$$ and $$$\alpha_2$$$, respectively in 2-slice ParBID ($$$\alpha_1, \alpha_2 < 1$$$), the noise on the image $$$d_1, d_2$$$ are $$$\alpha_1(0.7 n_1+0.3 n_2), \alpha_2(-0.3 n_1+1.3 n_2) $$$ and noises on the separated image on $$$p_1 $$$ is calculated as $$$(0.91 \alpha_1+0.09 \alpha_2 ) n_1+0.39(\alpha_1-\alpha_2) n_2 $$$. Generally, denoising of lower S/N image will bring strong denoising effects; i.e. $$$\alpha_2 <\alpha_1 $$$, therefore $$$(0.91 \alpha_1+0.09 \alpha_2 ) n_1 $$$ is smaller than $$$\alpha_1 n_1 $$$ which is the remained noise on $$$p_1 $$$ in ParBID with positive wc. As indicated from a simple estimate, negative wc improve the noise reduction effect.
Generally, denoising of lower S/N image will bring image degradation, however the image (g) is a difference image between $$$r_1$$$ and $$$r_2$$$ and is a kind of edge enhanced image, edges are well remained and therefore image degradation will be suppressed, resulting in improved PSNR of resolved image (m).
Results & Discussions
In 2-slice ParBID, circulant matrix {{0.6,0.4},{0.4,0.6}} was used in previous method1, whereas asymmetric matrix $$$A_2$$$= {{0.7,0.3},{-0.3,1.3}} was used in this study. The determinant of $$$A_2$$$ is 1 and its inverse matrix is {{1.3,-0.3},{0.3,0.7}}. In the 3-slice ParBID, circulant matrix {{0.5,0.3,0.2},{0.2,0.5,0.3},{0.3,0.2,0.5}} was used in previous studies. In our study, examination were done using $$$A_3$$$={{0.3,-0.8,1.0},{0.2,0.6,0.2},{1.0,-0.8,0.3}} which coefficients were determined by preliminary study. Figure 3(a),(b),(c) show the relationship between PSNR and the number of images used for ParBID with $$$A_3$$$ for noise level 2.5%, 5.0% and 7.5%, respectively. The size of images and slice spacing were 256×256 pixels, 1.2 mm. Results show that the improvement of PSNR using circulant wc matrix (hereafter circ) were small when SN was low in 3-slice ParBID. In contrast, proposed method using asymmetric (hereafter asym) wc matrix show significant increase. It should be noted that improvement of PSNR was obtained only in $$$p_1$$$ in 2-slice ParBID and $$$p_2$$$ in 3-slice ParBID using asymmetric wc.Figure 3 also shows that 2- and 3-slice parallelized image denoising were also effective for WNNM.
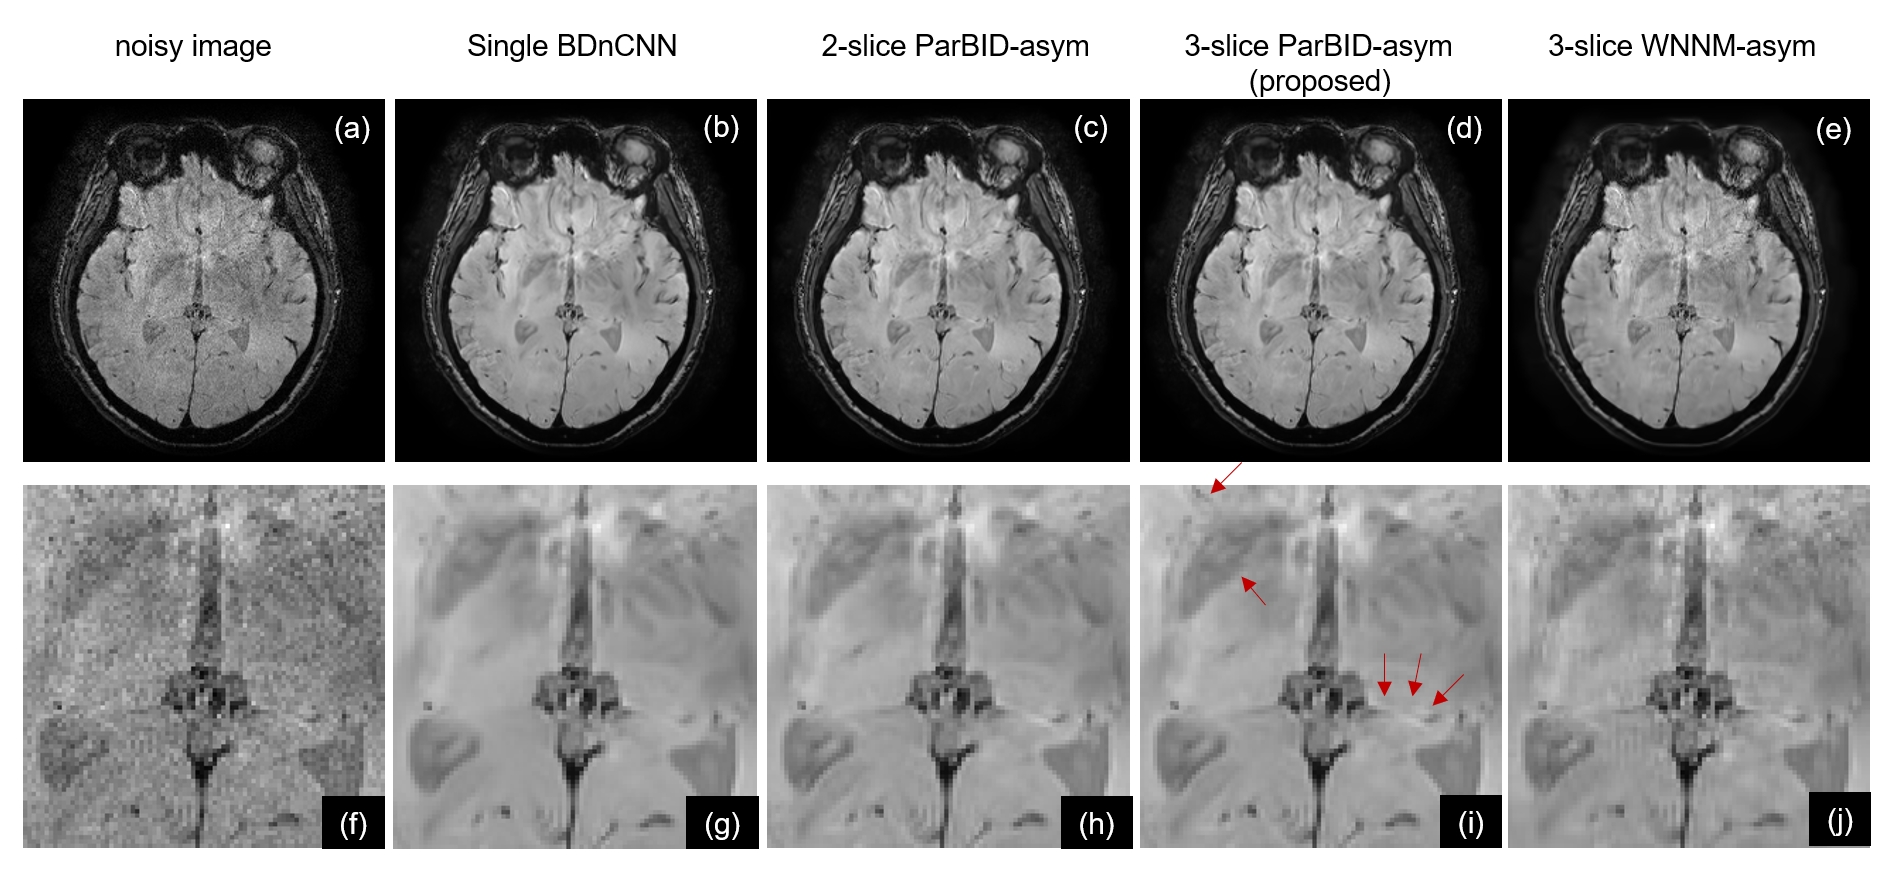
Examples of 5.0% noise level are shown in Fig.4. Denoised images in Single BDnCNN, 2-slice ParBID, 3-slice ParBID using circ and asym wc are shown. As shown in the region pointed by arrows in Fig.(r), fine linear structures were well preserved in proposed 3-slice ParBID-asym. In addition, 3-slice ParBID has excellent weak contrast preservation. Application of ParBID to an experimentally obtained MR image (256×256, slice spacing 1.2 mm) is shown in Fig.5. Subimage (a) is the target noisy image, (b) through (e) are denoised image by single slice BDnCNN, 2-slice ParBID-asym, and 3-slice ParBID-asym and 3-slice WNNM-asym respectively. Denoised images (d) and (i) obtained by 3-slice ParBID clearly retain image contrast, as shown in the region indicated by arrows. These images indicate that details of images are preserved to a much higher degree in 3-slice ParBID.
Conclusion
Asymmetric weighting coefficients that contain negative value can further improve the denoising performance of the parallelized blind image denoising.Acknowledgements
This study was supported in part by JSPS KAKENHI(19K04423) and the Kayamori Foundation of Informational Science Advancement. We would like to thank Canon Medical Systems.References
- S. Ito, et al., Parallelized Blind MR Image Denoising using Deep Convolutional Neural Network., ISMRM2021, 2628, Vancouver, Canada, 2021.
- Zhang K, Zuo et al. Beyond a Gaussian Denoiser: Residual Learning of Deep CNN for Image Denoising. IEEE Trans. Image Processing 2017; 26: 3142-3155.
- Gu S et al. Weighted Nuclear Norm Minimization and Its Applications to Low Level Vision. International Journal of Computer Vision 2017; 121: 183-208.
Figures
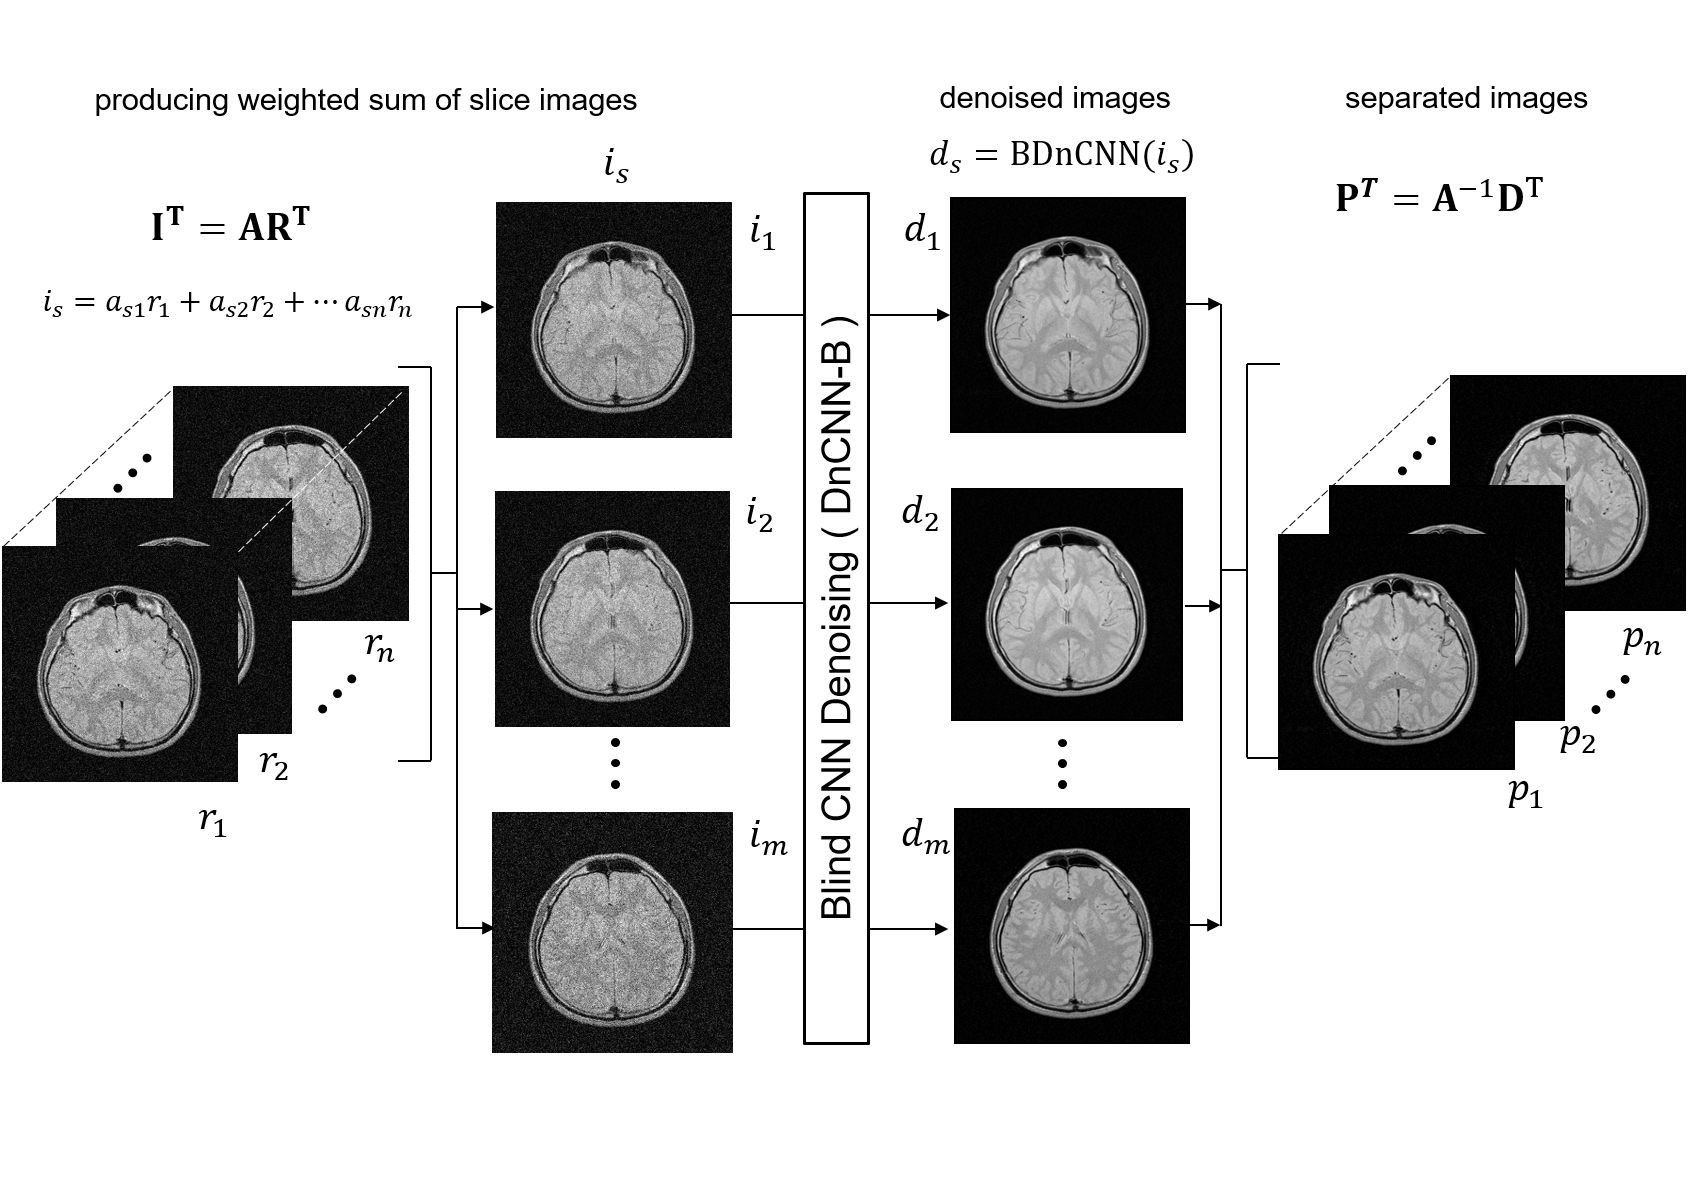
Figure 1. Schematic of parallelized blind image denoising (ParBID).
The first step is calculating the weighting sum of slice images with given weights $$$a$$$. The second step is the blind DnCNN of the summed images. The third step is the separation of summed images by solving simultaneous equations.
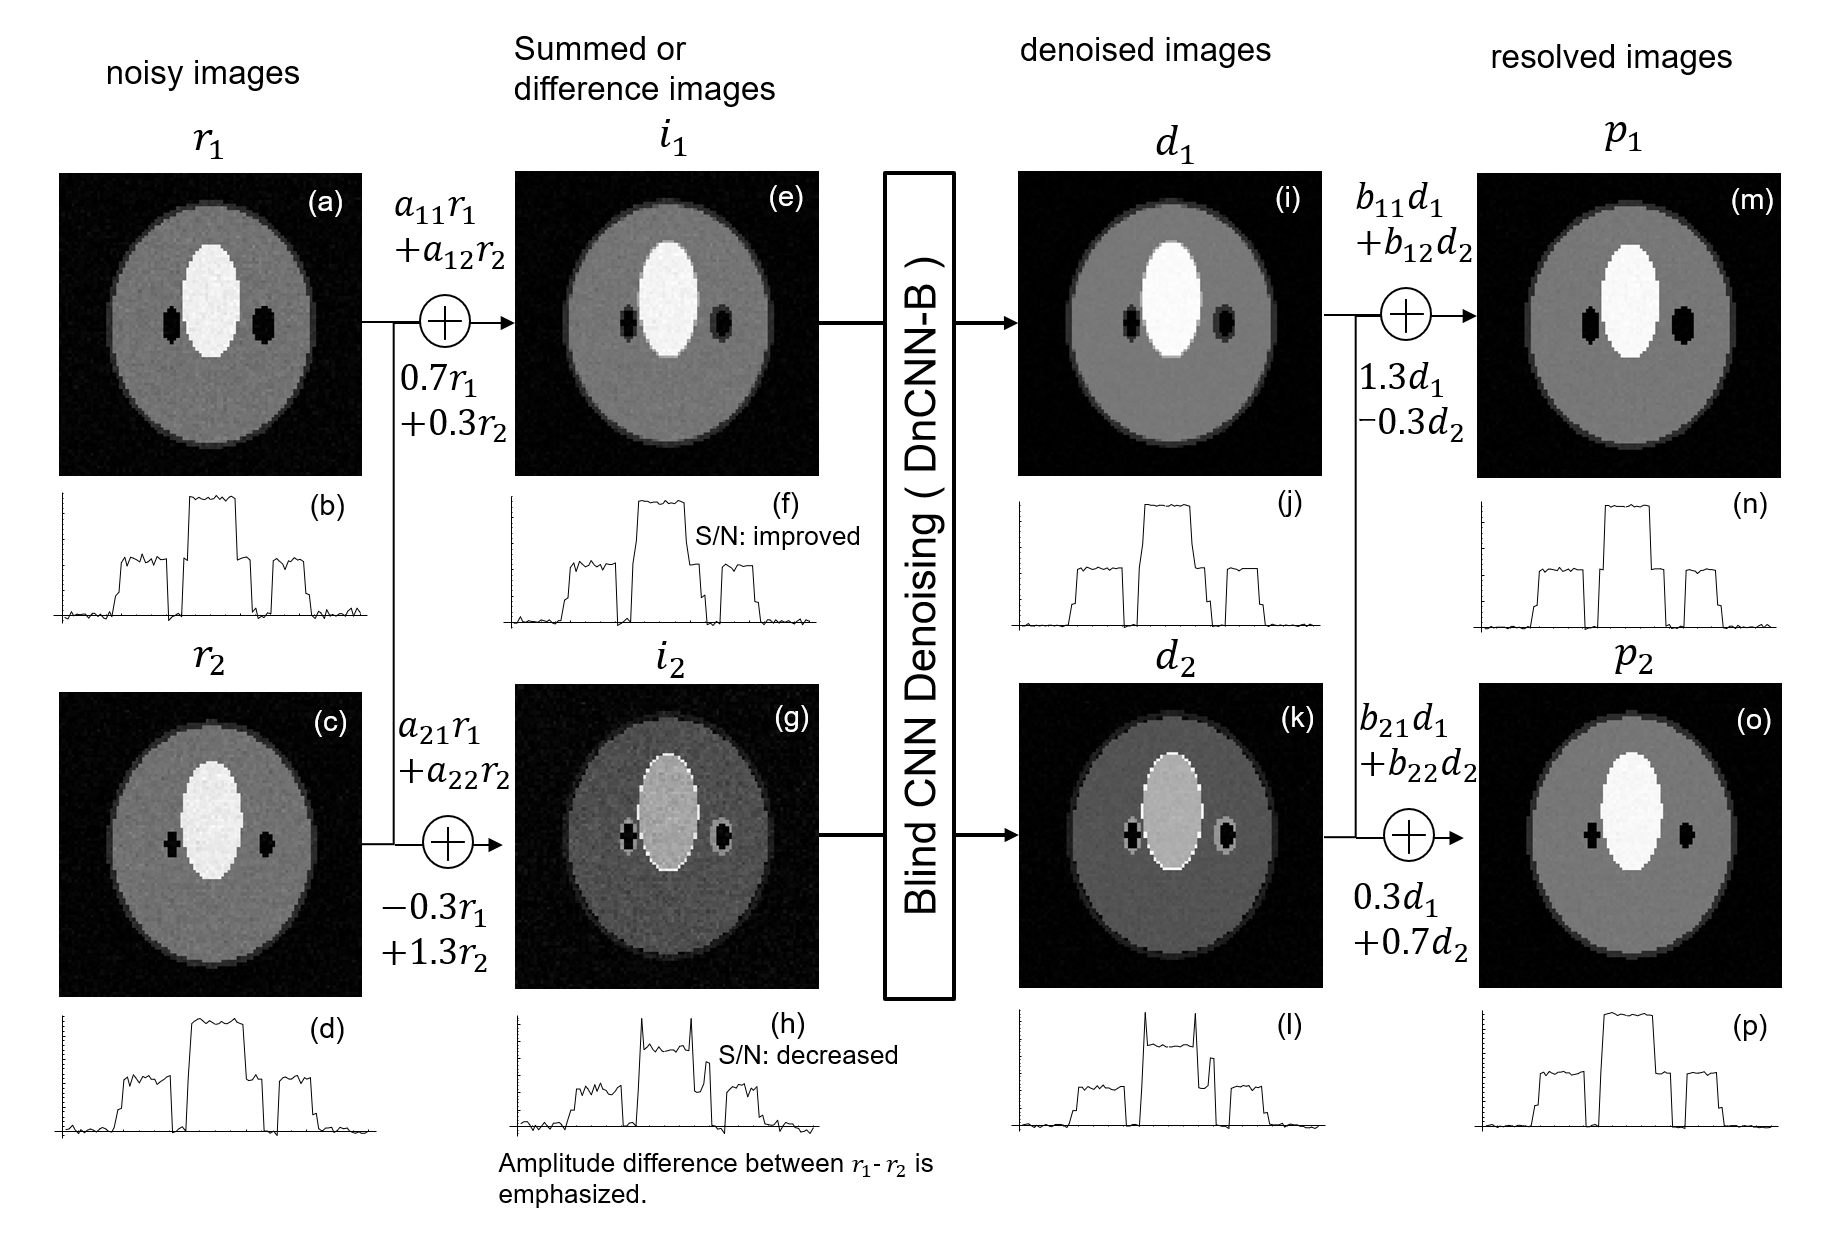
Figure 2. Process flow of ParBID using negative weighting coefficients.
When negative value wc are used, noise on the image r1 is inverted. Since the distribution of the noise on the summed image i2 is completely different from that of i1, the degree of noise reduction in i2 by blind DnCNN will be different from that in i1. Generally, denoising of lower S/N image will bring image degradation, however the image (g) is a difference image between r1 and r2 and is a kind of edge enhanced image, edges are well remained and therefore image degradation will be suppressed, resulting in improved PSNR.
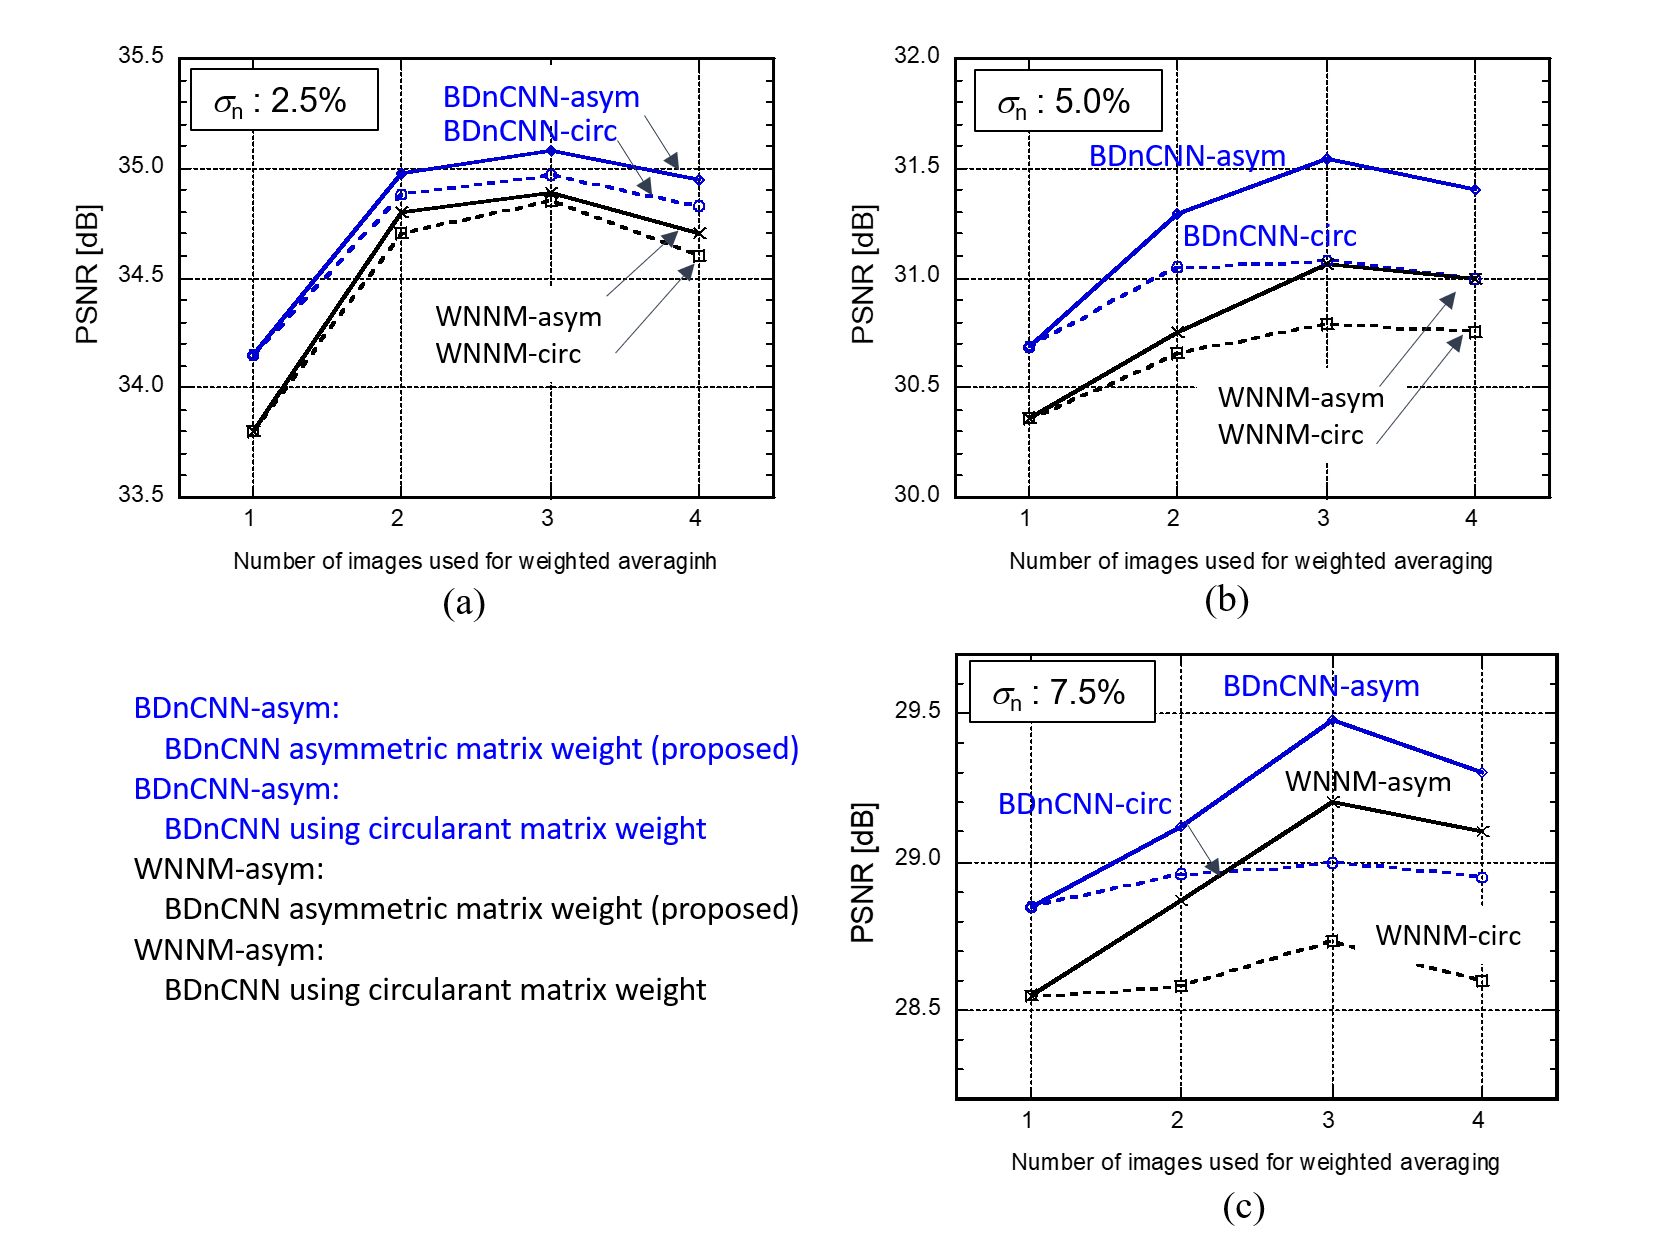
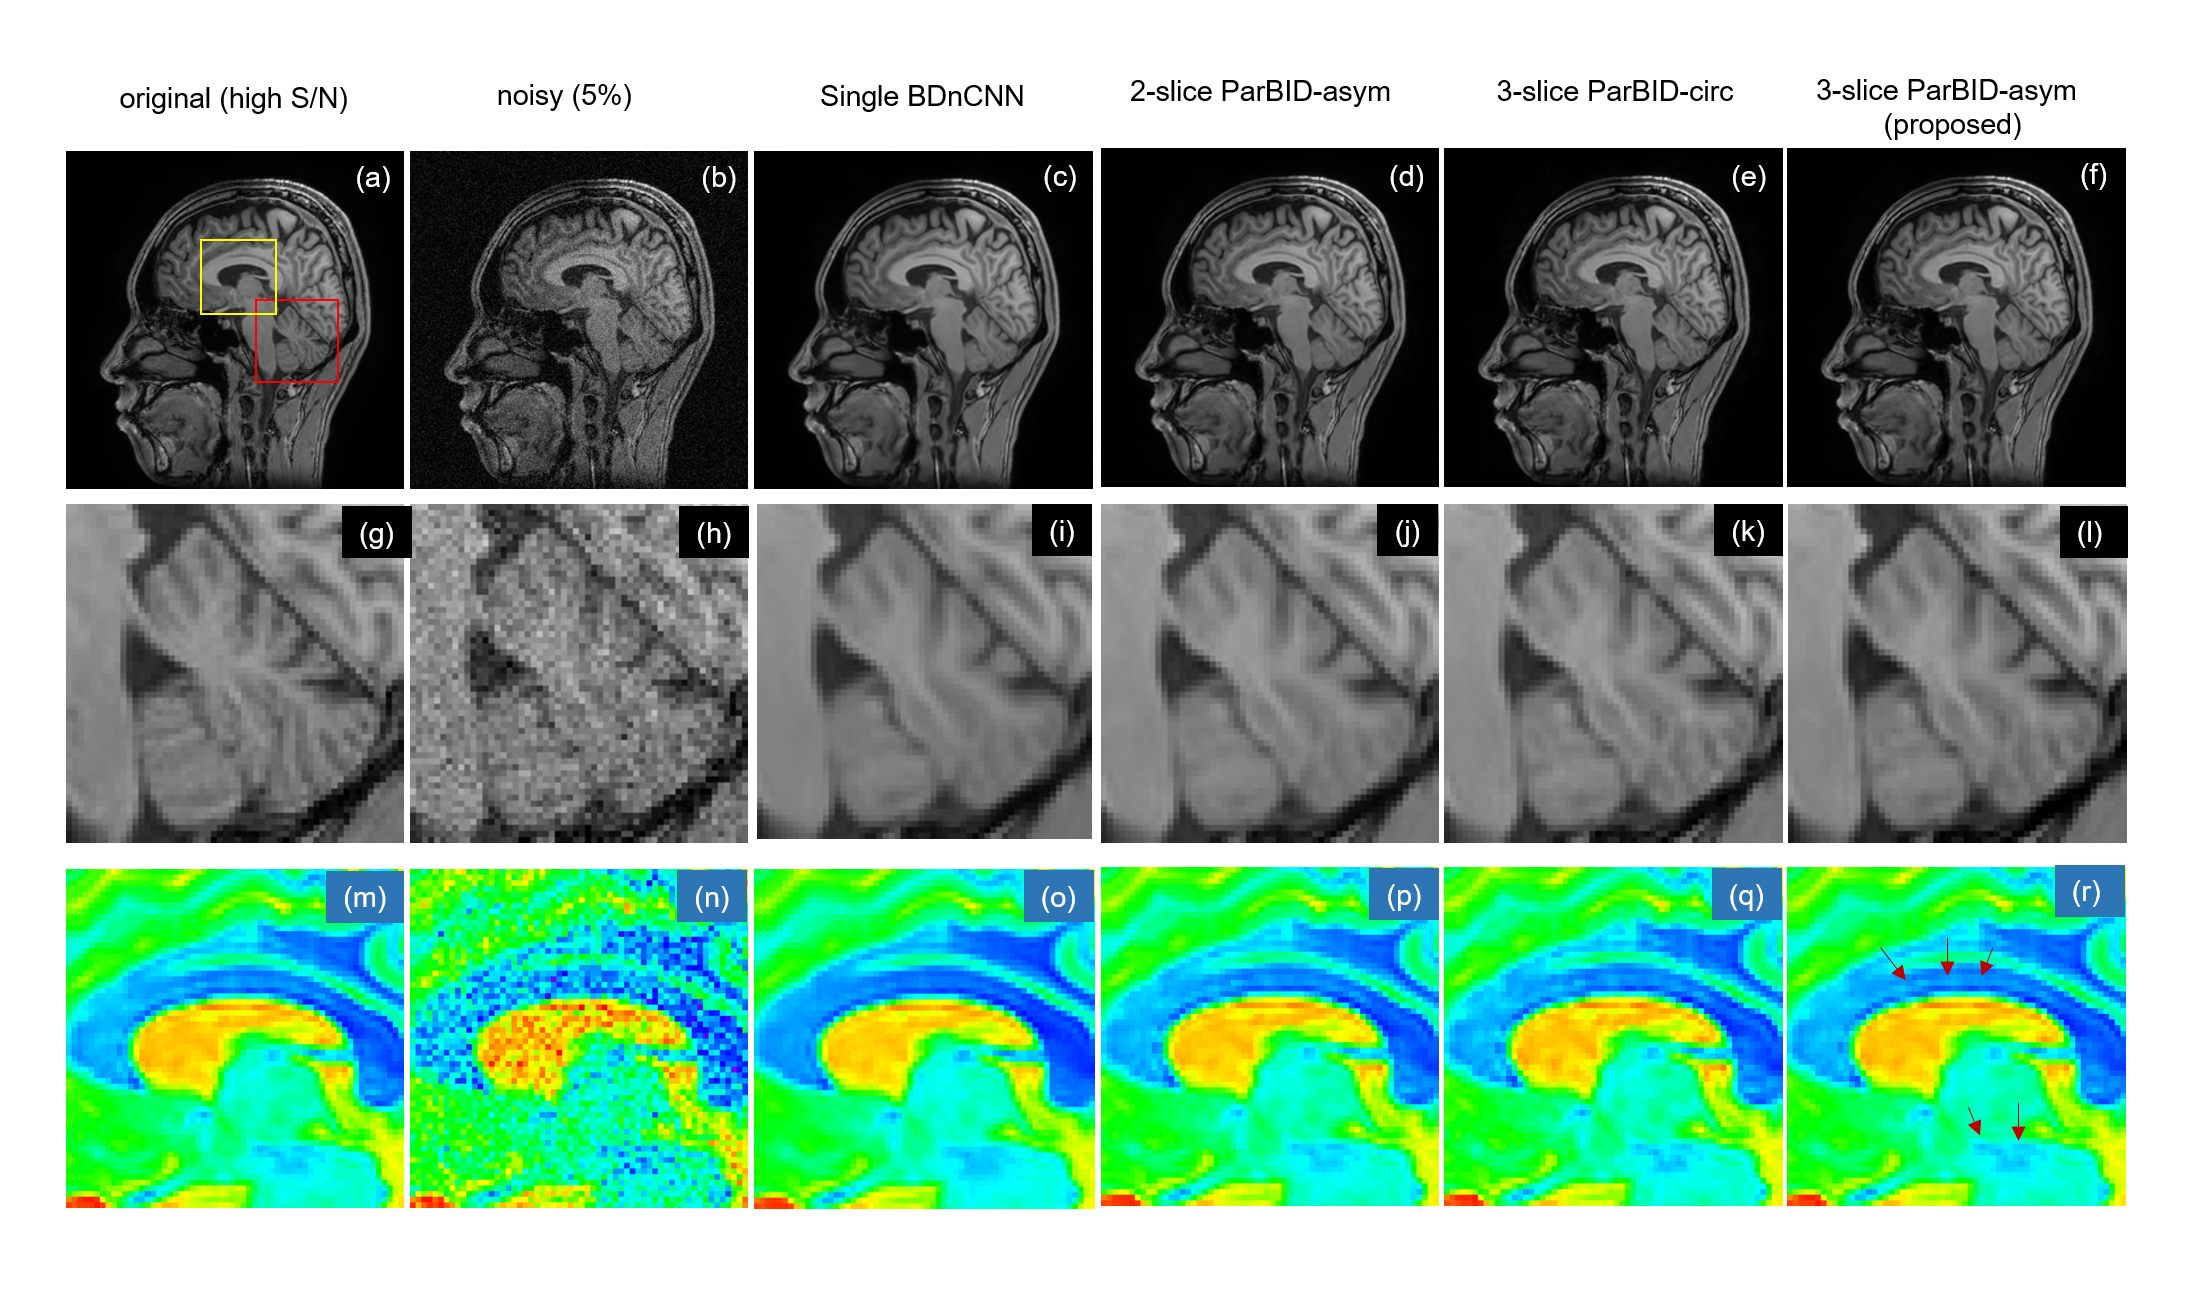
Figure 4. Denoised image with ParBID .
Original high S/N image is shown in (a), and 5% noisy image is (b). Subimages (c) through (f) are the denoised images using single-slice BDnCNN and the 2-slice ParBID-asym, 3-slice ParBID-circ and 3-slice ParBID-asym. Subimages (g) through (l) and (m) through (r) are the enlarged images.