3195
Use delta-radiomics based on T2-TSE-BLADE MRI images to predict histopathological tumor regression grade in Locally Advanced Esophageal Cancer1Shanghai Key Laboratory of Magnetic Resonance, East China Normal University, Shanghai, China, 2Department of Radiology, The Affiliated Cancer Hospital of Zhengzhou University &Henan Cancer Hospital, Zhengzhou, China, 3MR Scientific Marketing, Siemens Healthineers, Shanghai, China
Synopsis
Histopathological tumor regression grade (TRG) has shown to be an important consideration for the choice of treatment plan in patients with esophagus cancer. Patients with same TNM stage may have different sensitivities to neoadjuvant chemotherapy (NAC). In this study, we proposed a new model to predict TRG grades by using the differences between radiomics features extracted from T2-TSE-BLADE images within 1 week before NAC and 3 to 4 weeks after NAC, but before surgery. This study enrolled 108 patients with esophageal cancer and underwent the mentioned MRI scans. In the test cohort, the proposed model achieved an AUC of 0.842.
Introduction
Histopathological tumor regression grade (TRG) is an important factor for prognostic assessment for patients with esophageal cancer (EC) after neoadjuvant chemotherapy (NAC)1. While patients with same TNM stage may have different reactions to NAC, TRG is able to reflect the sensitivity of EC patients to chemotherapy. Thus, it has great significance for clinical treatment planning to obtain TRG grades of patients from MRI images directly. Our goal is to identify TRG grades by modeling the radiomics features obtained from the MRI images.Methods
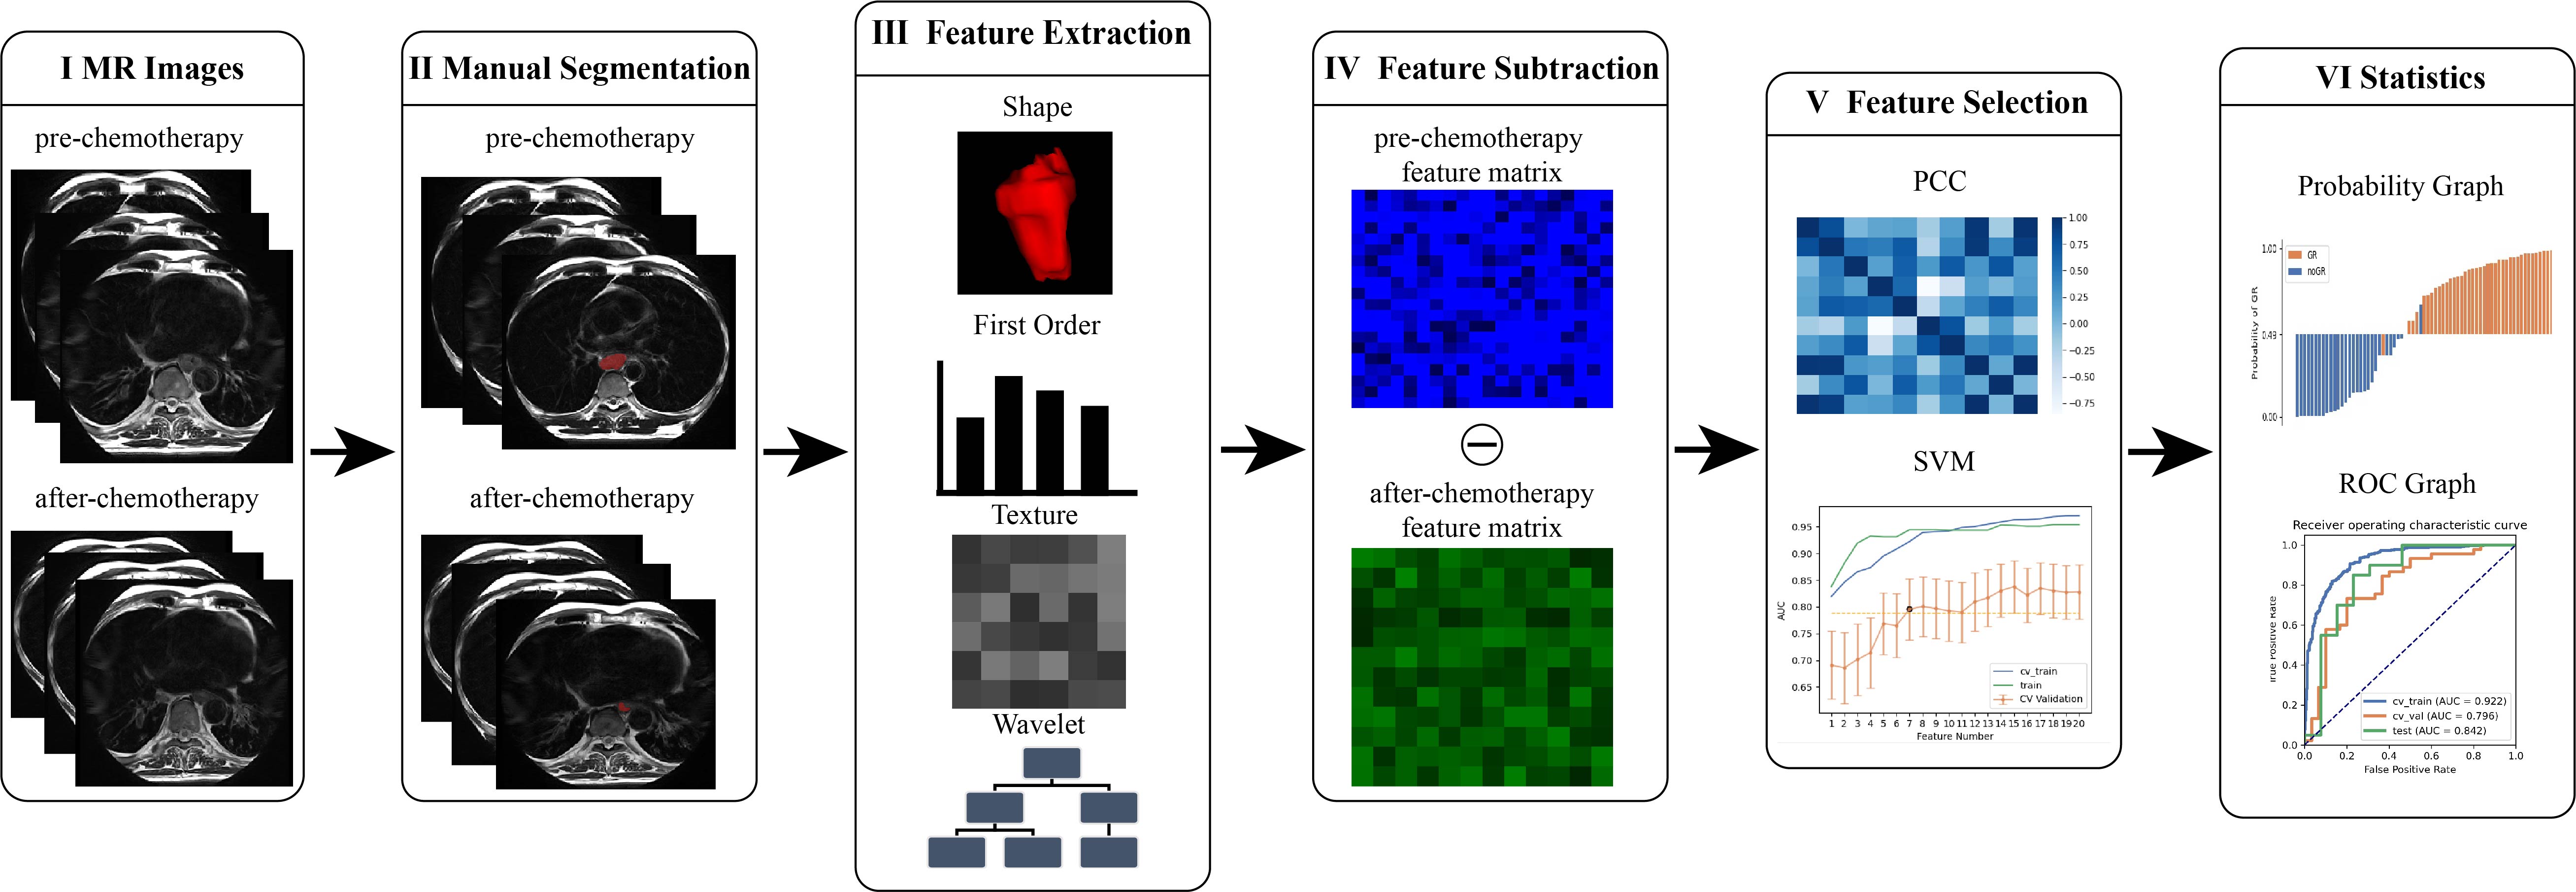
A total number of 108 EC patients who have underwent NAC from Henan Cancer Hospital were included in this study. Each patient underwent MR scanning twice within 1 week (median 3 days) ahead of NAC and 3 to 4 weeks (median 21 days) after NAC, but prior to surgery. All MR images were performed on a 3T MR scanner (MAGNETOM Skyra, Siemens Healthcare). The sequences were as follows: Axial T2-TSE-BALDE performed with breath-holding; slice thickness = 3 mm, TR = 5715.5 ms, TE = 96.0 ms, matrix = 256×256, FOV = 240 mm×240 mm. TRG grades of 1 and 2 were considered as poor responders (noGR), while 3 and 4 as good responders (GR). We randomly split dataset into training (n = 75, positive/negative = 45/30) and testing (n = 33, positive/negative = 20/13) cohort at a ratio of 7:3.The workflow of the whole pipeline is shown in Figure 1. Firstly, regions of interest (ROIs) were manually delineated slice by slice on MRI images before and after NAC by two radiologists with five years of experience and then reviewed and modified if necessary by a radiologist with fifteen years of experience in MRI diagnosis. Next, we extracted radiomics features from each region of interest (ROI) with PyRadiomics2. A total number of 851 features were extracted from original image and the wavelet-transformed image. Then we subtracted the feature matrix extracted from before and after NAC to obtain the delta feature matrix for the study. Finally, we used the differential radiomics features to construct the model and analyze the results.
The details of modeling steps can be summarized as follow: 1) upsampling was applied to negative cases in the training cohort to remove the unbalance in the training cohort; 2) feature normalization was done by subtracting the mean value of the vector and dividing by the length of it; 3) feature reduction was done by randomly removing a feature from each pair of strongly correlated features whose Pearson correlation coefficient (PCC) was higher than 0.993; 4) we used RFE with supported vector machine (SVM) to select the candidate features then we used logical regression with LASSO constraints on the selected features to develop the final model. The number of features and the penalty weights were determined by cross-validation with the training cohort. All of the above processes were implemented using an open-source software FeatureExplorer4. Receiver operating characteristic (ROC)5 curve and Area under curve (AUC) were used to evaluate the performance of the models. To find the best value of number of features, we used 10-fold cross validation on the training cohort. The cross-validation AUC was plotted against number of the retained features and the number with the highest cross-validation AUC was used for the model. In order to find the simplest model and avoid overfitting, we also use 1-SE (one-standard error) criterion which selecting the model with the least number of features within one standard deviation of the best model.
The above approach was also used to build radiomics models using only the pre-chemotherapy (Pre-model) or post-chemotherapy (Post-model) features to illustrate the effectiveness of delta radiomics.
Results
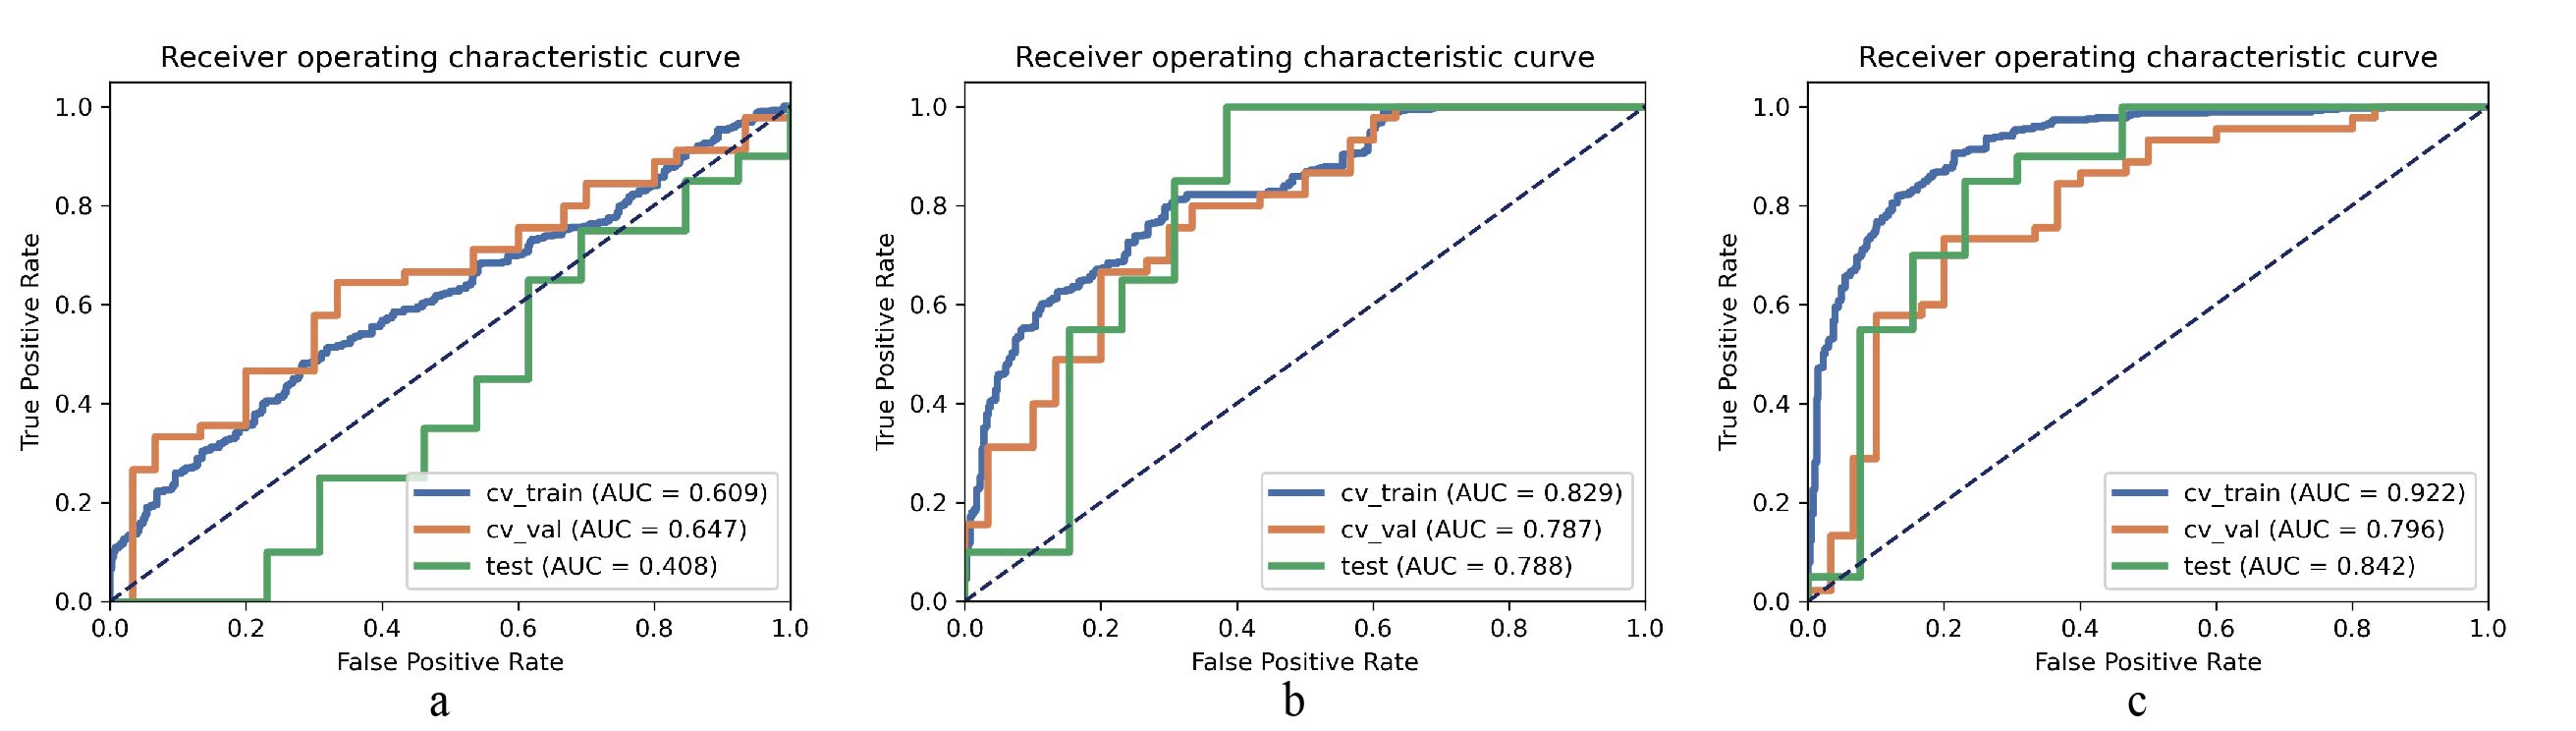
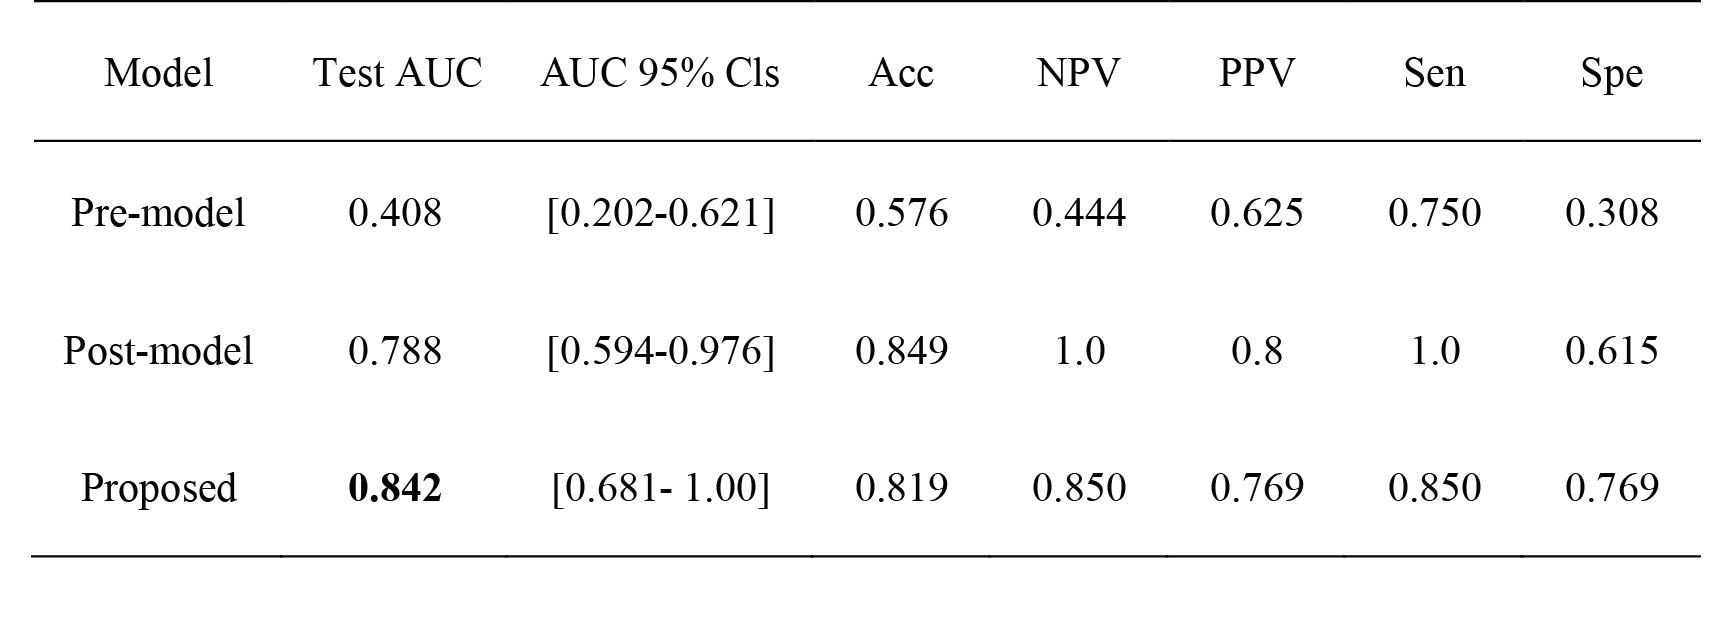
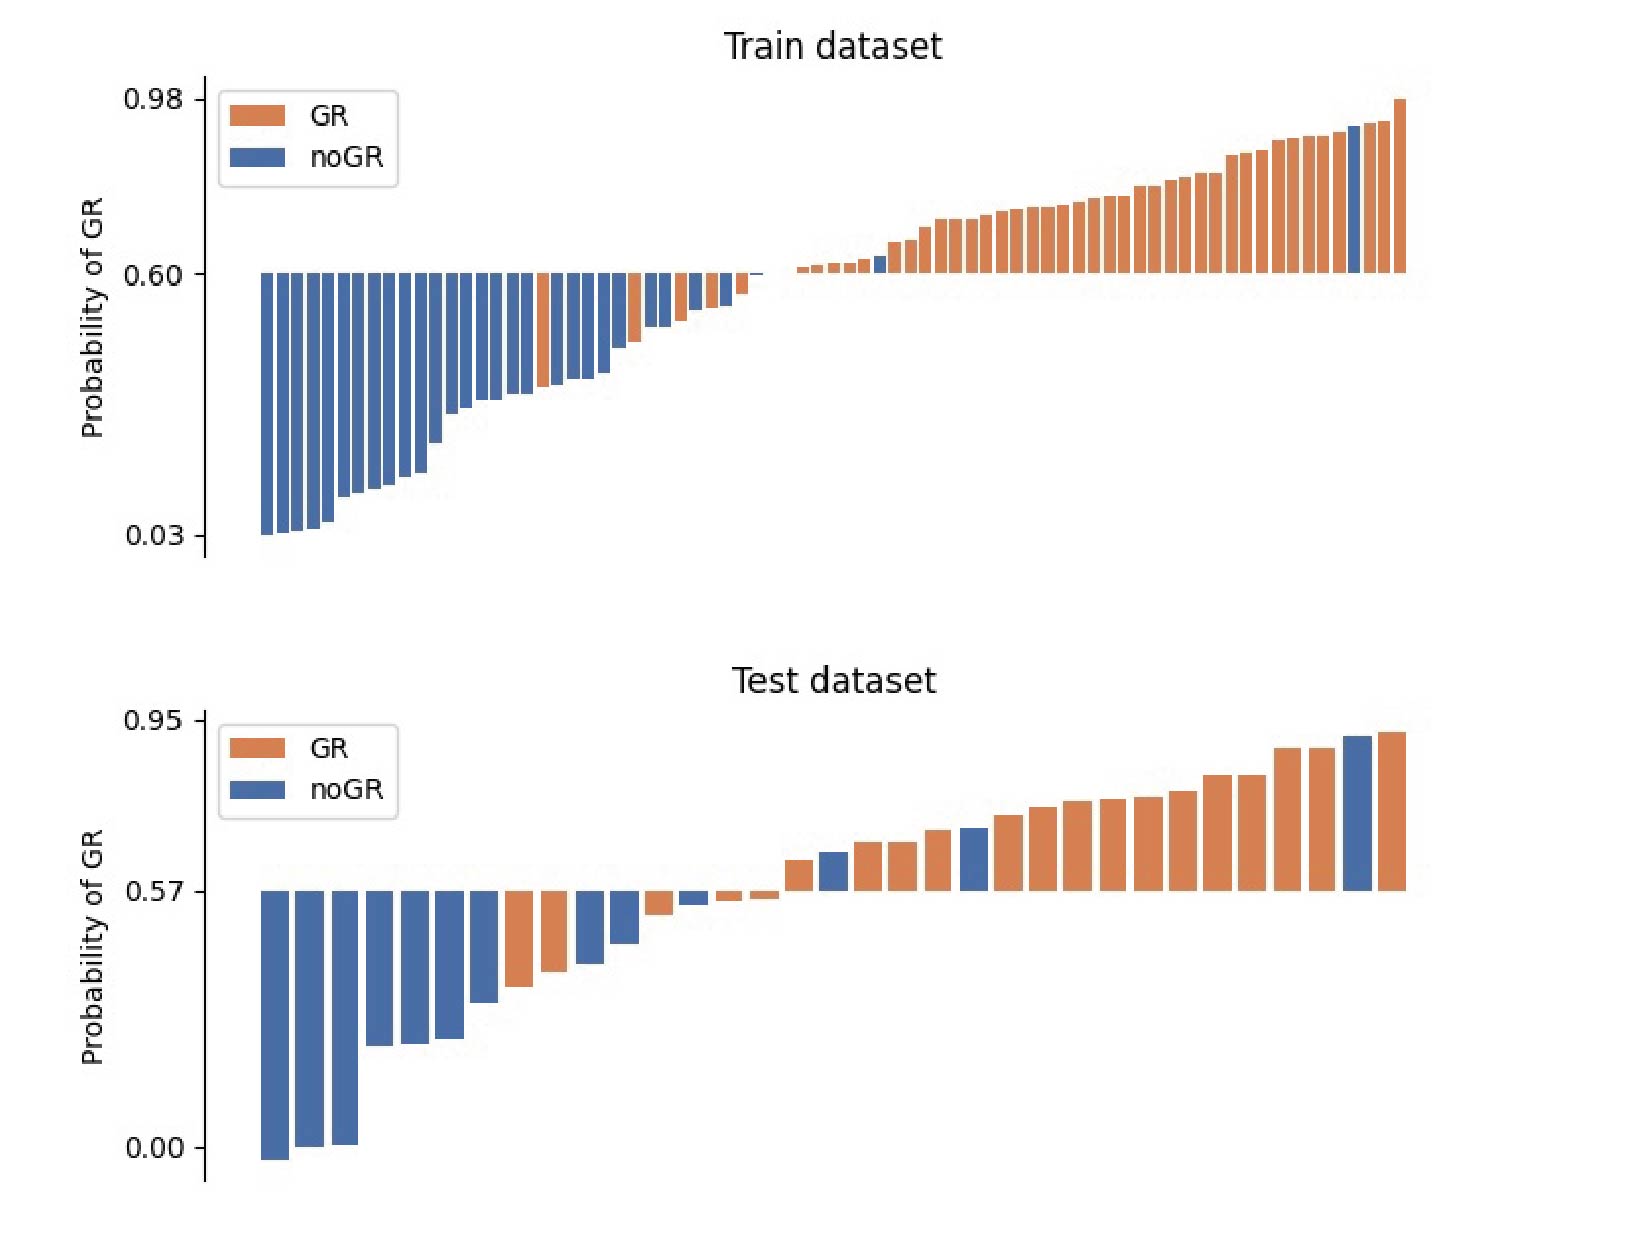
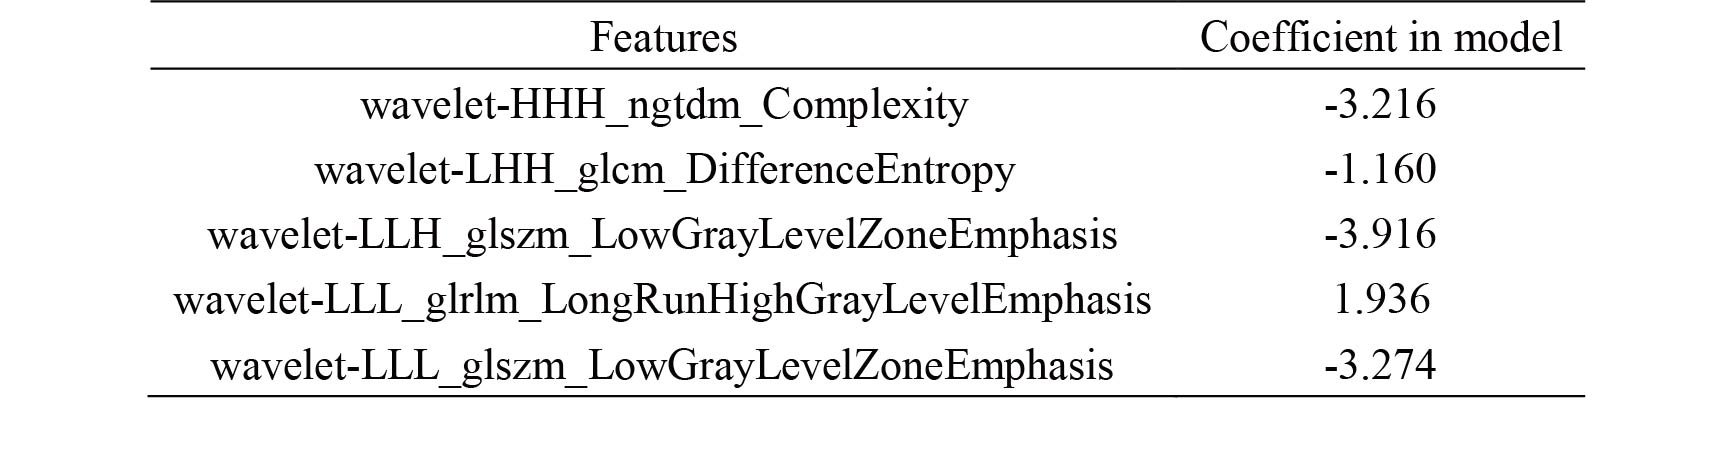
The performance of three models were shown in Figure 2. The delta radiomics model achieved an AUC of 0.84 on the test cohort, and significantly outperformed the models with only pre-chemotherapy or post-chemotherapy features. Statistical metrics including accuracy, negative predictive value (NPV), positive predictive value (PPV), sensitivity and specificity were listed in Figure 3. The 95% confidence interval (CI) was derived by a non-parametric bootstrap method with 1000 samples6. The predictive probability of GR for each patient in the training and test cohort was showed in Figure 4. It demonstrates that the proposed method is able to achieve satisfying performance in TRG prediction. The selected features in final model was shown in Figure 5.Discussion and Conclusion
Compared with the pre-model and post-model, the delta radiomics model method obtained better performance, demonstrating that TRG grades can be better determined from change of MRI image features before and after NAC. This work implies that it is possible to use radiomics based on MRI images to assess TRG grade and help clinicians to choose better treatment plan for EC patients. Due to the limitation of data number, and also to overcome the problem of data imbalance, we performed binary classification of TRG grades. To make our study more instructive, more data can be collected across multiple institutions to validate the effectiveness of the proposed approach and produce more detailed, more precise TRG grades in the future.Acknowledgements
Part of this work is sponsored by Shanghai Pujiang Program (Grant No. 2020PJD016) and China Postdoctoral Science Foundation (Grant No. 2021M691038)References
1. Hermann, R.M., et al., Histomorphological tumor regression grading of esophageal carcinoma after neoadjuvant radiochemotherapy: which score to use? Diseases of the Esophagus, 2006; 19(5): p. 329-334.
2. Van Griethuysen, J.J., et al., Computational radiomics system to decode the radiographic phenotype. Cancer research, 2017; 77(21): p. e104-e107.
3. Wang, J., Pearson Correlation Coefficient, in Encyclopedia of Systems Biology, W. Dubitzky, et al., Editors. 2013, Springer New York: New York, NY. p. 1671-1671.
4. Song, Y., et al., FeAture Explorer (FAE): A tool for developing and comparing radiomics models. Plos one, 2020; 15(8): p. e0237587.
5. Hanley, J.A. and B.J. McNeil, The meaning and use of the area under a receiver operating characteristic (ROC) curve. Radiology, 1982; 143(1): p. 29-36.
6. DiCiccio, T.J. and B. Efron, Bootstrap confidence intervals. Statistical Science, 1996; 11(3): p. 189-228, 40.
Figures