3193
Overall survival analysis of esophageal squamous cell carcinoma using MRI-based radiomics features1Shanghai Key Laboratory of Magnetic Resonance, East China Normal University, Shanghai, China, 2Department of Radiology, The Affiliated Cancer Hospital of Zhengzhou University &Henan Cancer Hospital, Zhengzhou, China, 3MR Scientific Marketing, Siemens Healthineers, Shanghai, China
Synopsis
A total number of 439 patients with esophageal squamous cell carcinoma (ESCC) were enrolled in this study. All patients scanned using StarVIBE sequences. We split the data randomly into training and independent test cohort in a ratio of 7 to 3. We proposed a method for feature selection to find the most useful features for survival analysis. The radiomics score combined with clinical variables achieved the highest consistency in the prediction of disease-free survival (DFS) with a C-index value of 0.682 in the test cohort and overall survival (OS) with a C-index value of 0.691 in the test cohort.
Introduction
Esophageal cancer (EC) ranks the seventh and the sixth in incidence and mortality worldwide among malignant tumors1. EC is also common in China, ranking the third and the fourth in incidence and mortality, respectively. More than 90 percent of EC are squamous cell carcinoma (ESCC)2 . Due to the limitation of conventional MRI imaging, most previous studies on EC used CT images. To explore the clinical value of MRI images in EC, we used StarVIBE sequence which minimizes motion artifacts and has a high spatial resolution. To the best of our knowledge, this is the first work using MRI image for survival analysis of EC. Survival analysis can not only provide information for personalized treatment plan for clinicians, but also allow for better follow-up plans to monitor recurrence. Our goal of this study is to find whether the combination of radiomics features can outperform the clinical signatures based on the high contrast enhanced sequence of MRI.Methods
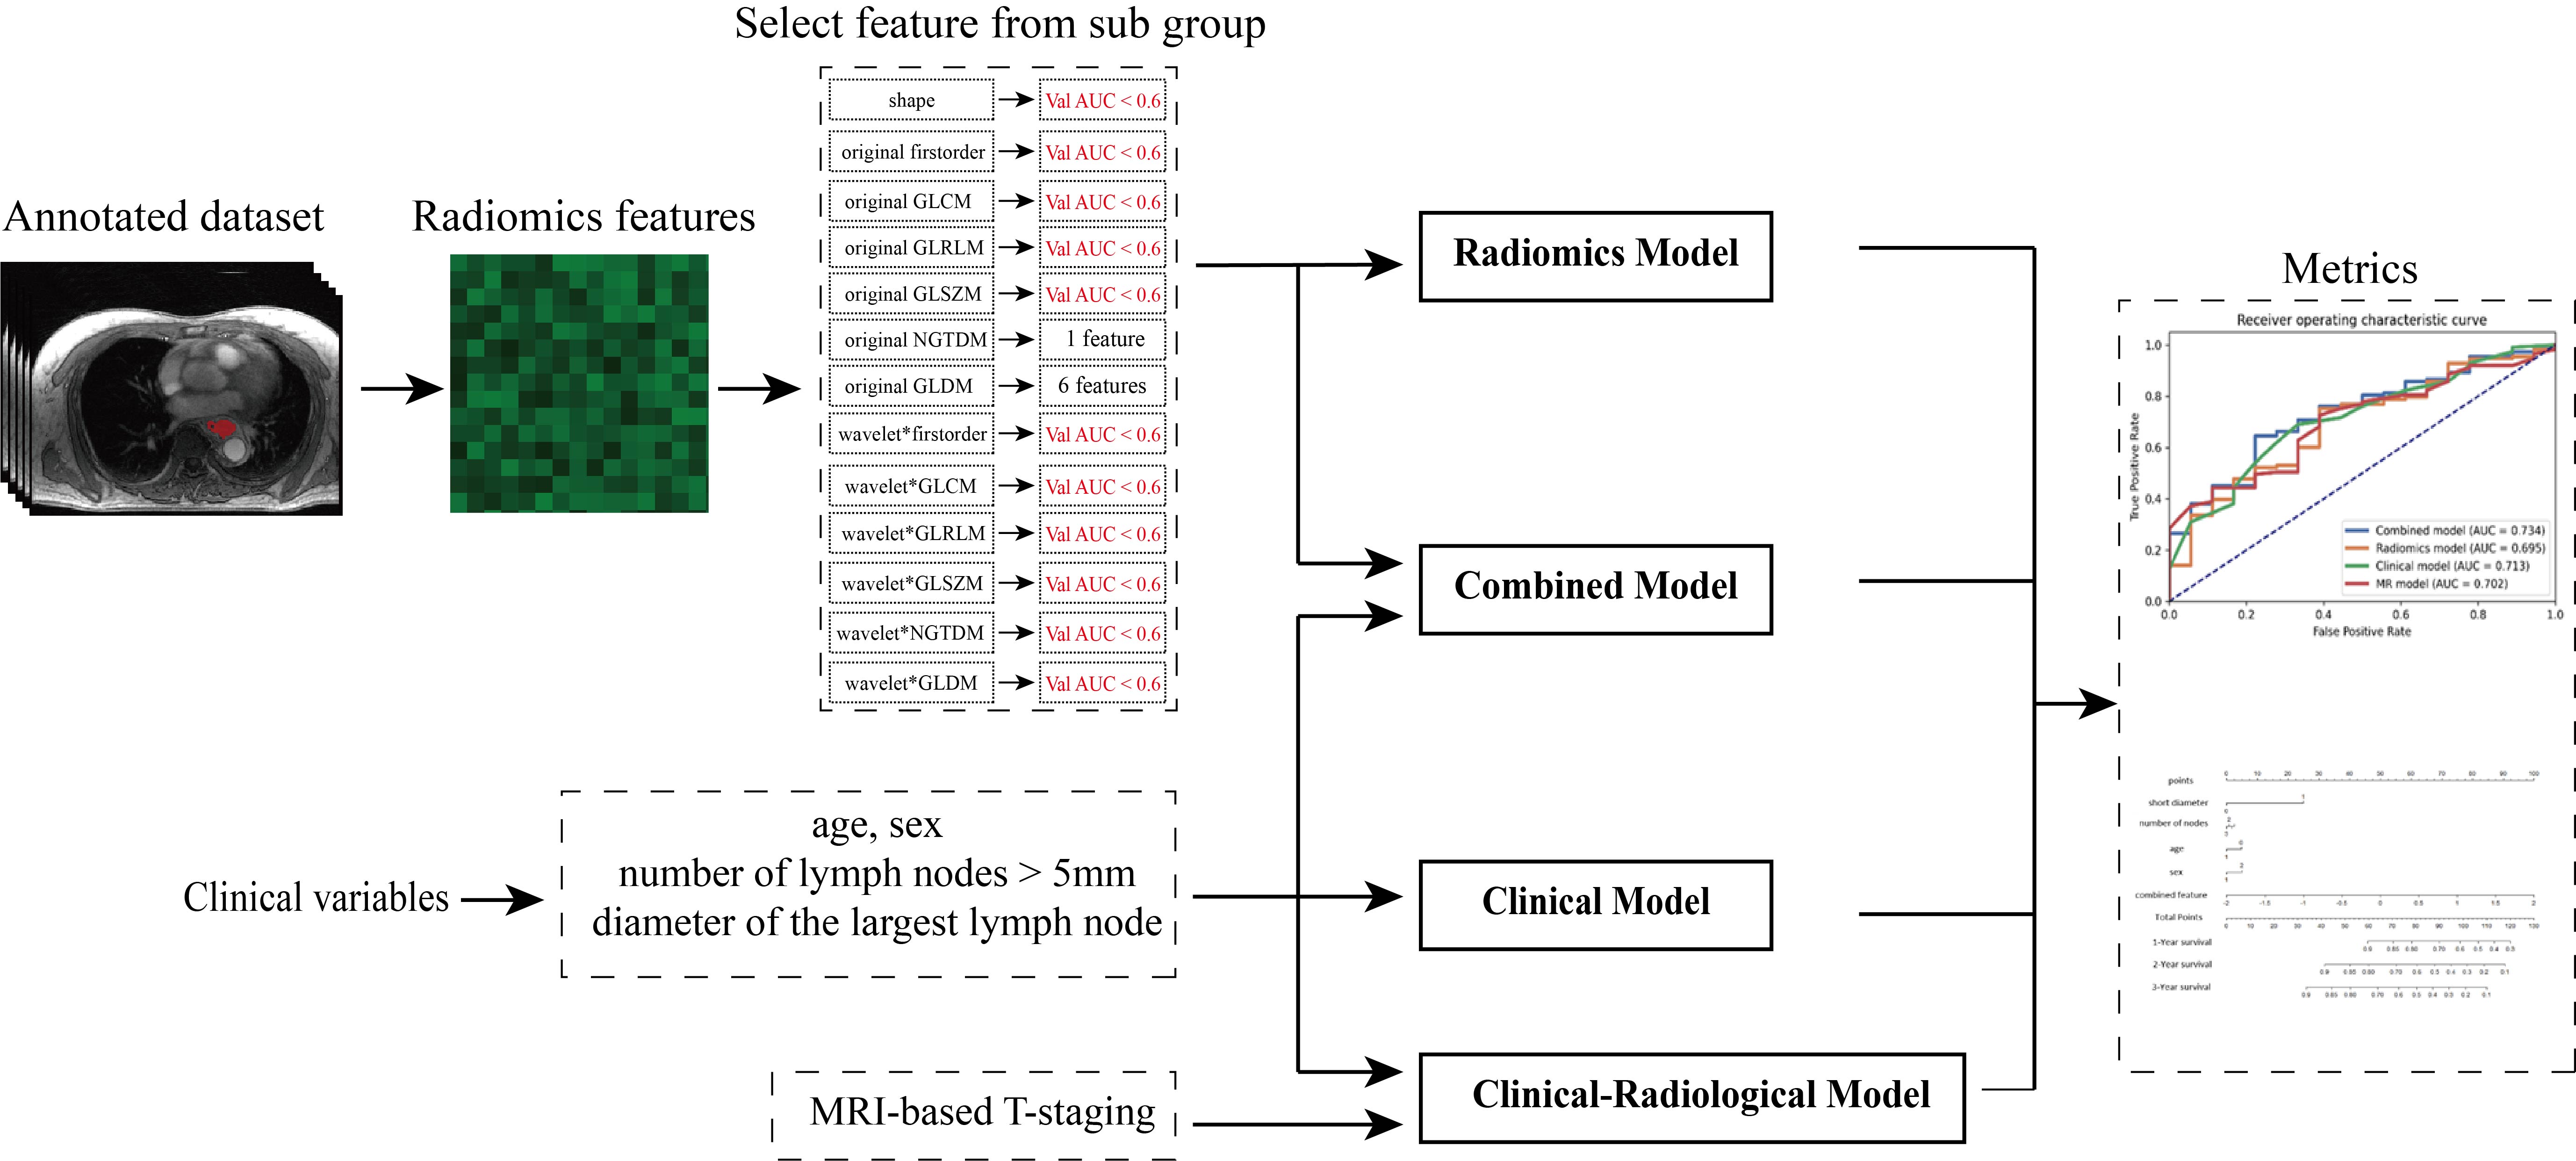
All patients were imaged on a 3T MR (MAGNETOM Skyra, Siemens Healthcare) scanner. The imaging parameters were as follows: TR/TE = 3.98 ms/1.91 ms; FOV = 300 mm × 300 mm × 72 mm; resolution = 1.0 mm × 1.0mm × 1.0 mm; flip angle = 12 degrees; radial views = 1659; acquisition time = 309 s. The inclusion criteria were: 1) Patients underwent preoperative contrast-enhanced MRI performed on a 3T scanner. 2) Patients with biopsy-confirmed EC. 3) Clinical characteristics available. All regions of interest (ROI) were delineated by three radiologists with more than five years of chest reading experience.The workflow of the radiomics study is shown in Figure 1. We split the whole dataset randomly into a training cohort (n=307) and a test cohort (n=132), ensuring there was no significant difference between the distribution of clinical features, and MRI-based T-staging in the training and test cohort.
Firstly, we extracted radiomics features from the ROIs with PyRadiomics3 . We extracted three classes of features from original image, including shape (14), first order (18) and textures features (75). Textures features included those based on gray-level co-occurrence matrix (GLCM, 24), gray-level size zone matrix (GLSZM, 16), gray-level run length matrix (GLRLM, 16), neighboring gray tone difference matrix (NGTDM, 5), and gray-level dependence matrix (GLDM, 14). First order and texture features were also extracted from wavelet-transformed images. Secondly, features were normalized by Z-score normalization4. Then univariate COX-regression was applied in training cohort to remove some redundant features5. Next, we divided the remaining features into 13 groups by the feature type. In each group, we selected the features that are most relevant to the target variable (i.e. survival time) by Pearson-correlation coefficient (PCC)6 and multivariate Cox-regression7 was performed on the selected features. If the C-index was larger than 0.6 in validation cohort, the features of that category would be kept for further model building. Finally, all retained features were combined and multivariate Cox-regression with LASSO constraints was used to build the radiomics model and obtain the final radiomics score. Besides the above radiomics model, we also used multivariate Cox-regression to build a clinical model with four clinical variables (age, sex, number of lymph nodes > 5mm in short diameter, short diameter (mm) of the largest lymph node), a clinical-radiological model with clinical variables and MRI-based T-staging, and a combined model with clinical variables and radiomics score.
Results
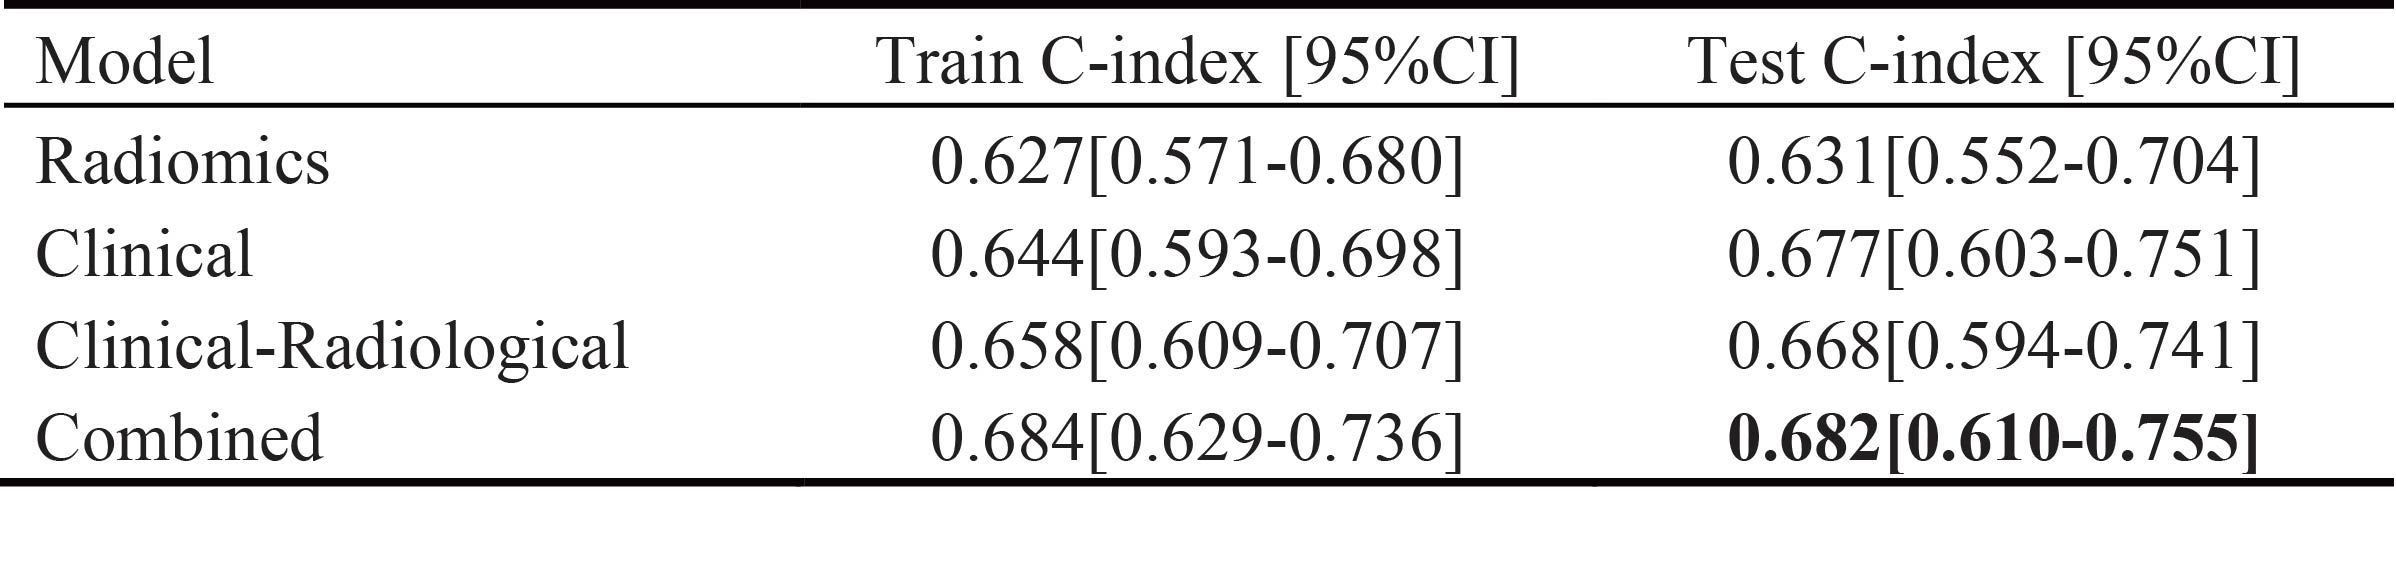
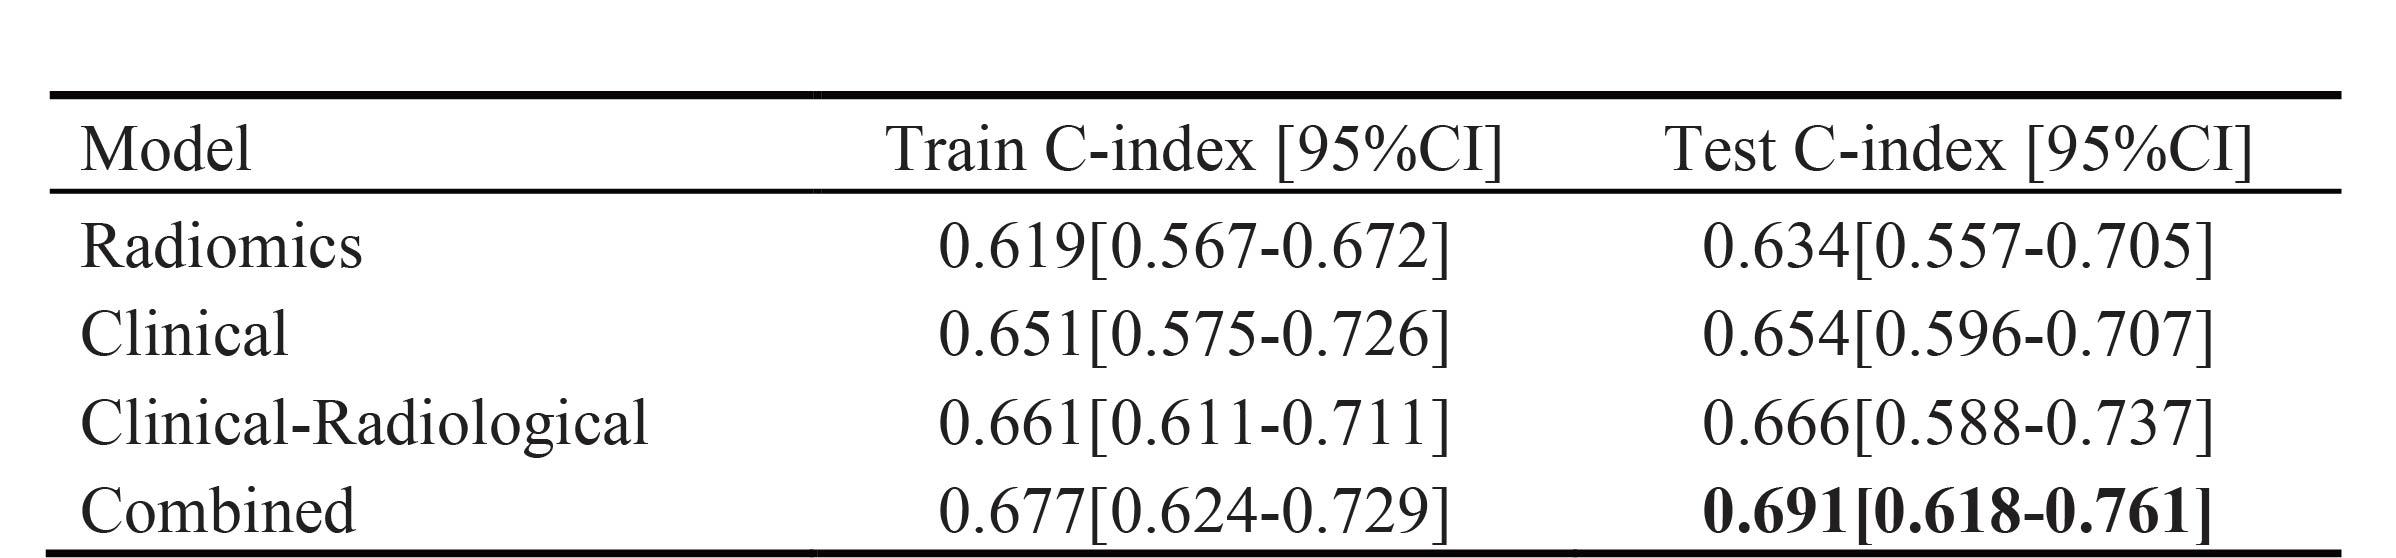
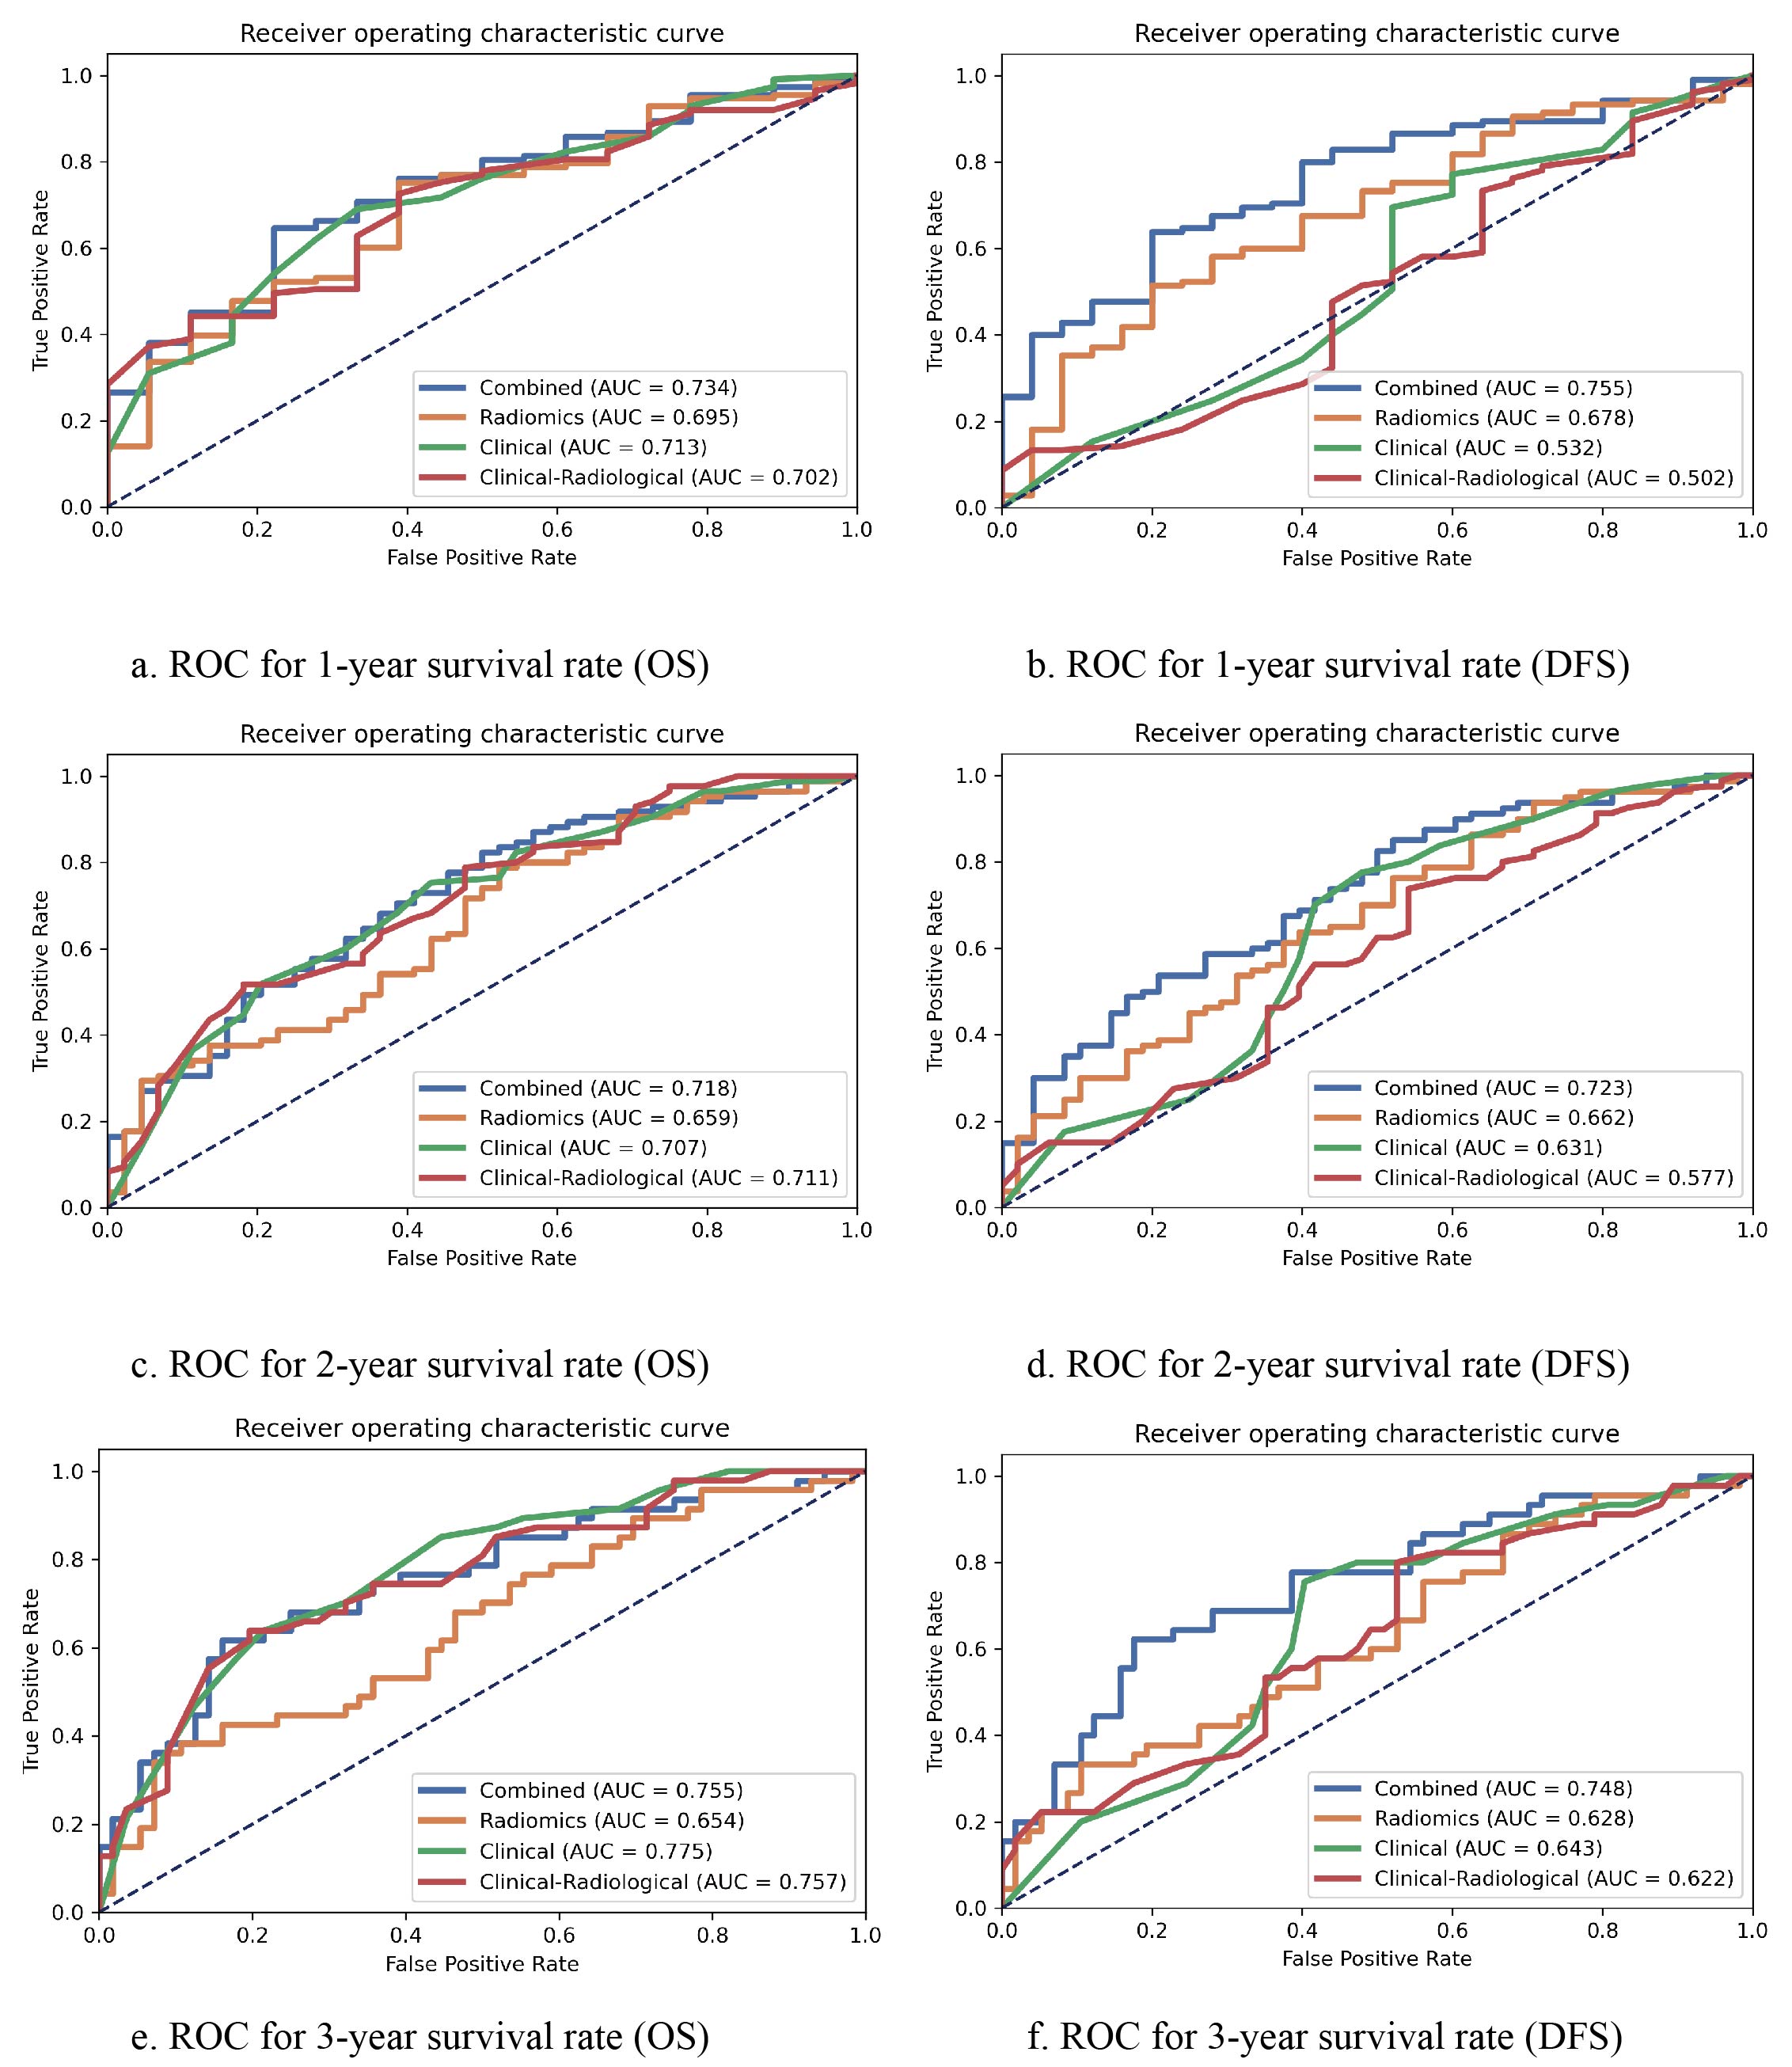
For DFS prediction, the radiomics model, the clinical model, and the clinical-radiological model achieved a C-index of 0.634, 0.654, and 0.666 in the test cohort, respectively. The combined model achieved the best result with a C-index of 0.691 in test cohort. Detailed results are listed in Figure 2. For OS prediction, the best C-index value of 0.682 of combined model was maintained in test cohort, which was higher than the clinical model (0.677), the radiomics model (0.631) and the clinical-radiological model (0.668). Detailed results are showed in Figure 3.To further evaluate the performance of our model, we also calculated the corresponding AUC values for the 1-year, 2-year and 3-year survival rate. For one-year survival rate, the radiomics model, clinical model, clinical-radiological model, and the combined model achieved AUC values of 0.695, 0.713, 0.702 and 0.734, respectively, in the test cohort. Detailed comparison results are shown in Figure 4. Overall, the combined model outperformed other models.
Discussion and Conclusion
In this work, we proposed a predictive model combining clinical variables and the radiomics to predict survival time for patients with ESCC, which outperformed the clinical and clinical radiological models. While the radiomics score demonstrated better prognostic efficacy for EC than MRI-based T-staging, by eliminating the need for manual T-staging, our method can also reduce the workload of the clinicians and eliminate the negative influence of the inter-reader variations to the diagnosis. In the future, larger dataset from multi-institution can be used to further verify our model, and to group patients by treatment plans for obtain prognostic assessments for plans. Deep learning is also a promising alternative to extract more valuable information from MRI images for more precise predictions.Acknowledgements
Part of this work is sponsored by Shanghai Pujiang Program (Grant No. 2020PJD016) and China Postdoctoral Science Foundation (Grant No. 2021M691038)References
1. Sung, H., et al., Global Cancer Statistics 2020: GLOBOCAN Estimates of Incidence and Mortality Worldwide for 36 Cancers in 185 Countries. CA Cancer J Clin, 2021; 71(3): p. 209-249.
2. Chen, W., et al., Cancer statistics in China, 2015. CA Cancer J Clin, 2016; 66(2): p. 115-32.
3. Van Griethuysen, J.J., et al., Computational radiomics system to decode the radiographic phenotype. Cancer research, 2017; 77(21): p. e104-e107.
4. Isensee, F., et al., nnU-Net: a self-configuring method for deep learning-based biomedical image segmentation. Nature Methods, 2021; 18(2): p. 203-211.
5. Bradburn, M.J., et al., Survival analysis Part III: multivariate data analysis -- choosing a model and assessing its adequacy and fit. Br J Cancer, 2003; 89(4): p. 605-11.
6. Wang, J., Pearson Correlation Coefficient, in Encyclopedia of Systems Biology, W. Dubitzky, et al., Editors. 2013, Springer New York: New York, NY. p. 1671-1671.
7. Kvamme, H., Ø. Borgan, and I. Scheel, Time-to-Event Prediction with Neural Networks and Cox Regression. 2019.
Figures