3192
HRMAS-NMR and Machine learning assisted untargeted Serum Metabolomics identified a panel of circulating biomarkers for detection of glioma.1Faculty of Rehabilitation and Allied Health Sciences, Riphah International University, Lahore, Pakistan, 2School of Biochemistry and Biotechnology, University of the Punjab, Lahore, Pakistan, 3Punjab University College of Information Technology, University of the Punjab, Lahore, Pakistan, 4Radiopahtological Unit, Massachusetts General Hospital, Boston, MA, United States
Synopsis
Metabolic alterations, crucial indicators of glioma development, can be used for detection of glioma before the appearance of fatal phenotype. We have compared the circulating metabolic fingerprints of glioma (n=26) and healthy controls (n=16) to identify a panel of biomarkers for detection of glioma. HRMAS-NMR spectra was obtained from two study groups and data was analysed by ML as well as chemometric methods (PCA and PLSDA). A panel of 38 metabolites was identified by three ML algorithms (logistics regression, extra tree classifier, & random forest), Wilcoxon test (p<0.05), and PLSDA (VIP score>1) which can serve as diagnostic biomarker of glioma.
Introduction
Gliomas (low-grade, LGG; high-grade, HGG) are the most aggressive, malignant, and fatal type of primary brain tumors affecting 5-7 people in every 10,000 population. It demonstrates very high mortality and morbidity rate as compared to other cancers because of its diffusing nature with an overall survival rate not exceeding beyond 12-14 months. This low survival and poor outcome of affected patients necessitates the need for early and accurate diagnosis of gliomas for effective management. The diagnosis and staging of the gliomas, LGG and HGG, generally is reliant on the investigation of tumor tissue samples obtained by invasive biopsy technique. However, solid/ tissue biopsy methods are not feasible for assessing the course of malignancy (tumor development to progression) and the routine monitoring of treatment follow-ups. Studies have shown that metabolic alterations play crucial role in tumor development and progression and can be detected in liquid biopsy samples even before the appearance of fatal phenotype. Present study was, therefore, designed to identify the highly sensitive blood-based metabolic biomarkers suitable for detection of glioma in clinical setting.Methods
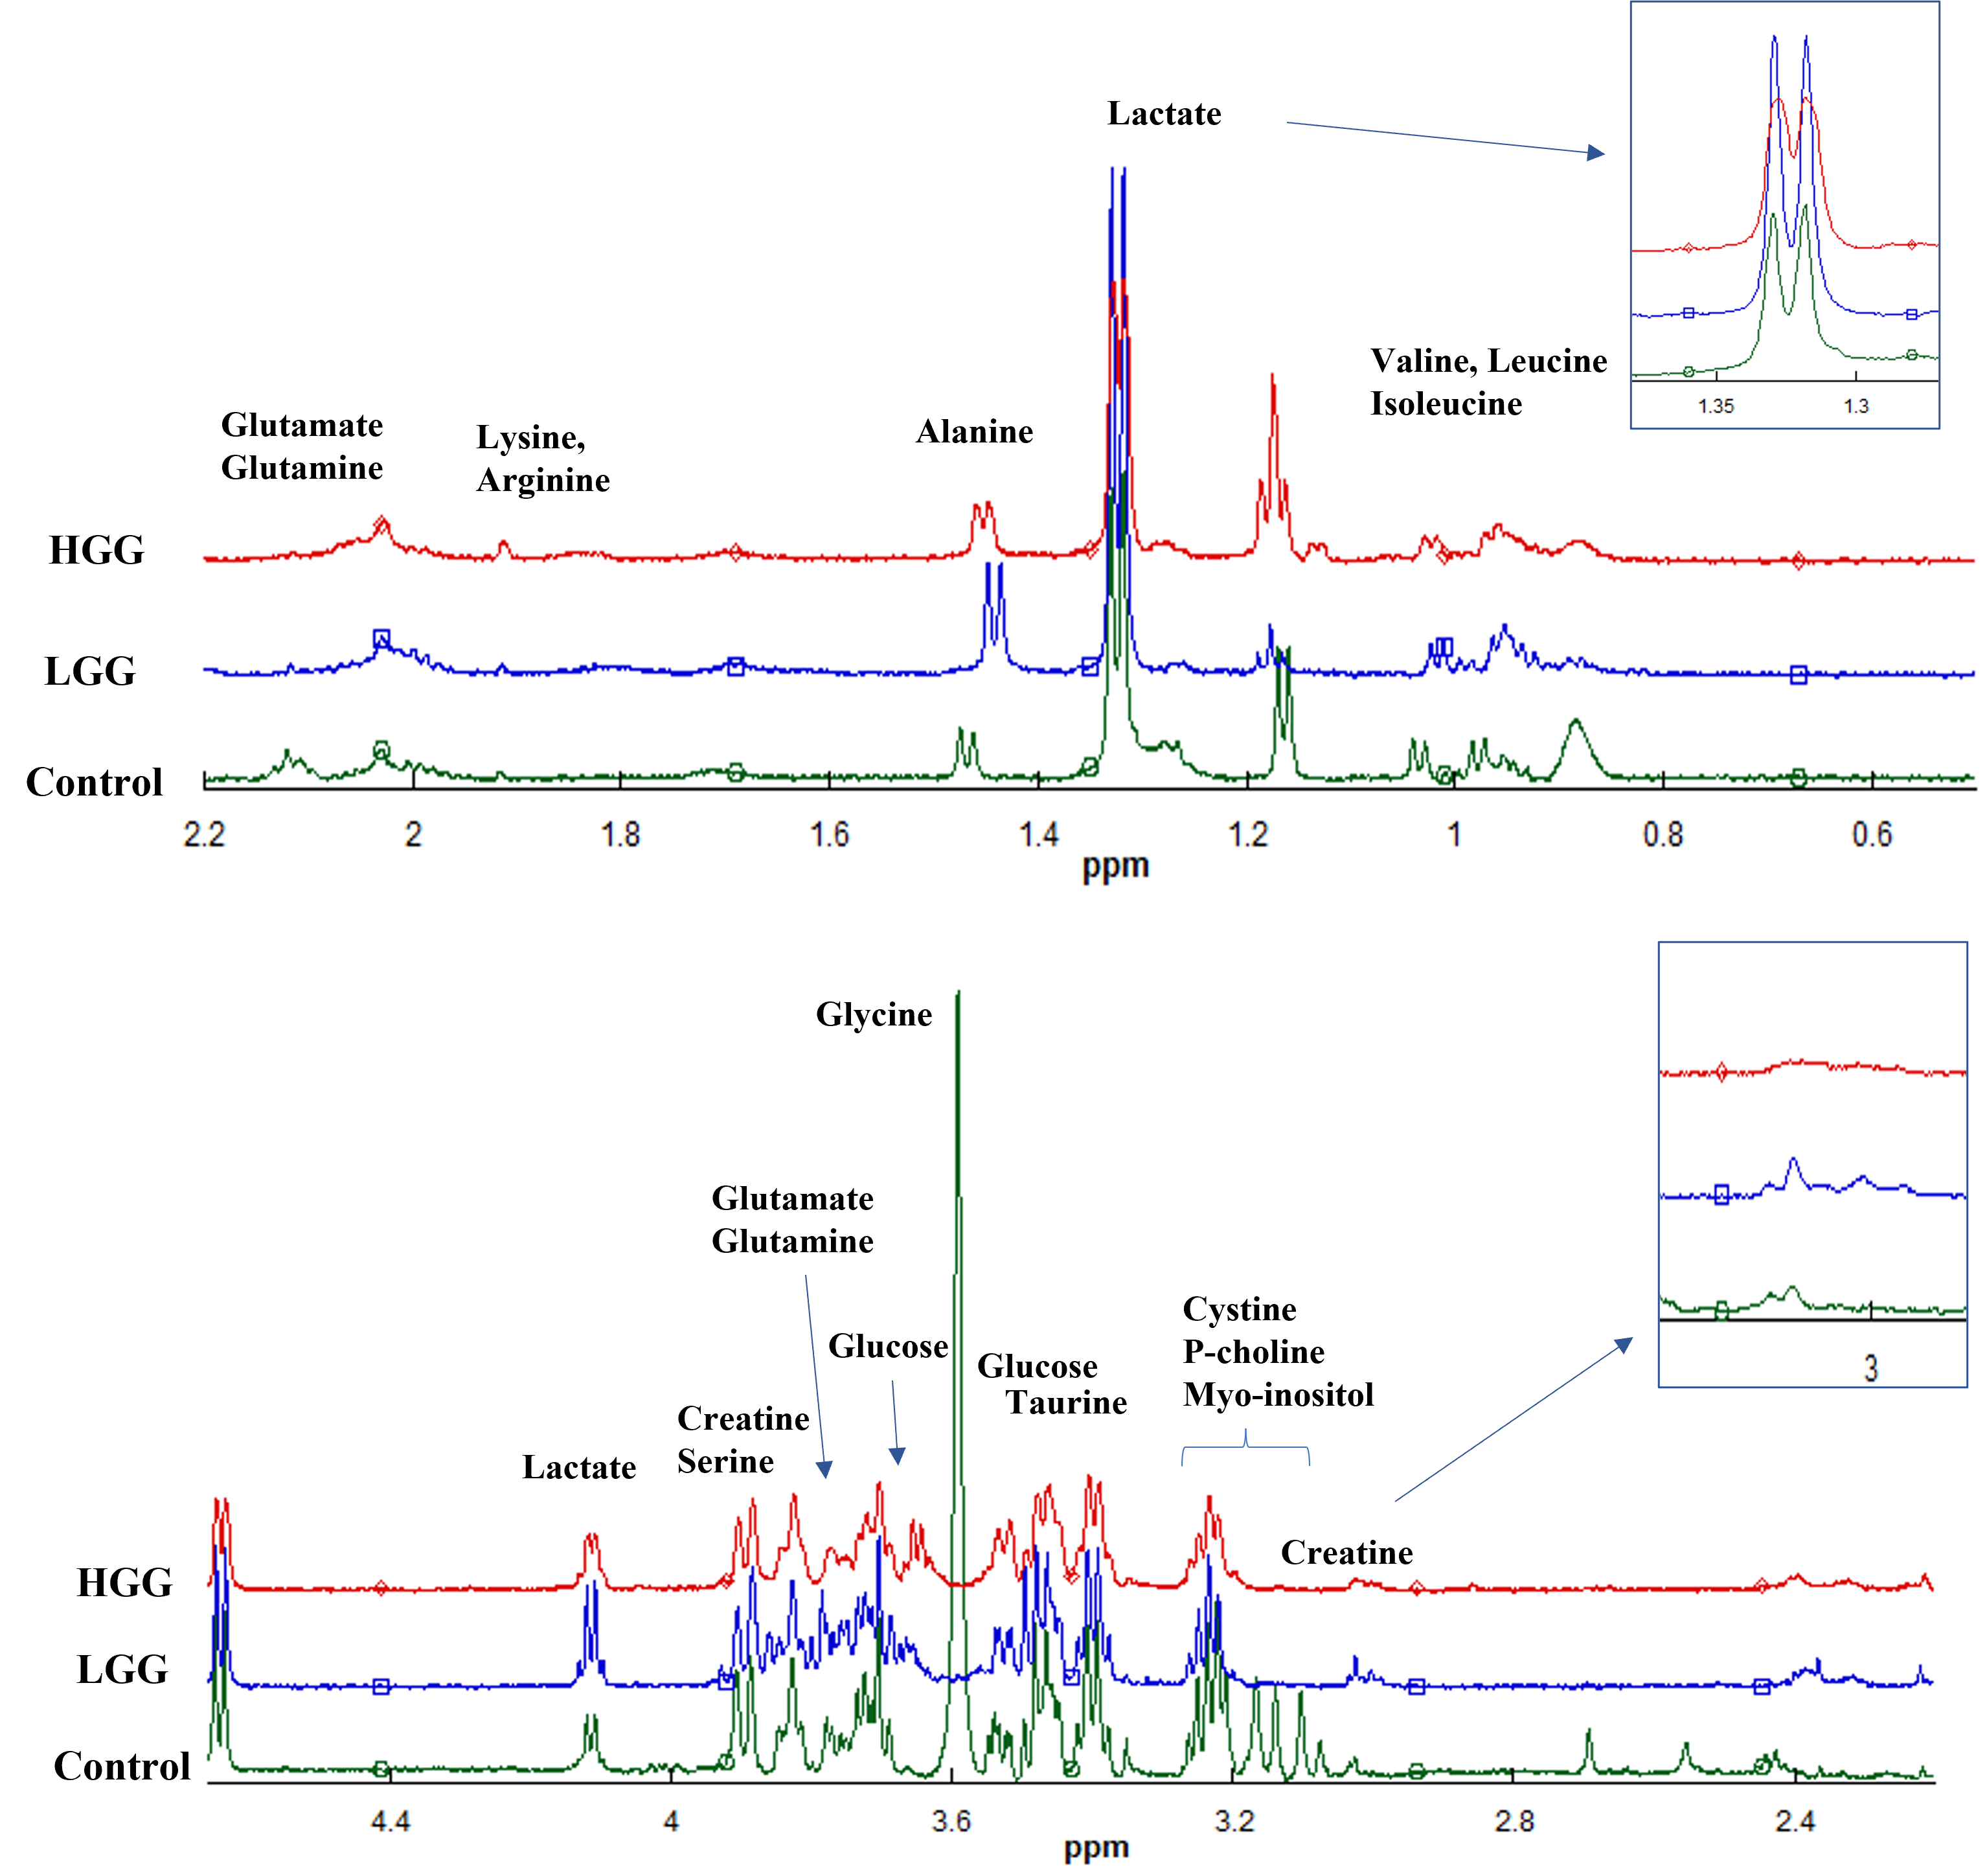
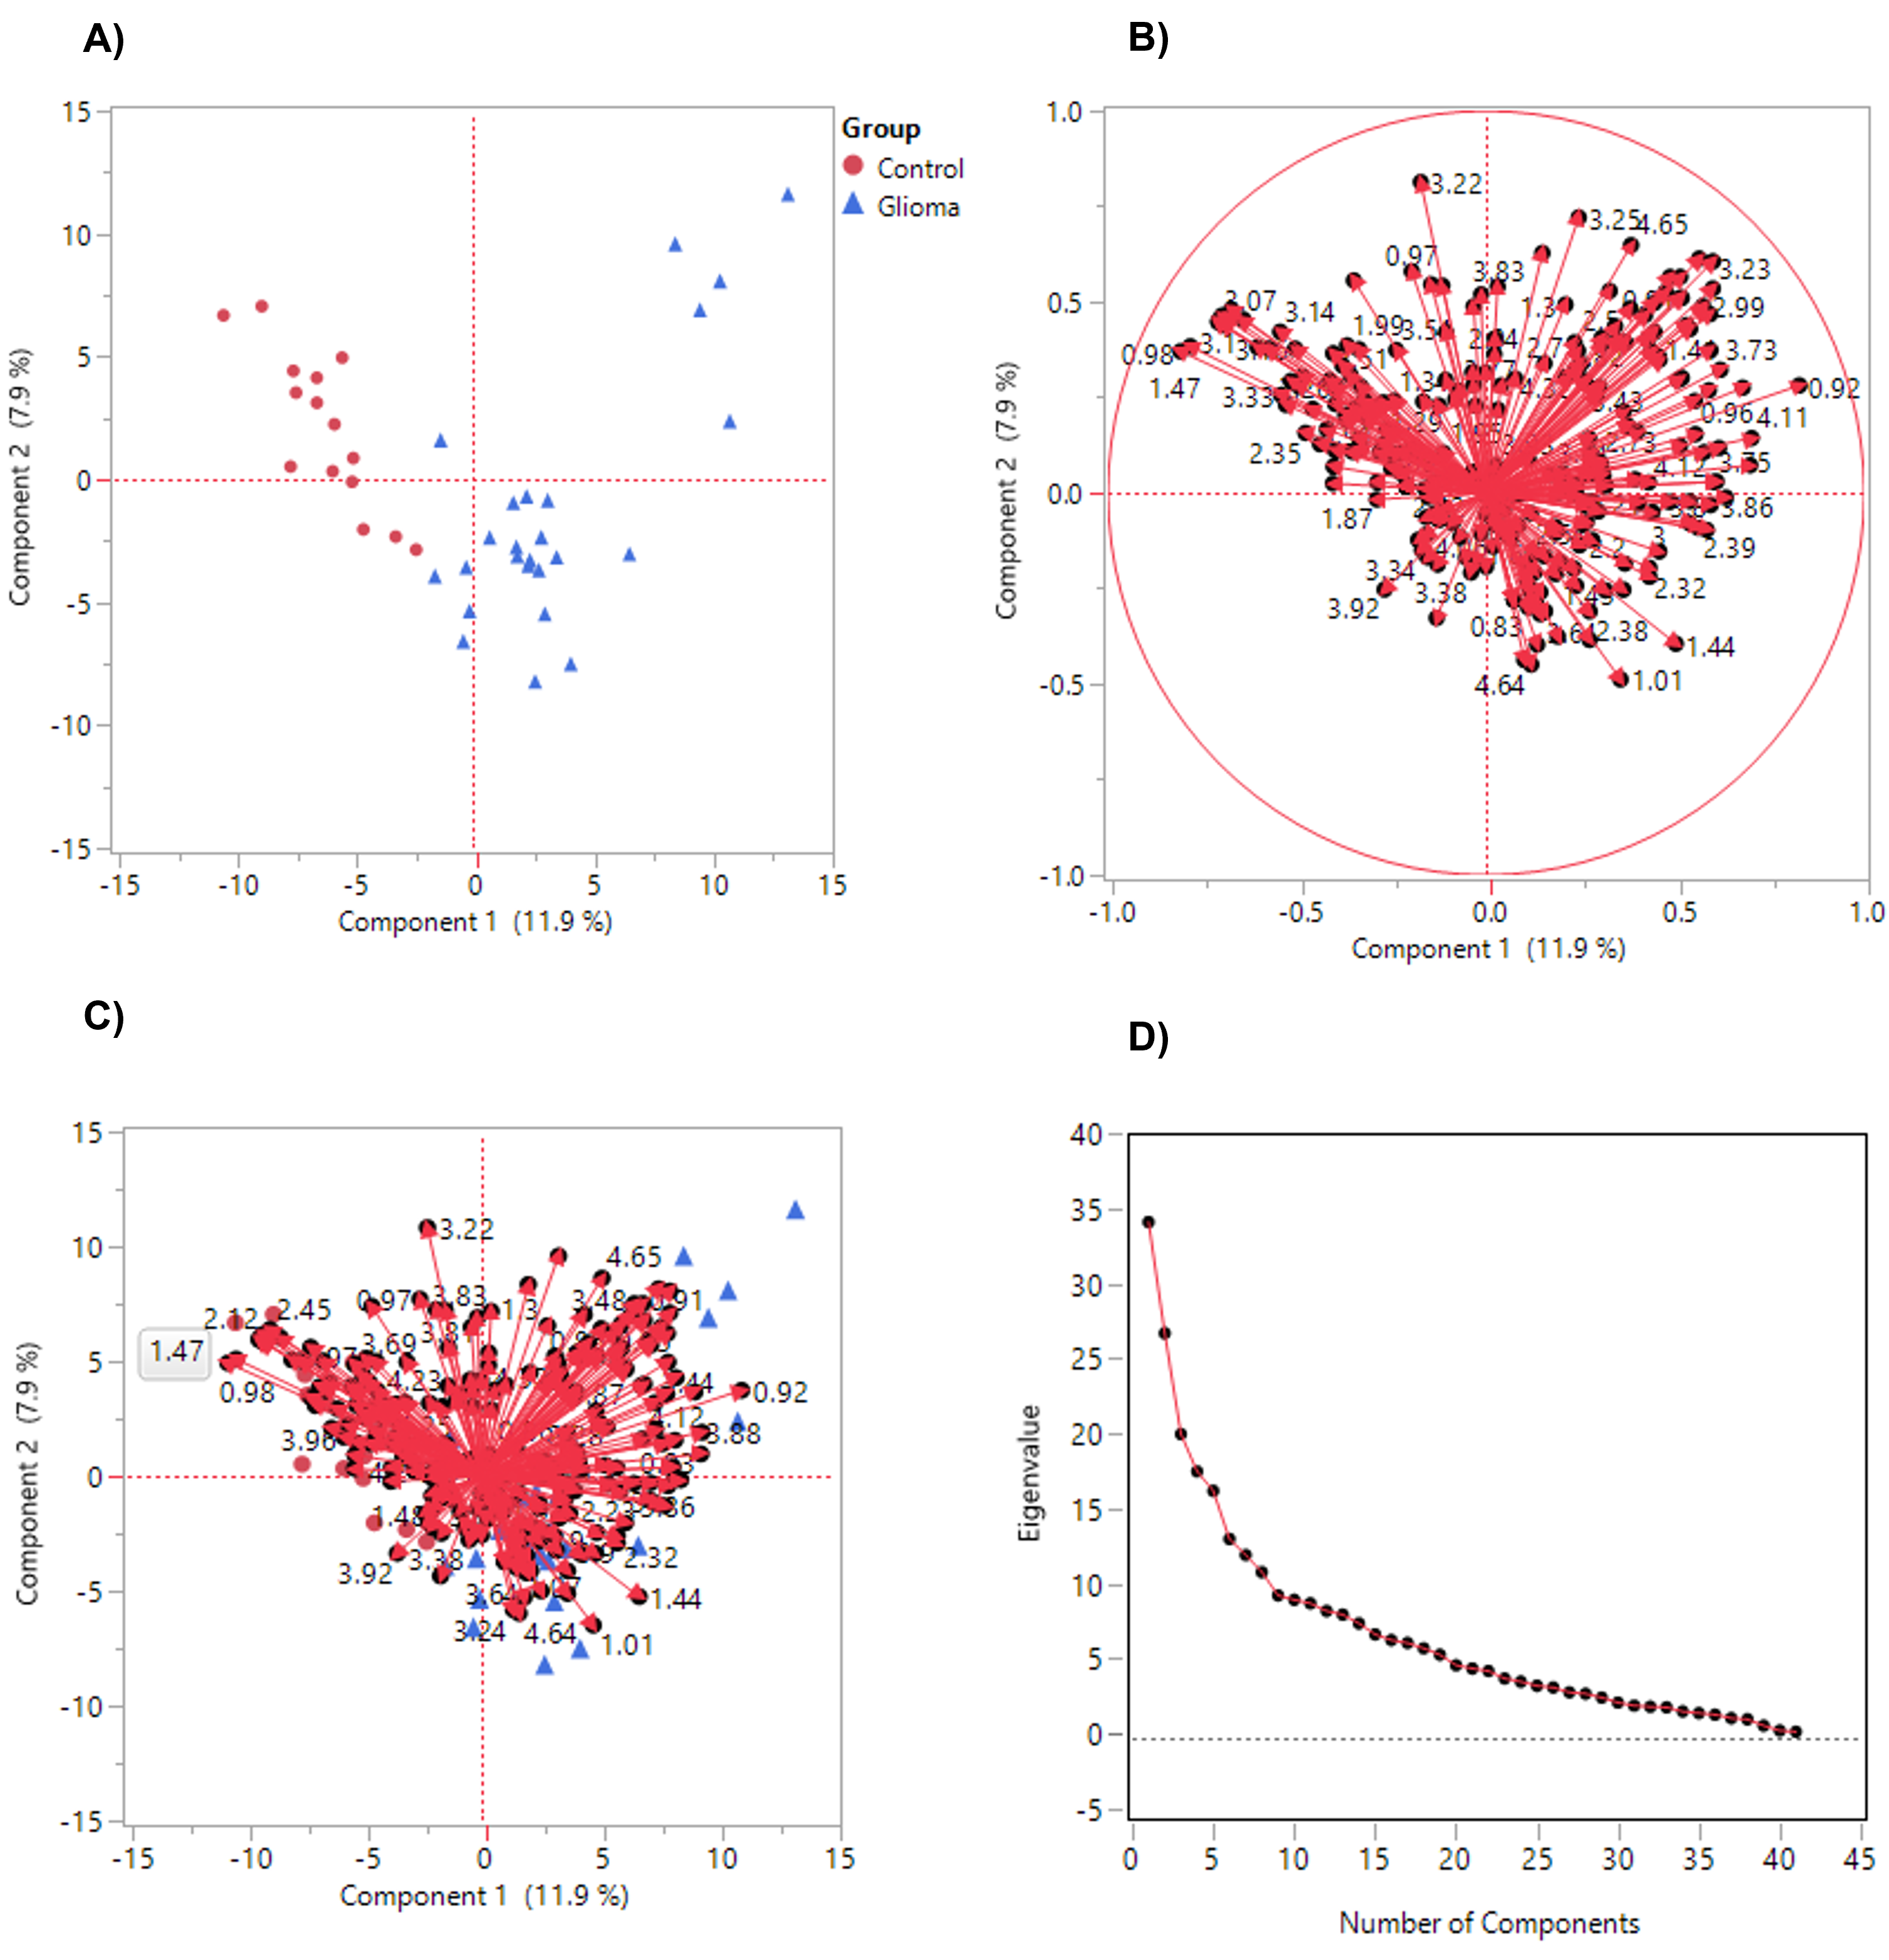
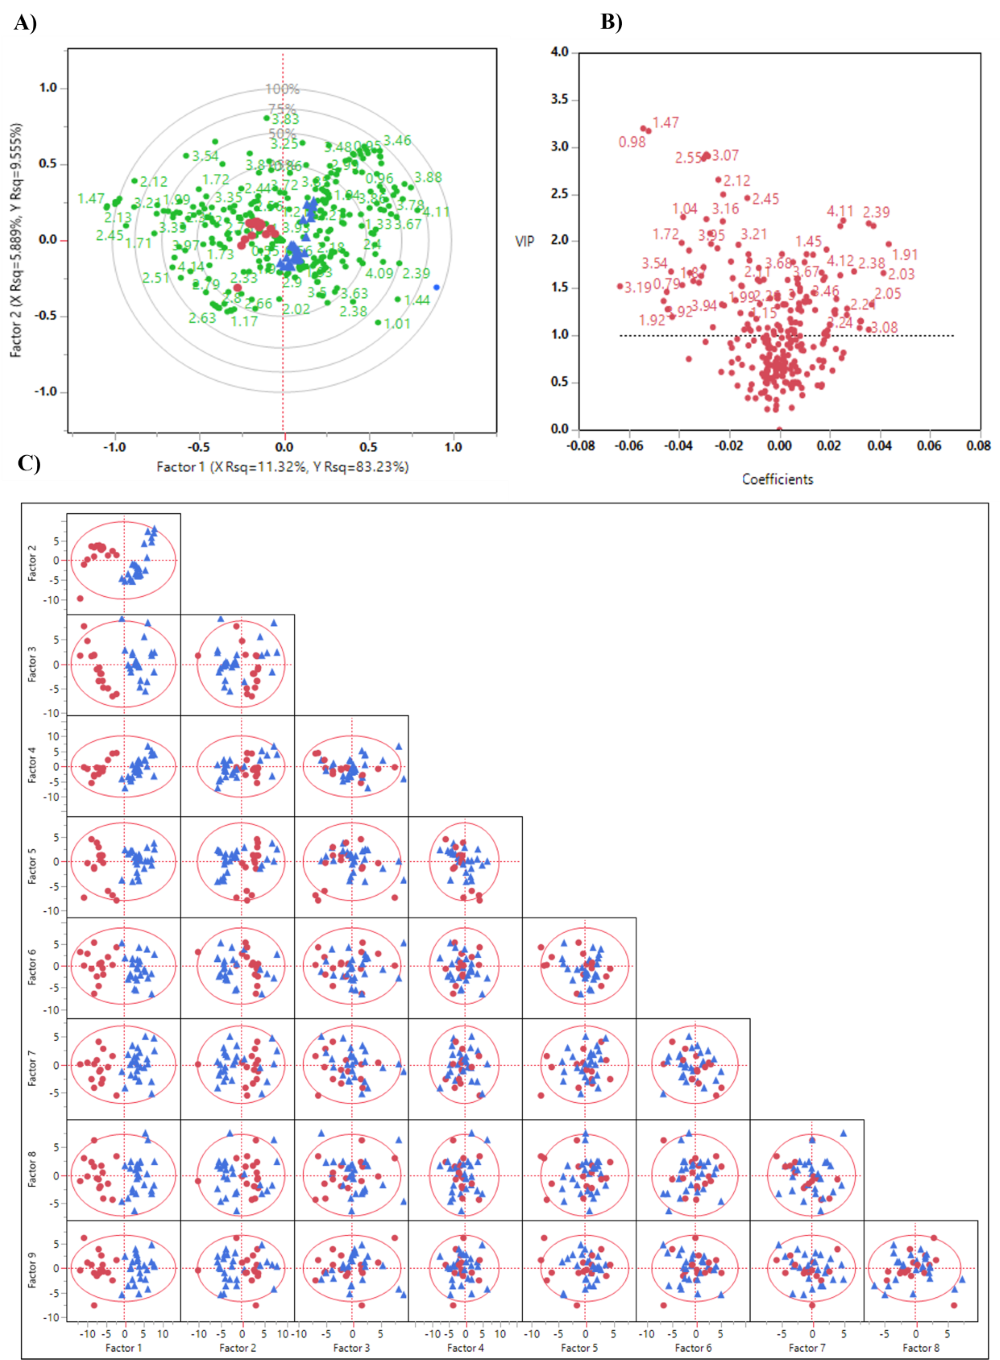
The study enrolled 42 subjects in two groups, glioma (n=26) and healthy control (n=16). High resolution magic angle spinning nuclear magnetic resonance (HRMAS-NMR) spectroscopy was used to quantify the metabolic fingerprints of two study groups. Spectral region ranging from 4.66-0.5ppm was curve fitted to obtain the area under each peak and resultant spectral regions were reduced to the accuracy of 0.01ppm. Data was normalized to % relative intensity and analyzed by three machine learning models (extra tree classifier, random forest and logistics regression) and statistical analysis i.e. Wilcoxon test, principal component analysis (PCA) and partial least squares discriminant analysis (PLSDA) to identify the metabolic fingerprints which can discriminate the two groups in a clinical setting.Results
Three ML algorithms (logistics regression, extra tree classifier, and random forest) were applied to discriminate the glioma and non-glioma groups. We achieved 100% accuracy using both extra tree classifier and random forest models (F1-measure: 1.0, Recall: 1.00, precision: 1.00) and identified 104 and 158 spectral regions while 98% accuracy with logistics regression (F1-measure: 0.98, Recall: 0.96, Precision: 1.00) identified one spectral region for differentiation of glioma and non-glioma groups. All identified spectral regions were subjected to validation by statistical analysis (Wilcoxon test) and PLSDA. 127 spectral regions identified by PLSDA had VIP score greater than 1, out of which 100 spectral regions were statistically significant (p<0.05). Biomarker panel was selected based on the following criteria as i) identified by ML models ii) Wilcoxon test (p<0.05) and iii) PLSDA (VIP score>1).166 spectral regions fulfilled the selection criteria which corresponds to 36 contributing metabolites.Discussion
Alanine was identified as the most critical metabolite with potential to detect glioma with precision 1.0; recall 0.96; F1 measure 0.98. Identified biomarker panel included alanine, aspartate, fatty acid, GABA, glutamate, glutamine, glycine, lactate, myo-inositol, N-acetylaspartate, oxaloacetate, p-choline, phenylalanine, proline, serine, threonine, valine, and β-glucose.Conclusion
In conclusion, the Identified metabolite panel can be targeted to develop early diagnostic methods as well as to plan personalized treatment strategies.Acknowledgements
No acknowledgement found.References
Bi J, Chowdhry S, Wu S, Zhang W, Masui K, Mischel PS. 2020a. Altered cellular metabolism in gliomas—an emerging landscape of actionable co-dependency targets. Nat Rev Cancer. 20(1):57-70.
Chen J-Q, Russo J. 2012. Dysregulation of glucose transport, glycolysis, tca cycle and glutaminolysis by oncogenes and tumor suppressors in cancer cells. Biochim Biophys Acta Rev Can. 1826(2):370-384.
Chinnaiyan P, Kensicki E, Bloom G, Prabhu A, Sarcar B, Kahali S, Eschrich S, Qu X, Forsyth P, Gillies R. 2012. The metabolomic signature of malignant glioma reflects accelerated anabolic metabolism. Can Res. 72(22):5878-5888.
Constantin A, Elkhaled A, Jalbert L, Srinivasan R, Cha S, Chang SM, Bajcsy R, Nelson SJ. 2012. Identifying malignant transformations in recurrent low-grade gliomas using high resolution magic angle spinning spectroscopy. Artl Intel Med. 55(1):61-70
Figures