3191
Classification and visualization of chemo-brain in breast cancer survivors with deep residual and densely connected networks1Department of Medical Imaging and Radiological Sciences, Graduate Institute of Artificial Intelligence, Chang Gung University, Taoyuan, Taiwan, 2School of Medicine, Chang Gung University, Taoyuan, Taiwan, 3Department of Psychiatry, Chang Gung Memorial Hospital, Chiayi, Taiwan, 4Department of Diagnostic Radiology, Chang Gung Memorial Hospital, Chiayi, Taiwan, 5Medical Imaging Research Center, Institute for Radiological Research, Chang Gung University and Chang Gung Memorial Hospital at Linkou, Taoyuan, Taiwan
Synopsis
Our goal was to establish objective 3D deep learning models that differentiate cerebral alterations based on the effect of chemotherapy and to visualize the pattern that was recognized by our model. The average performance of SE-ResNet-50 models was accuracy of 80%, precision of 78%, and 70% recall, and the SE-DenseNet-121 model reached identical results with an average 80% accuracy, 86% precision, and 80% recall. The regions with the greatest contributions highlighted by the integrated gradients algorithm for differentiating chemo-brain were default mode and dorsal attention networks. We hope these results will be helpful in clinically tracking chemo-brain in the future.
Introduction
Breast cancer is the most common female cancer worldwide, and breast cancer accounts for 30% of female cancers 1. Of all the treatment modalities, breast cancer survivors who have undergone chemotherapy might complain about cognitive impairment during and after cancer treatment. This phenomenon, chemo-brain, is used to describe the alterations in cognitive functions after receiving systemic chemotherapy 2, 3. Few reports have detected the chemotherapy-induced cognitive impairment (CICI) by performing functional MRI (fMRI) and deep learning analysis. In this study, our goal was to establish objective 3D deep learning models that differentiate cerebral alterations based on the effect of chemotherapy and to visualize the pattern that was recognized by our model. We modified two state-of-the-art CNN models, i.e. SE-ResNet-50 and SE-DenseNet-121, into 3D and applied a visual explanatory algorithm using TensorFlow and Keras 4, 5 higher application programming interface (API) to achieve these goals. To the best of our knowledge, this article is the first to explain the internal logic of a CNN model when distinguishing chemo-brain.Methods
One hundred twenty female participants were recruited. The participants who were diagnosed with breast cancer and had received systemic chemotherapy were assigned to the C+ group (N = 55), and the remaining 65 sex-matched individuals without a breast cancer history were assigned to the healthy controls (HC) group. Resting-state fMRI acquisition was performed using a 3 T MRI scanner (Verio, Siemens, Germany). We used the mean fractional amplitude of low-frequency fluctuations (mfALFF), which was extracted from functional MRI data, as our input feature. Two state-of-the-art deep learning architectures, ResNet-50 and DenseNet-121, were transformed to 3D, embedded with squeeze and excitation (SE) blocks, and then trained to differentiate cerebral alterations based on the effect of chemotherapy. The integrated gradient was applied to visualize the pattern that was recognized by our model.Results
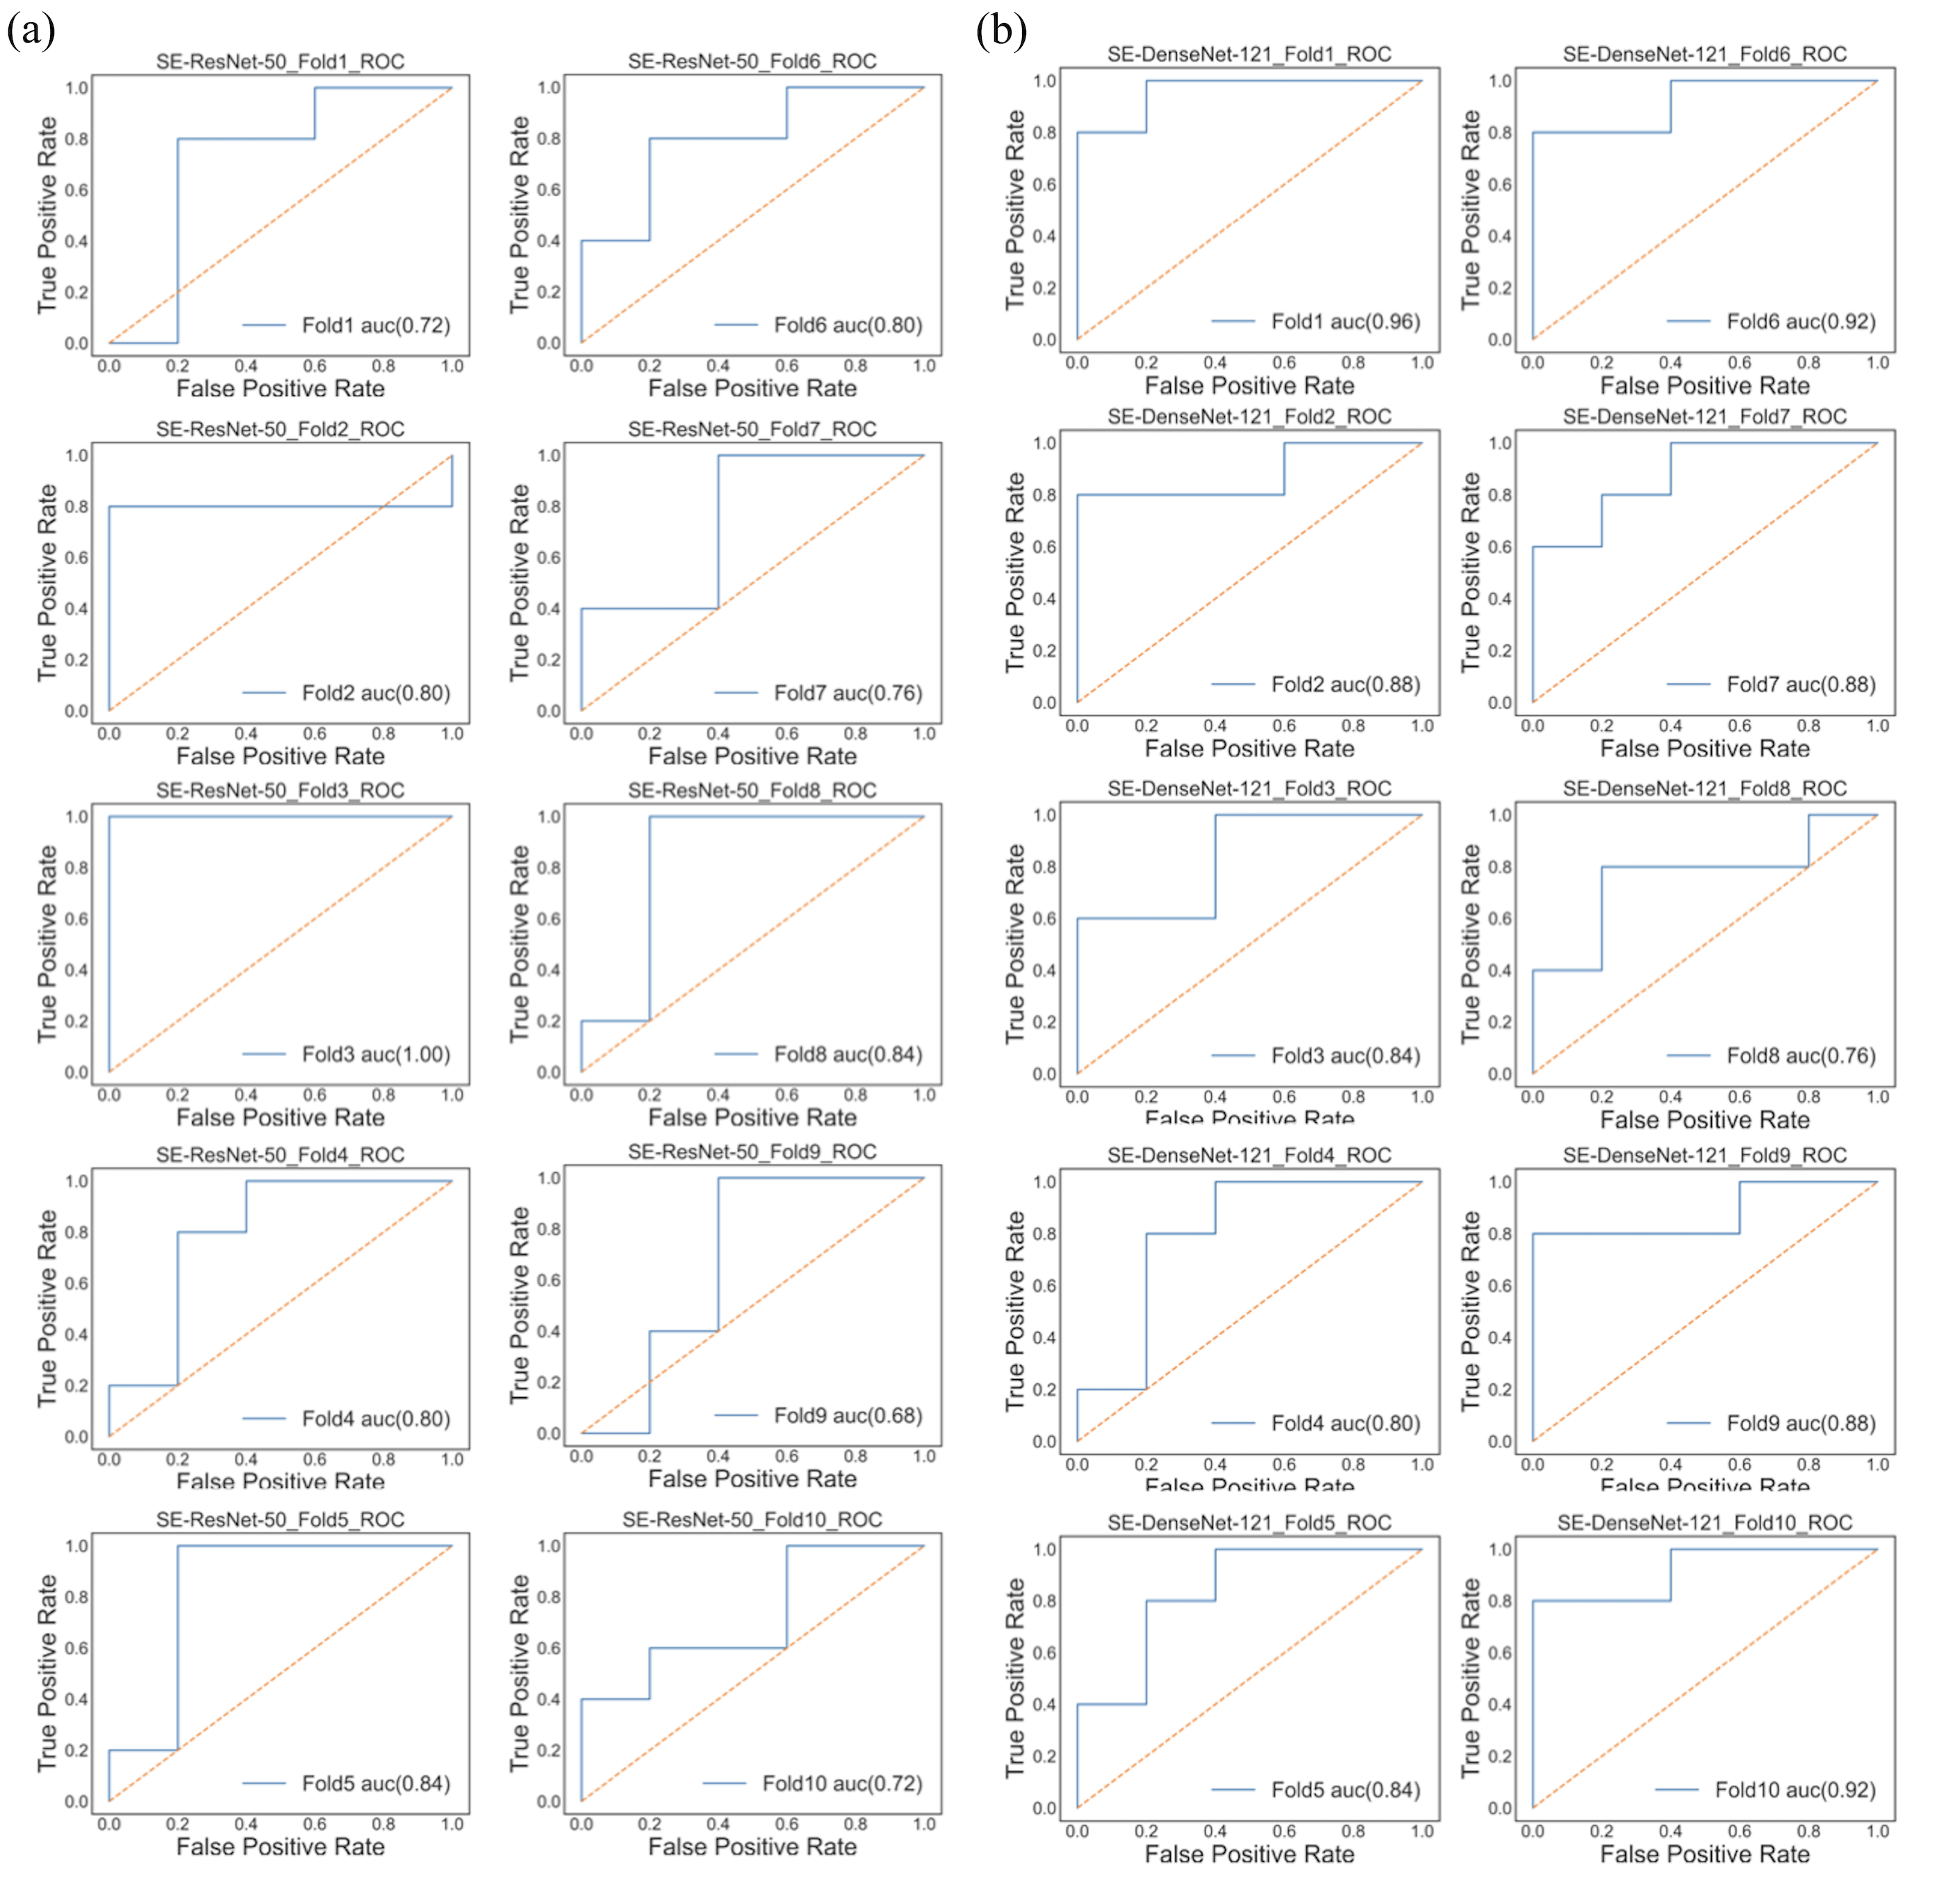
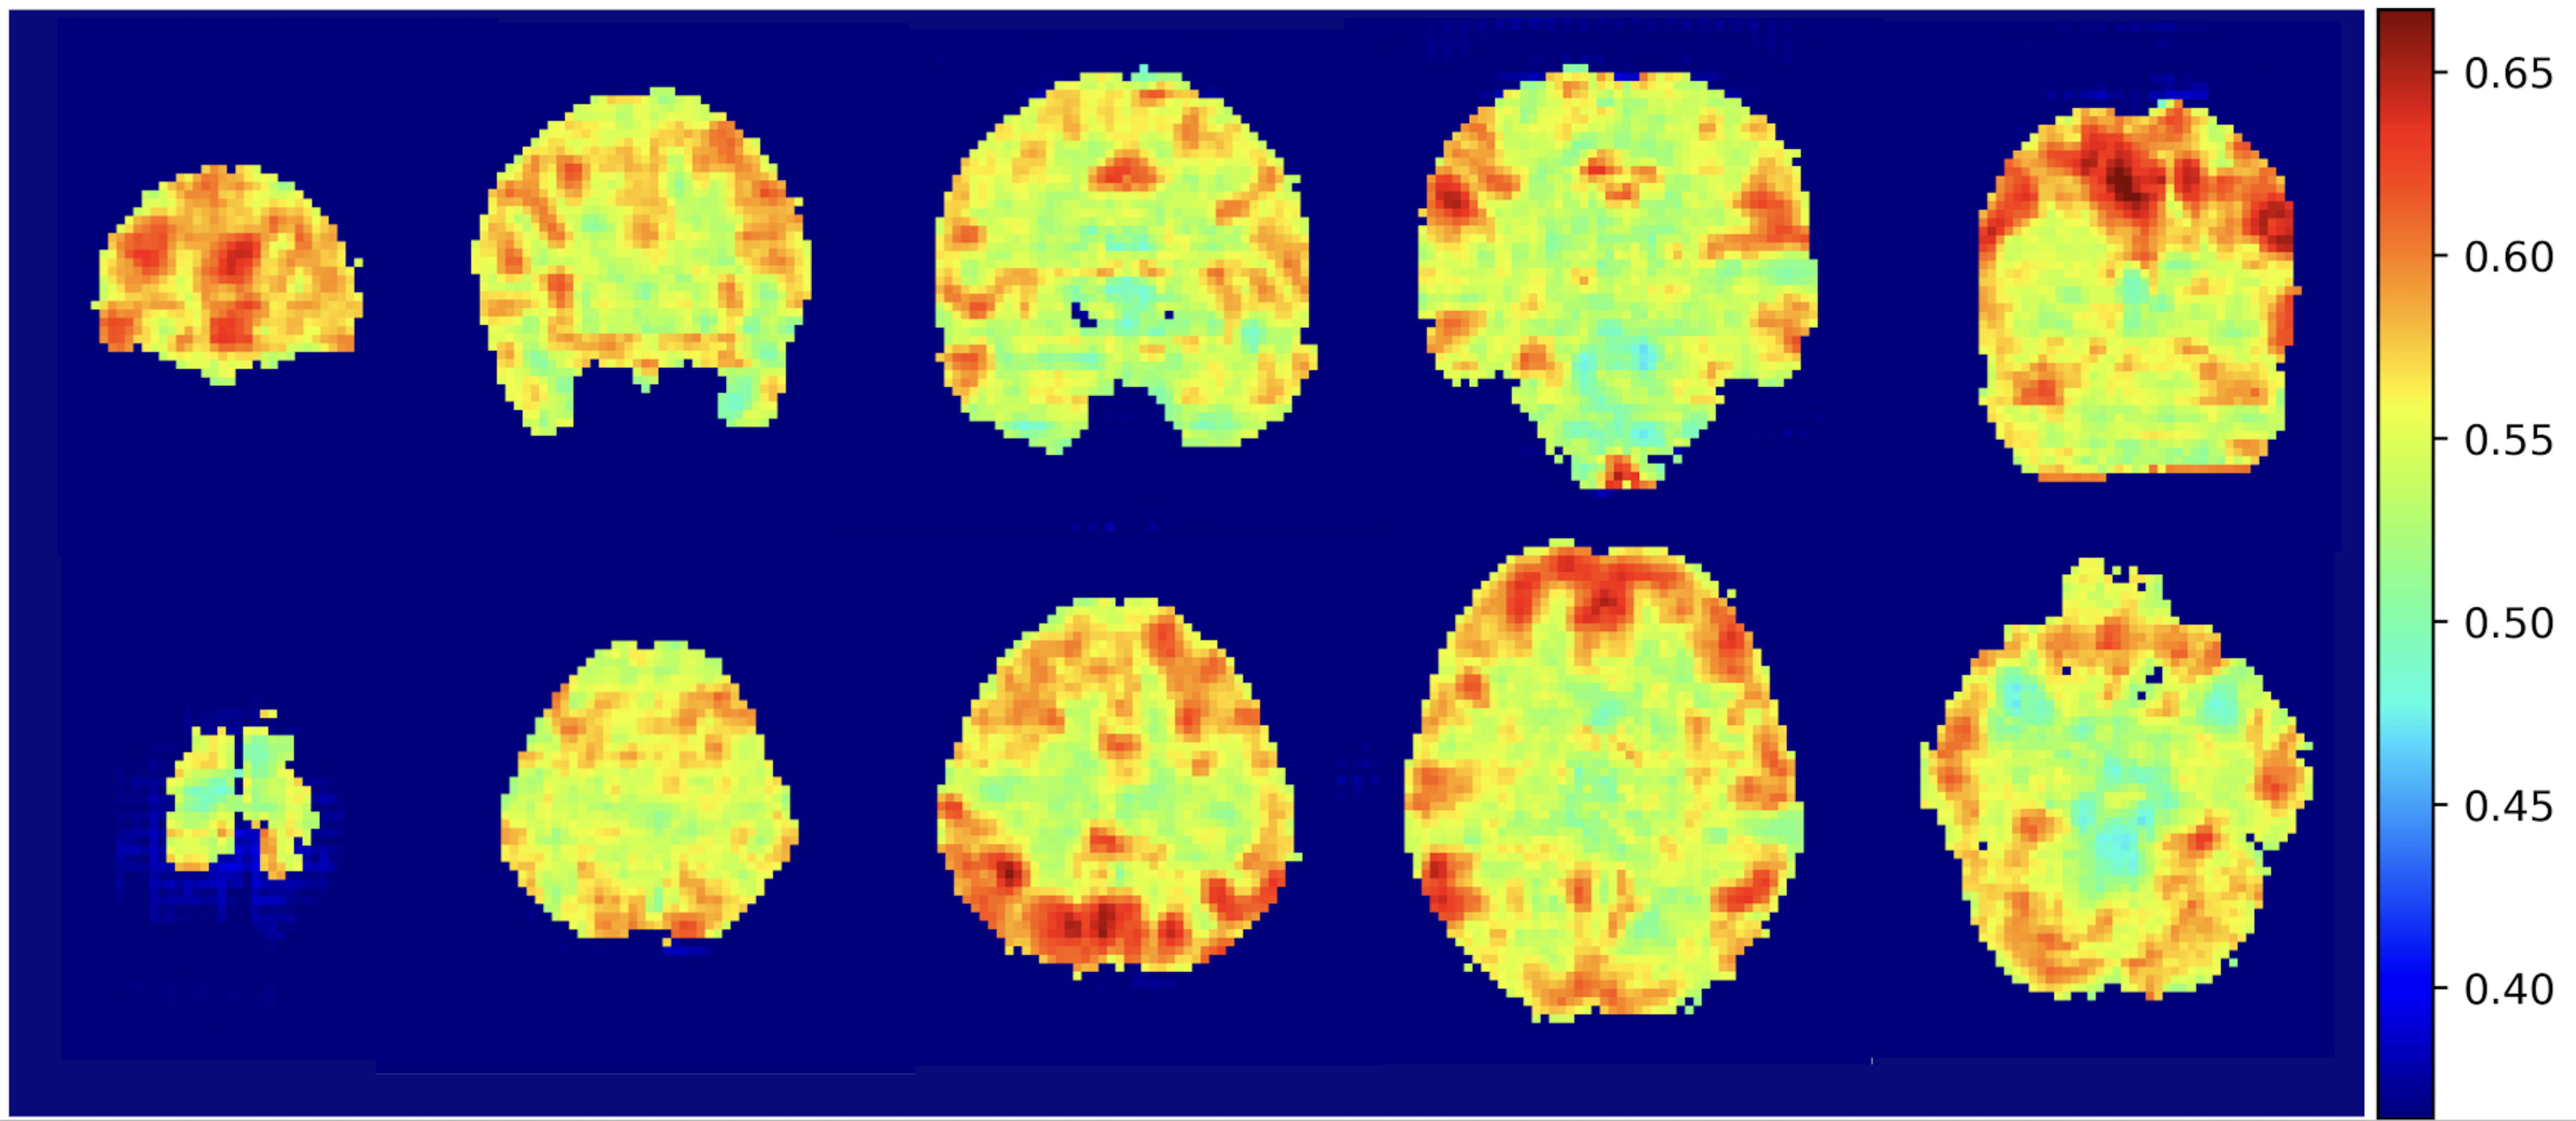
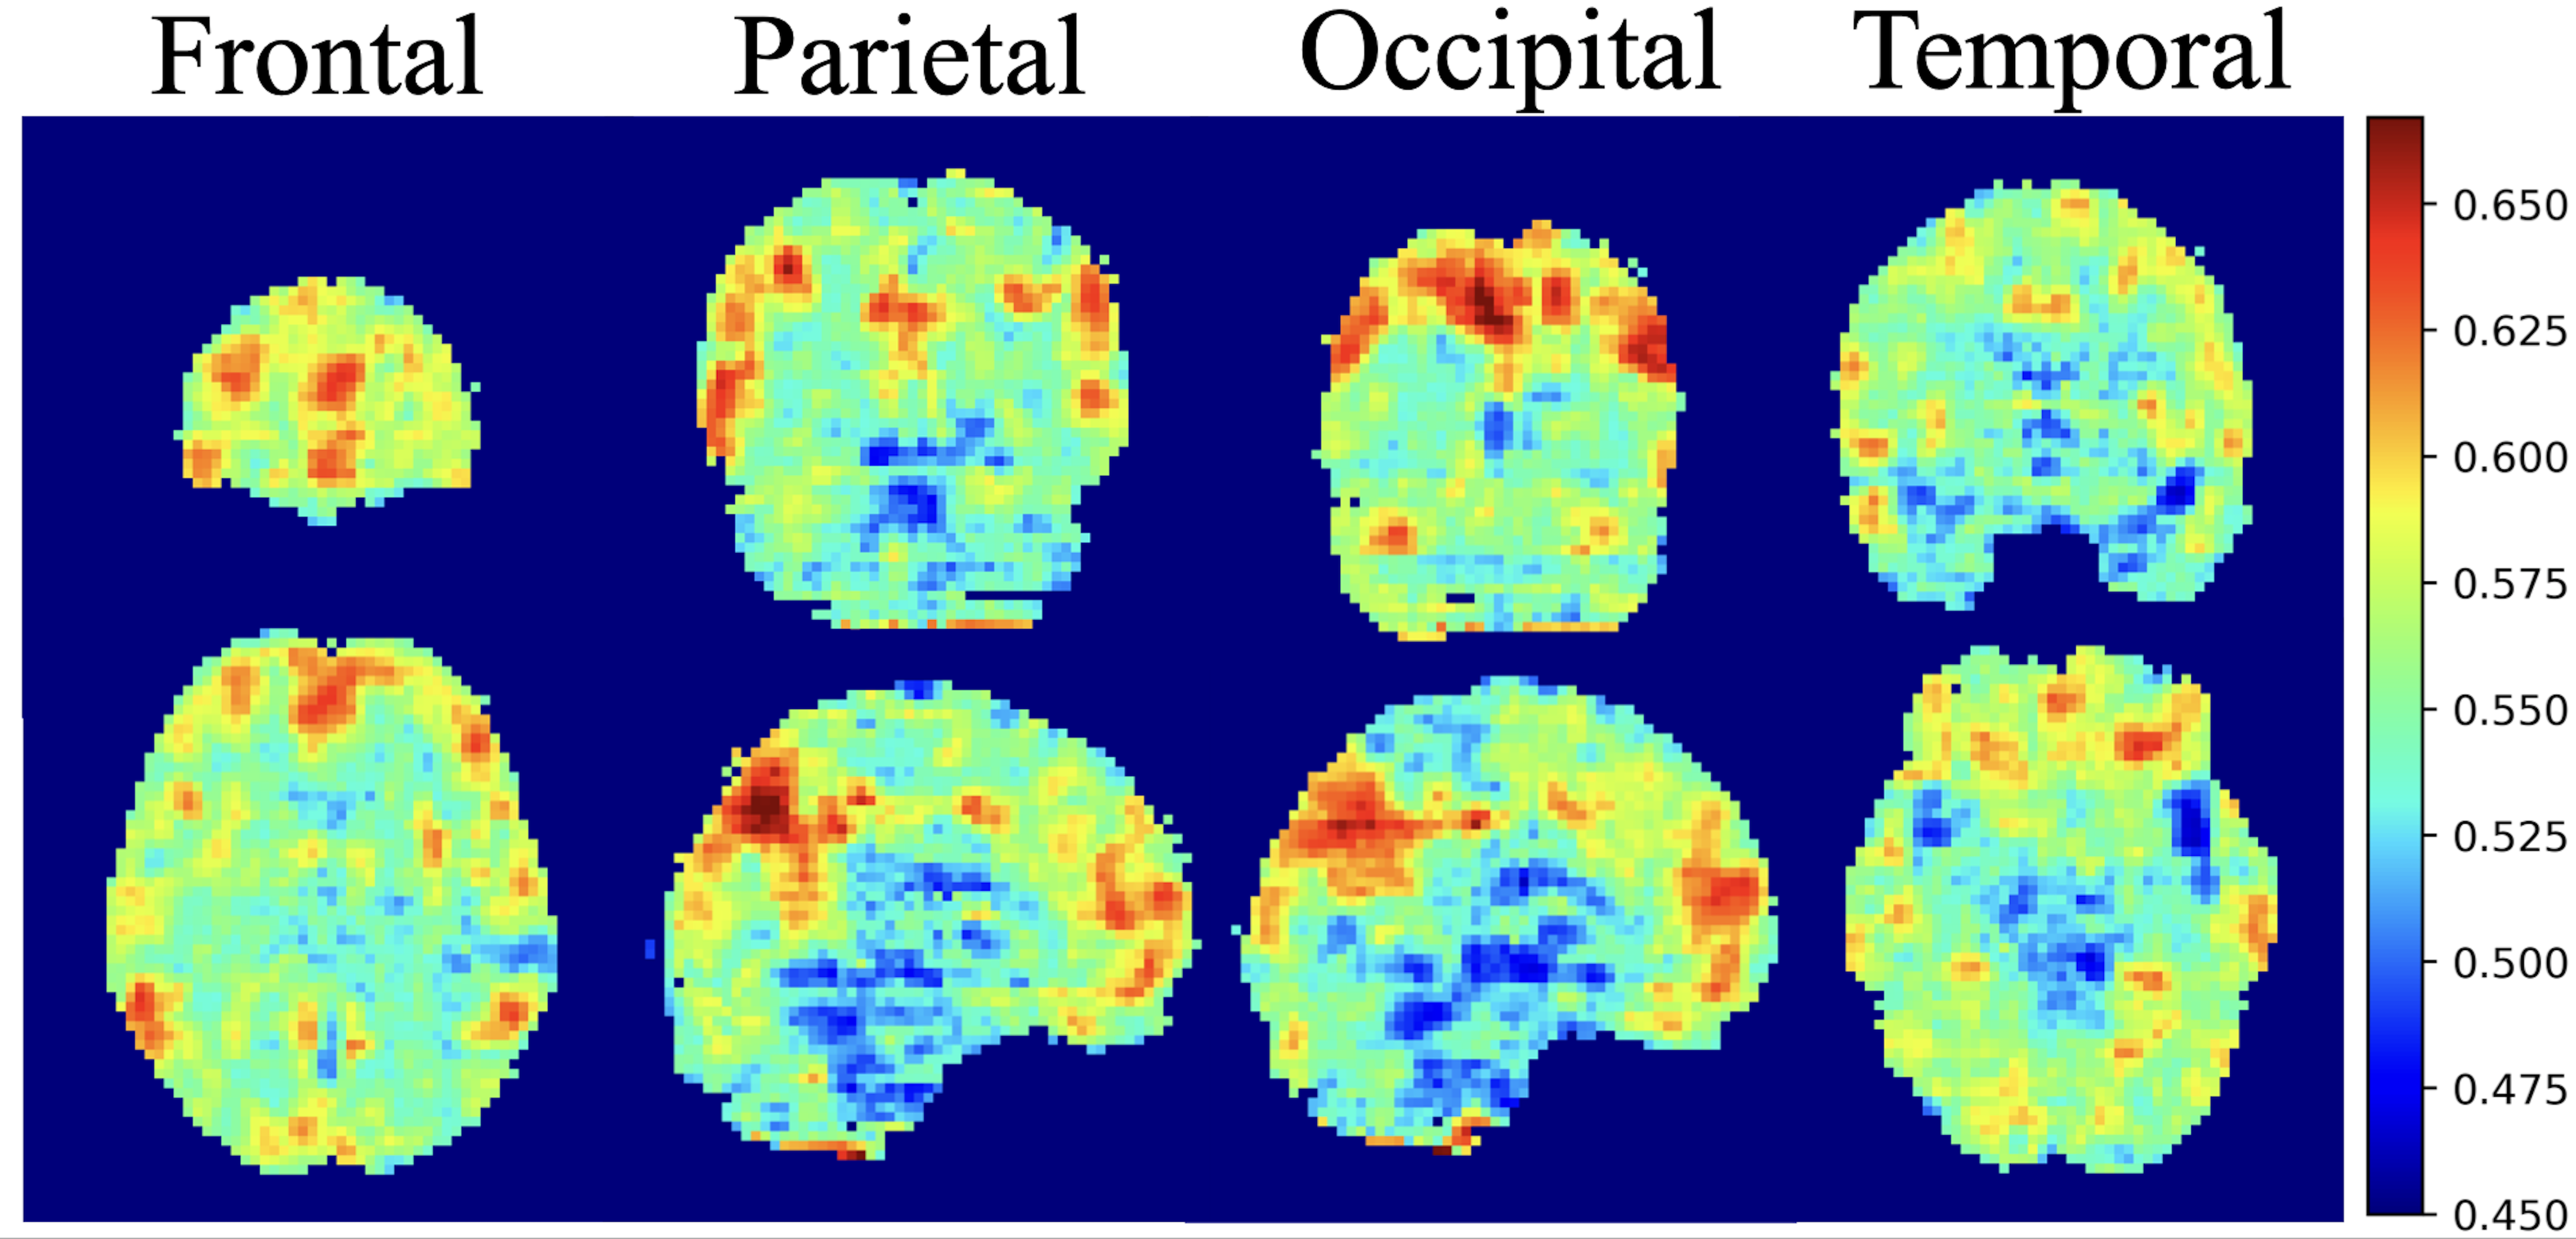
In the SE-ResNet-50 model, the average accuracy was 80%, with 78% precision, and 70% recall; on the other hand, the SE-DenseNet-121 model produced similar results with an average 80% accuracy, 86% precision and 80% recall. Both of these models produced similar results at the end of the epochs, with SE-ResNet-50 achieving slightly better performance than SE-DenseNet-121. We implemented a receiver operating characteristic curve (ROC curve) for each model to understand how an individual model performed (Fig. 1). The mean AUCs for SE-ResNet-50 and SE-DenseNet-121 were 0.72 and 0.87 with standard deviations of 0.09 and 0.06, respectively. The overall mean integrated gradients indicated that the predictions of postchemotherapy survivors were based on the value for the gray matter (Fig. 2). The greatest contributions were observed in the frontal, temporal, parietal, and occipital lobes, which represented the most crucial voxels for distinguishing postchemotherapy survivors (Fig. 3).Discussion
In this study, an intriguing result was that the identified cerebral regions were very similar to the components of the default mode network (DMN) 6. The DMN likely plays a critical role in CICI and can be regarded as a potential biomarker for distinguishing patients who may suffer from CICI 7. Another discovery that is consistent with our previous finding is the alteration in the dorsal attention network (DAN) 8. A longitudinal study also examined breast cancer survivors one month and one year after the completion of chemotherapy. DAN alterations were observed one month after chemotherapy but partially recovered at one year postchemotherapy, suggesting that the change in the DAN may potentially be related to cognitive impairment after receiving chemotherapy 9. Overall, the critical regions highlighted by the integrated gradients algorithm are consistent with our previous findings and are supported by other studies. We propose that our model is reliable and that these critical regions are trustworthy references for doctors in real clinical situations.Conclusion
In this study, we constructed two state-of-the-art volumetric models that can identify chemo-brains from normal brains. We also use an integrated gradients algorithm to visualize the pattern that was recognized by our model. The visual patterns that were shown in this study are consistent with our previous results and with other studies. We hope that these results will be helpful in clinically tracking chemo-brain in the future.Acknowledgements
This study was supported by the research grant MOST107-2221-E-182-054-MY3 from the Ministry of Science and Technology, Taipei, Taiwan.References
1. Siegel, R. L.; Miller, K. D.; Jemal, A., Cancer statistics, 2020. CA Cancer J Clin 2020, 70 (1), 7-30.
2. Argyriou, A. A.; Assimakopoulos, K.; Iconomou, G.; Giannakopoulou, F.; Kalofonos, H. P., Either Called "Chemobrain'' or "Chemofog,'' the Long-Term Chemotherapy-Induced Cognitive Decline in Cancer Survivors Is Real. J Pain Symptom Manag 2011, 41 (1), 126-139.
3. Hermelink, K., Chemotherapy and Cognitive Function in Breast Cancer Patients: The So-Called Chemo Brain. J Natl Cancer Inst Monogr 2015, 2015 (51), 67-9.
4. Abadi, M.; Barham, P.; Chen, J.; Chen, Z.; Davis, A.; Dean, J.; Devin, M.; Ghemawat, S.; Irving, G.; Isard, M. In Tensorflow: A system for large-scale machine learning, 12th symposium on operating systems design and implementation, 2016; pp 265-283.
5. Chollet, F., Keras (2015). 2017.
6. Raichle, M. E.; MacLeod, A. M.; Snyder, A. Z.; Powers, W. J.; Gusnard, D. A.; Shulman, G. L., A default mode of brain function. Proc Natl Acad Sci U S A 2001, 98 (2), 676-82.
7. Kesler, S. R., Default mode network as a potential biomarker of chemotherapy-related brain injury. Neurobiol Aging 2014, 35, S11-S19.
8. Shen, C. Y.; Chen, V. C.; Yeh, D. C.; Huang, S. L.; Zhang, X. R.; Chai, J. W.; Huang, Y. H.; Chou, M. C.; Weng, J. C., Association of functional dorsal attention network alterations with breast cancer and chemotherapy. Sci Rep 2019, 9(1), 104.
9. Dumas, J. A.; Makarewicz, J.; Schaubhut, G. J.; Devins, R.; Albert, K.; Dittus, K.; Newhouse, P. A., Chemotherapy altered brain functional connectivity in women with breast cancer: a pilot study. Brain Imaging Behav 2013, 7 (4), 524-32.
Figures