3185
MRS Denoising Model: ReLSTM-Net Trained by few In vivo Measured Data1Department of Electronic Science, National Institute for Data Science in Health and Medicine, Xiamen University, Xiamen, China, 2Healthcare, Philips, Beijing, China, 3School of Computer and Information Engineering, Xiamen University of Technology, Xiamen, China, 4Department of Radiology, The Zhongshan Hospital affiliated to Xiamen University, Xiamen, China
Synopsis
1H Magnetic Resonance Spectroscopy (MRS) suffers low Signal-Noise Ratio (SNR) due to low concentrations of metabolites. To improve the SNR, the current mainstream is to do Signal Averaging with repeated samplings but it is time-consuming. Therefore, we designed a novel denoising ReLSTM-Net to learn the mapping from the low SNR MRS to the high SNR one in the time-domain by a few in vivo measured data. Denoised spectra by the proposed method has higher accuracy and reliability in quantifying metabolites Glx, tCho and mI, compared with the state-of-art Low-Rank method.
Purpose
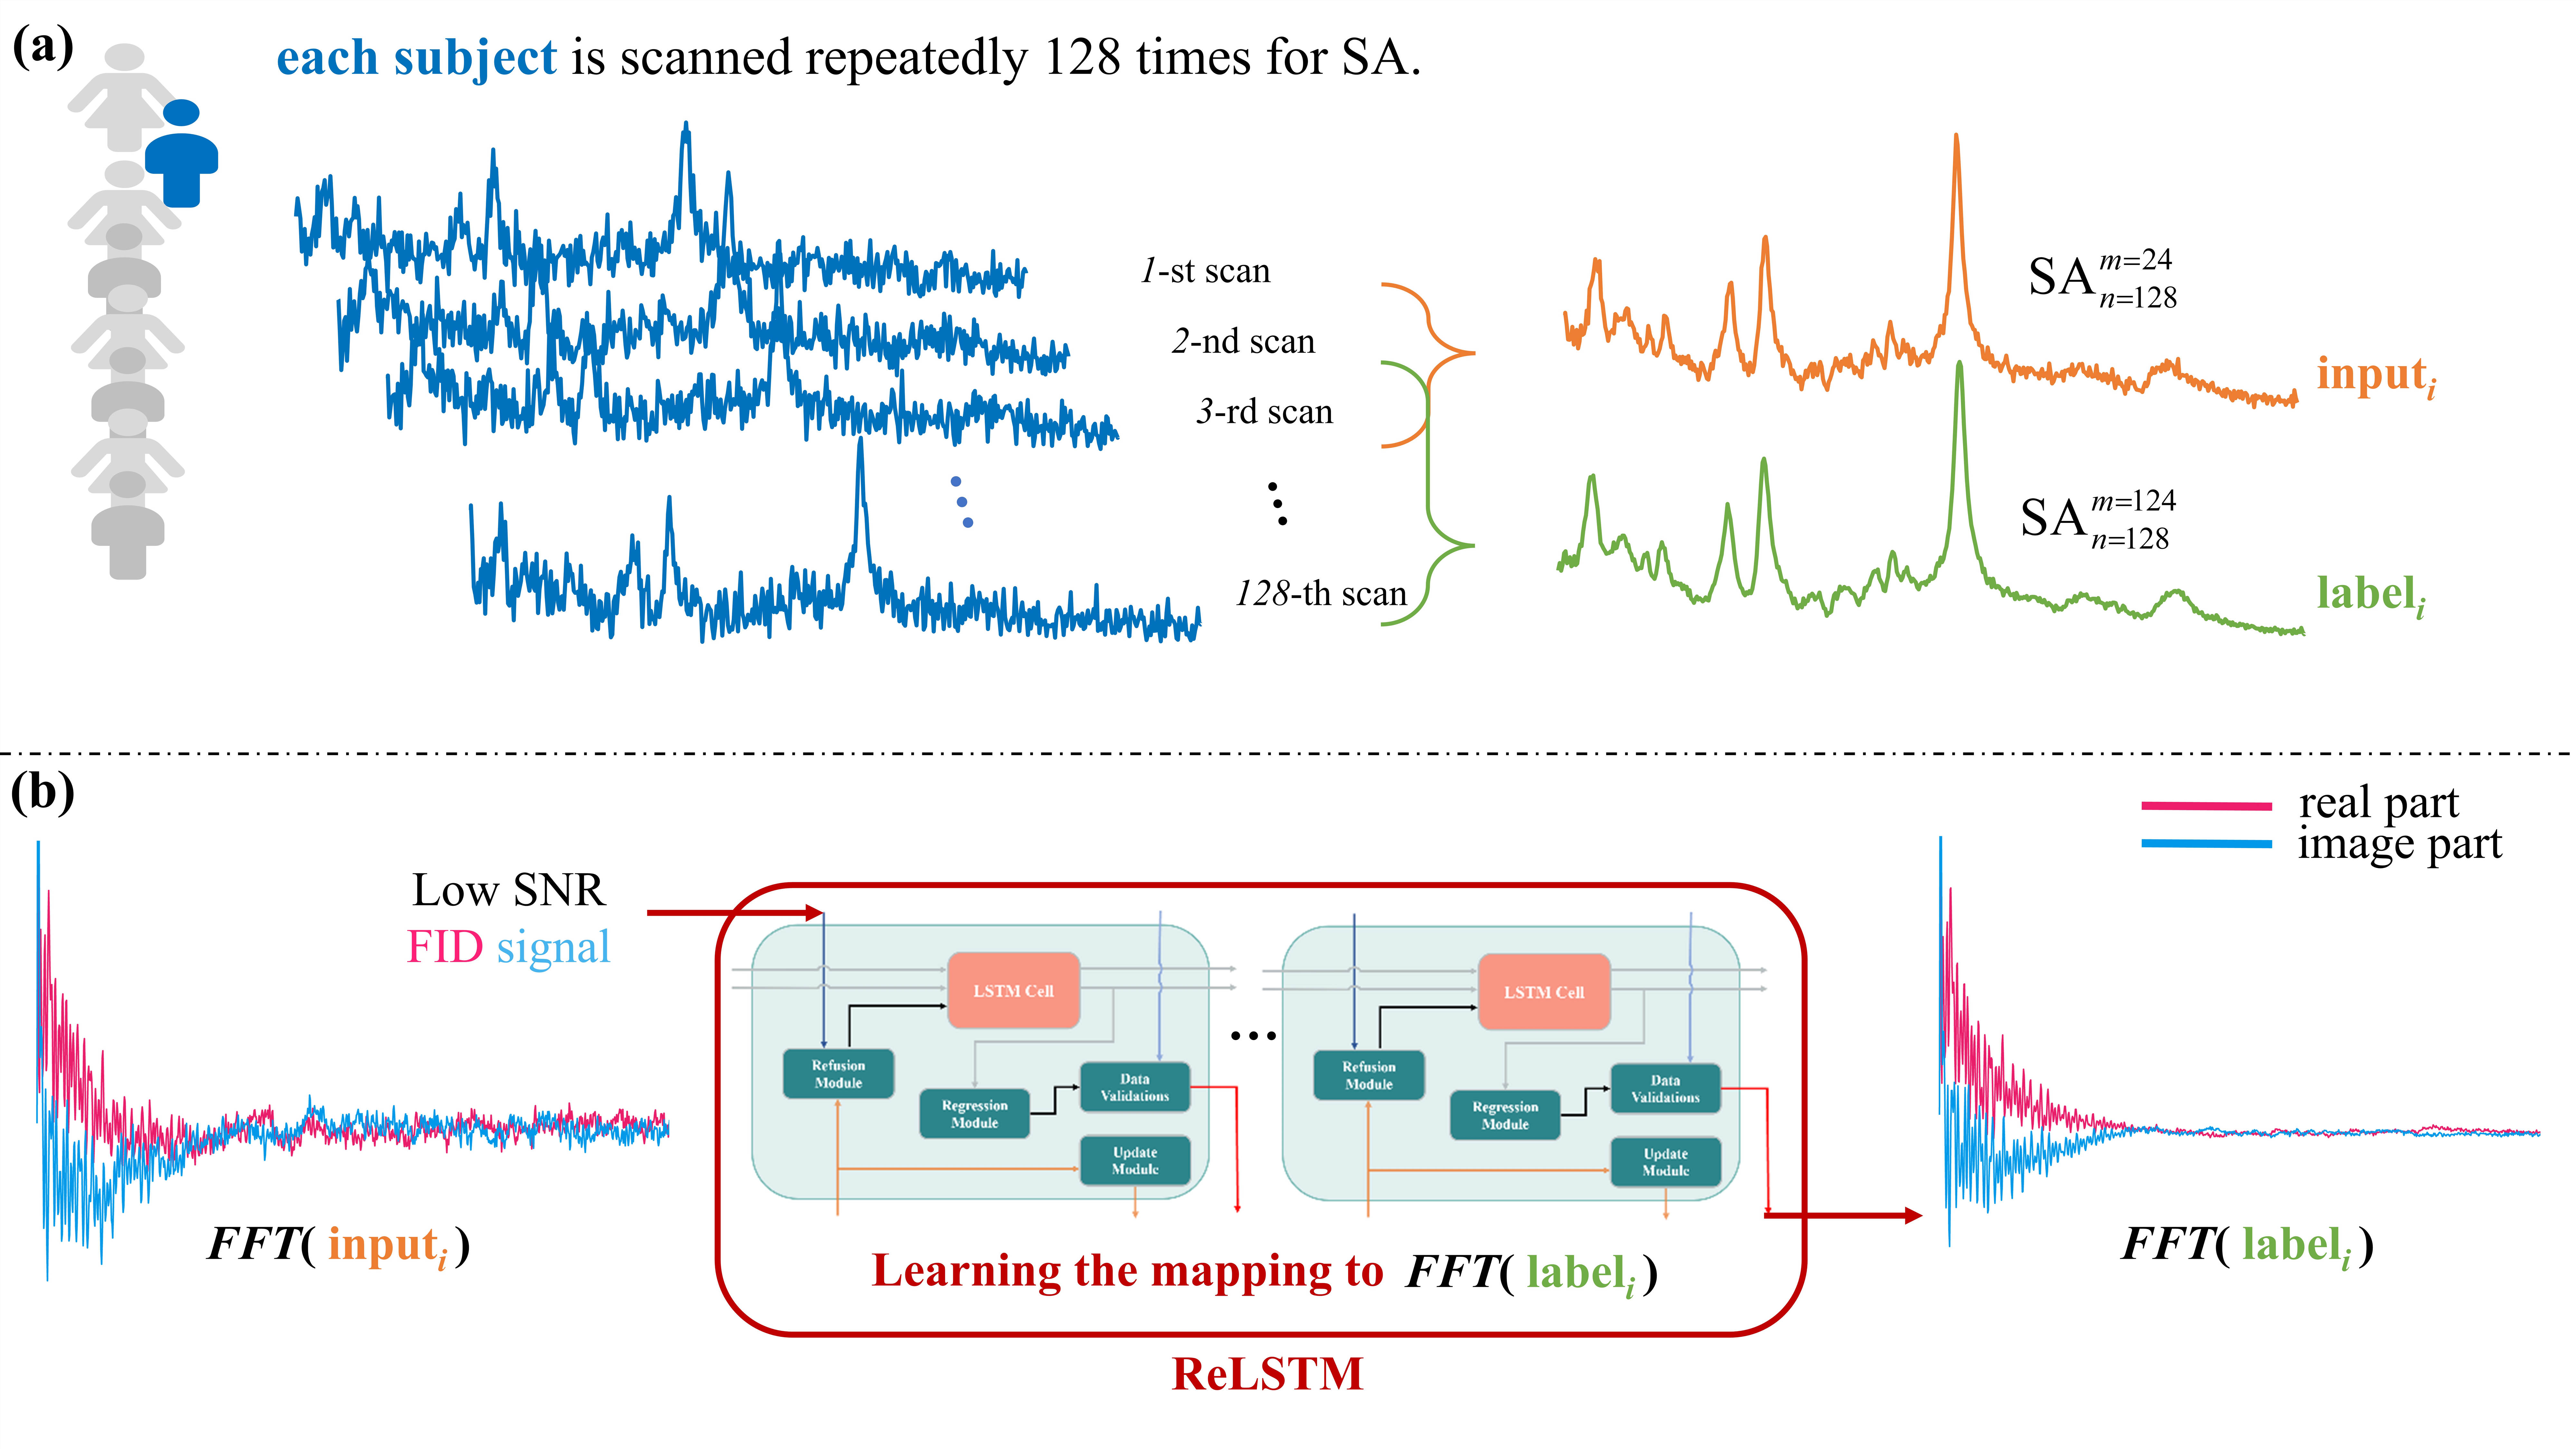
MRS is an examination method to determine molecular composition. As a non-invasive technique, it provides a quantitative analysis of metabolites in brains1-4. However, for the in vivo brain spectrum, the Signal-Noise Ratio (SNR) is relatively low due to the low concentrations of metabolites and spectral dispersions associated with magnetic field strength, signal suppression, phased array coils and localization sequences5-6, leading to the difficulty in the further metabolic quantification and analysis7-8. To gain the efficient SNR, MRS is commonly sampled repeatedly many times and then averaged which is called Signal Averaging(SA)9-10. However, repeated samplings will lengthen the total acquisition time as it increases linearly with the number of repeats n. Denoising for the small number of SA is the tradeoff between SNR and acquisition time. Therefore, we designed a novel deep learning model, Refusion Long Short-Term Memory (ReLSTM), which learns the denoising mapping from the low SNR MRS (n=24 SA) to the high SNR one (n=124 SA) by a few in vivo measured data. And the proposed method could reduce about 50% (from about 12 minutes to 6 minutes) data acquisition time with high fidelity denoising.Method
Data Augmentation: Generally, deep learning training requires a huge amount of data. Instead of using the simulated data as training data, we generated different SNR training pairs by randomly selecting different numbers of SA in the in vivo experimental MRS data, which are more efficiently to capture the variations in practical experiments. Specifically, we randomly selected m=24 repeated samplings out of total scans n=128 and averaged them as one low SNR inputi ($$$\mathbf{SA} _{128}^{24}$$$), and the corresponding high SNR labeli ($$$\mathbf{SA} _{128}^{124}$$$) was generated by averaging 124 samplings randomly selected from total scans n=128 (Figure. 1(a)). According to the above augmentation, we generated 1000 training pairs (inputi, labeli), i=1,2,3,4,…,1000 from each raw measured MRS. Totally 25 in vivo measured MRS was selected and we generated 25000 (25×1000) training pairs for training the deep learning model.Network Design: An modified Long Short-Term Memory (LSTM) was applied in our time-domain MRS denoising. To compensate for the loss of signal intensity with the classical LSTM, we designed a Refusion mechanism and Data Validations module, and embedded them into the classical LSTM (Figure. 1(b)), which is named ReLSTM.
Results
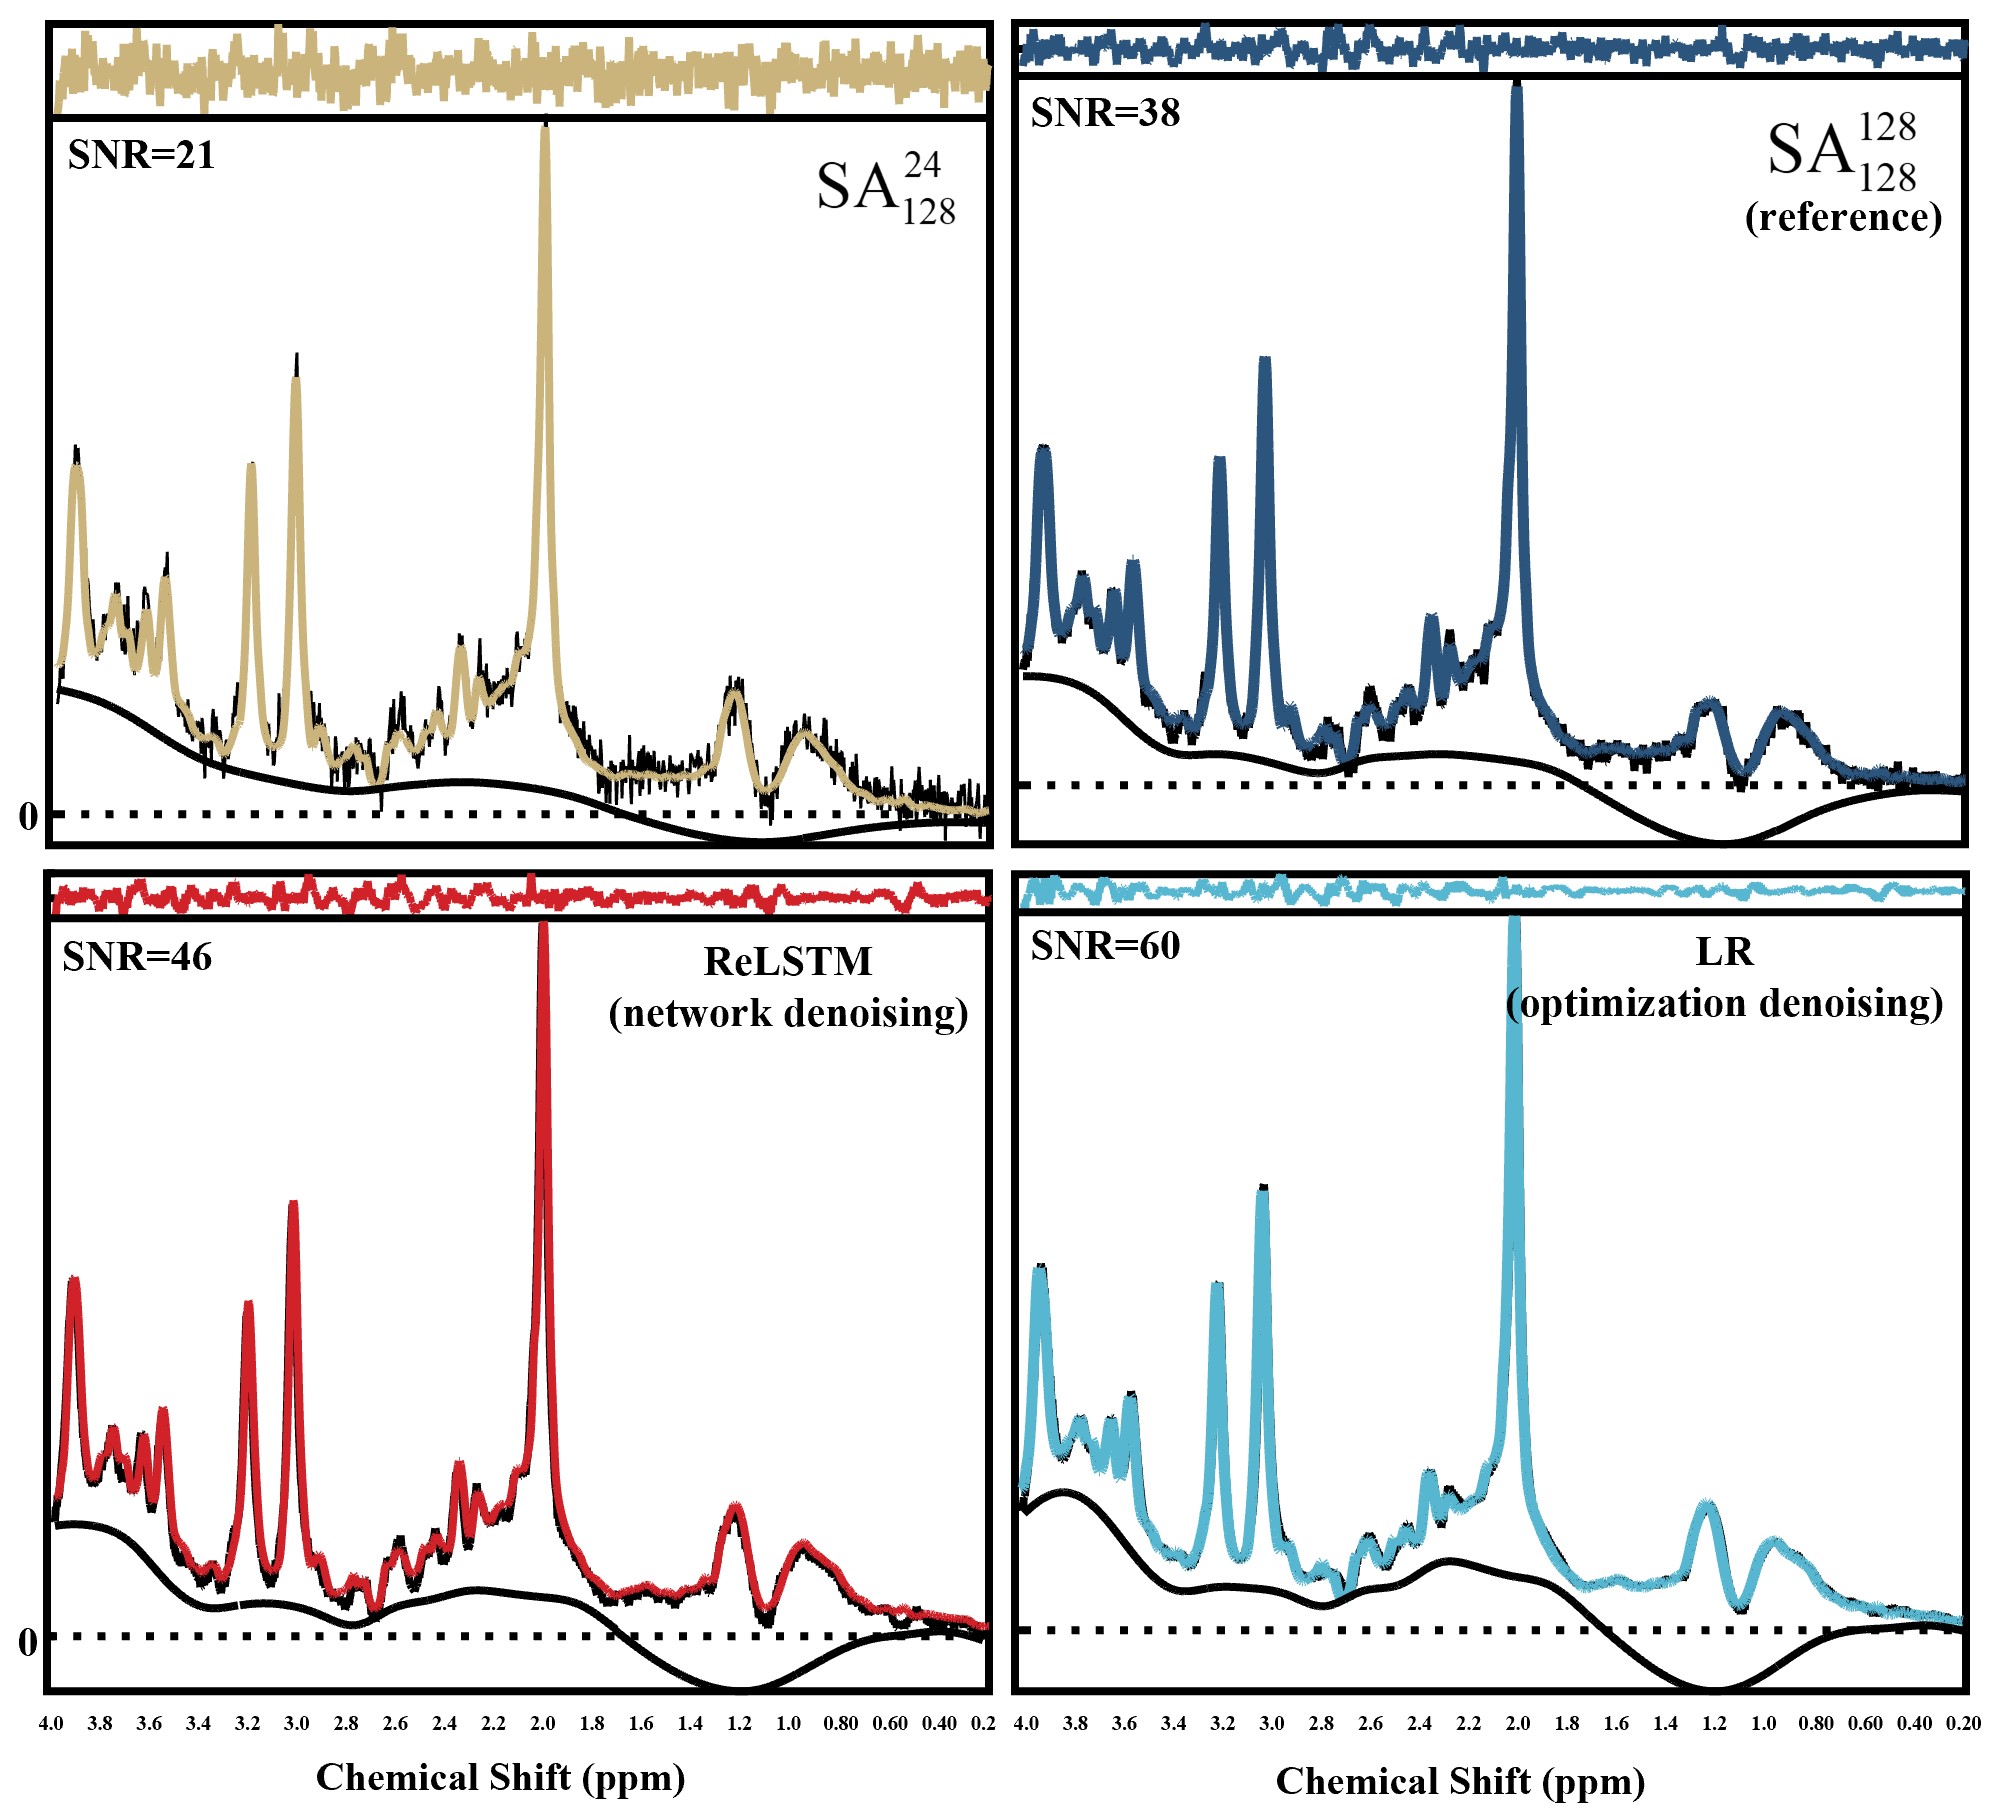
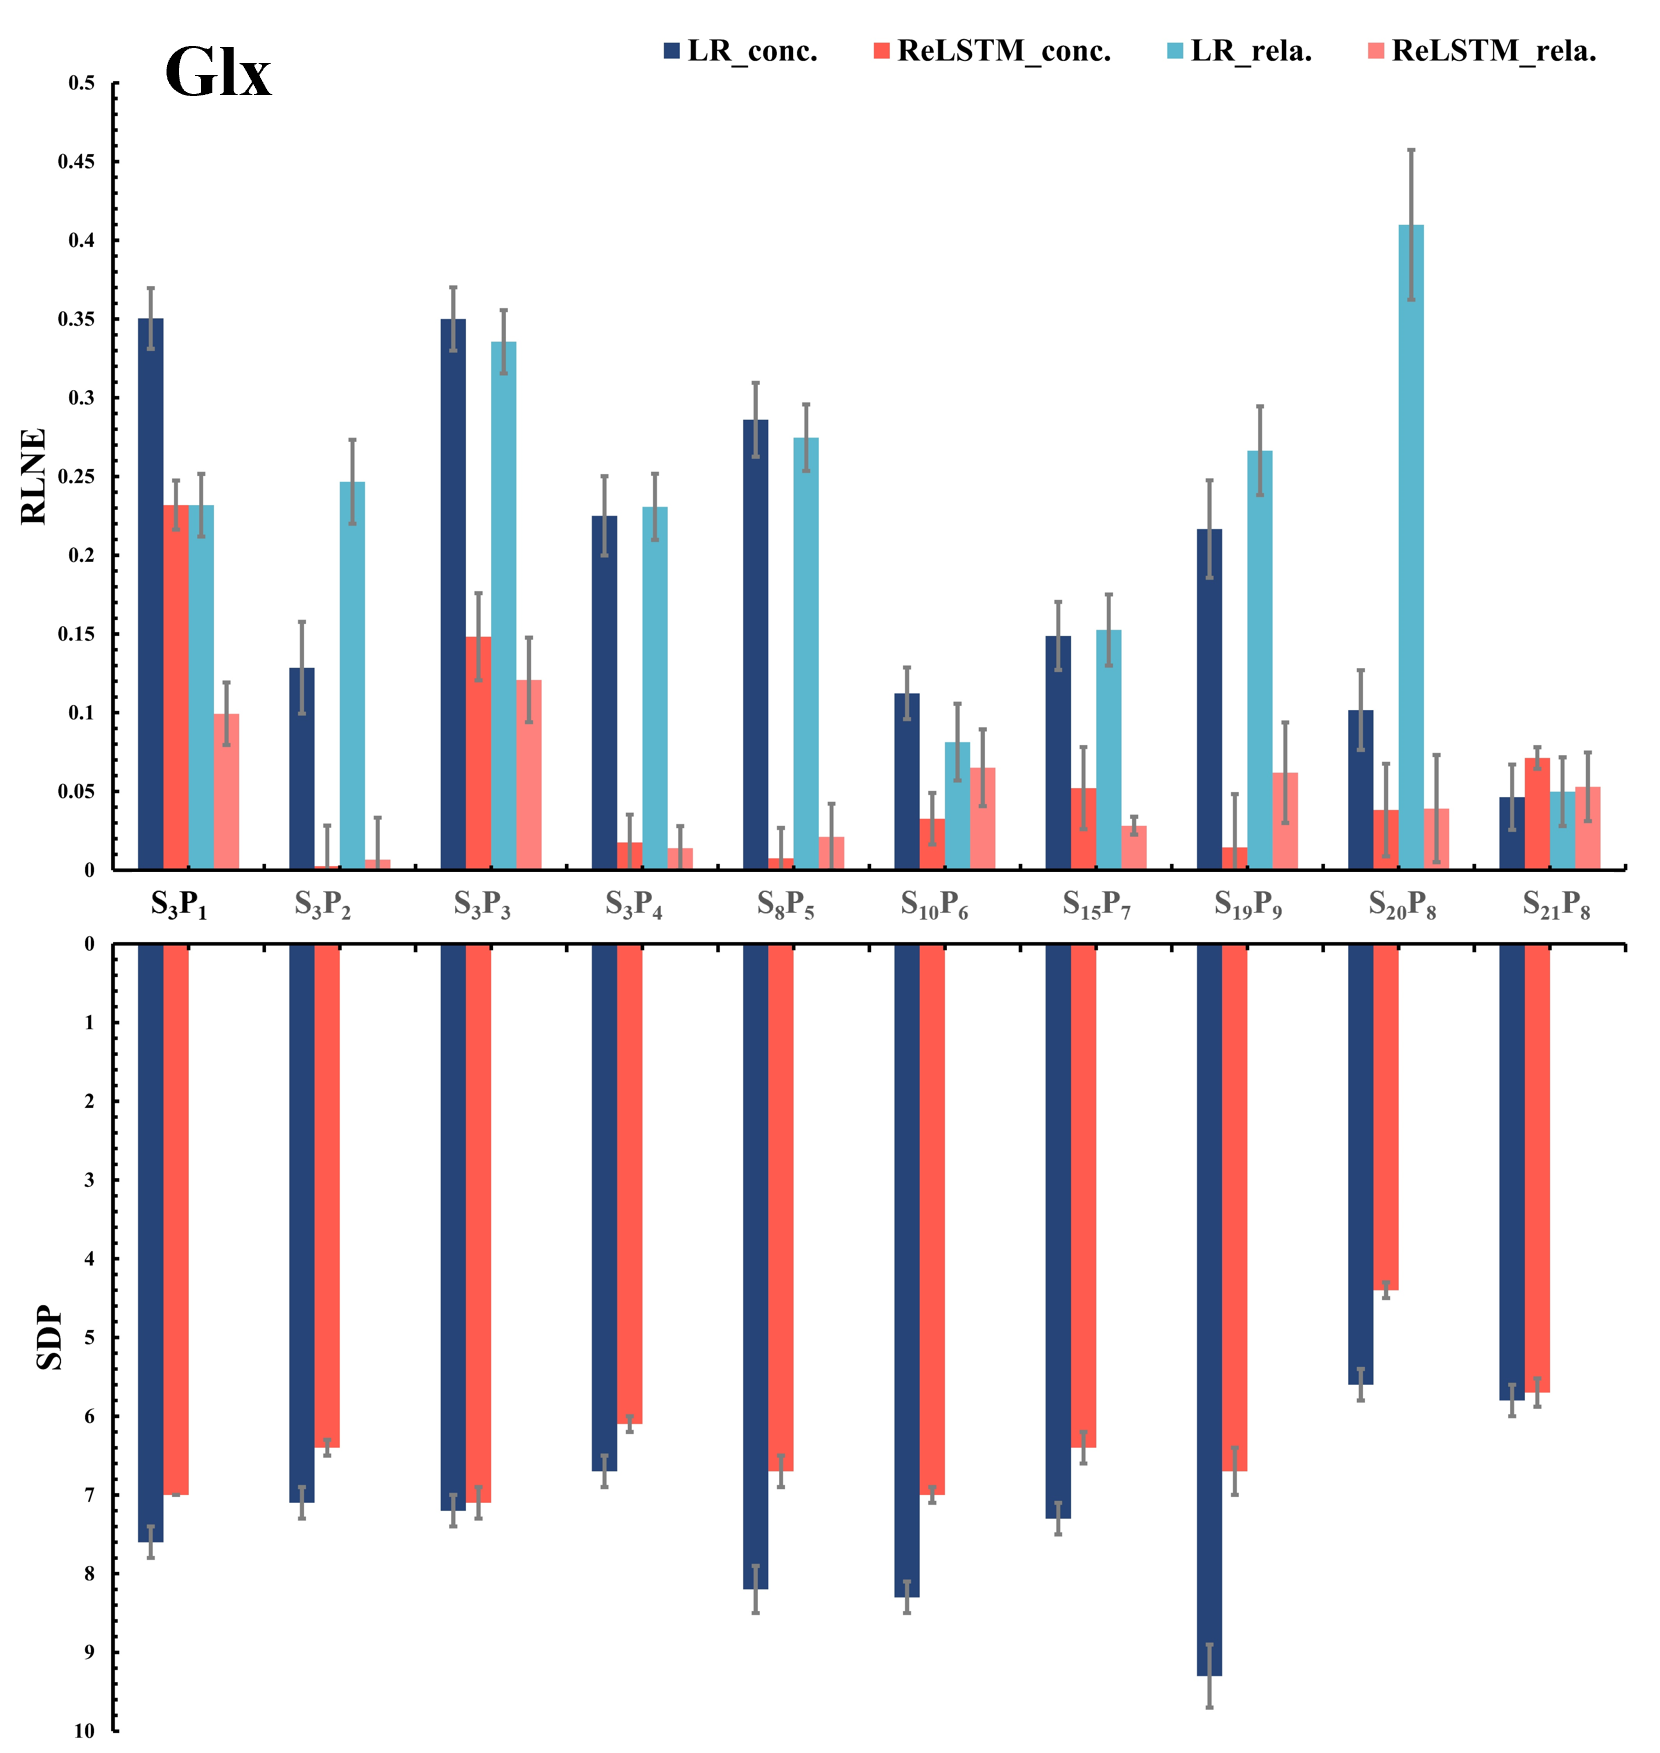
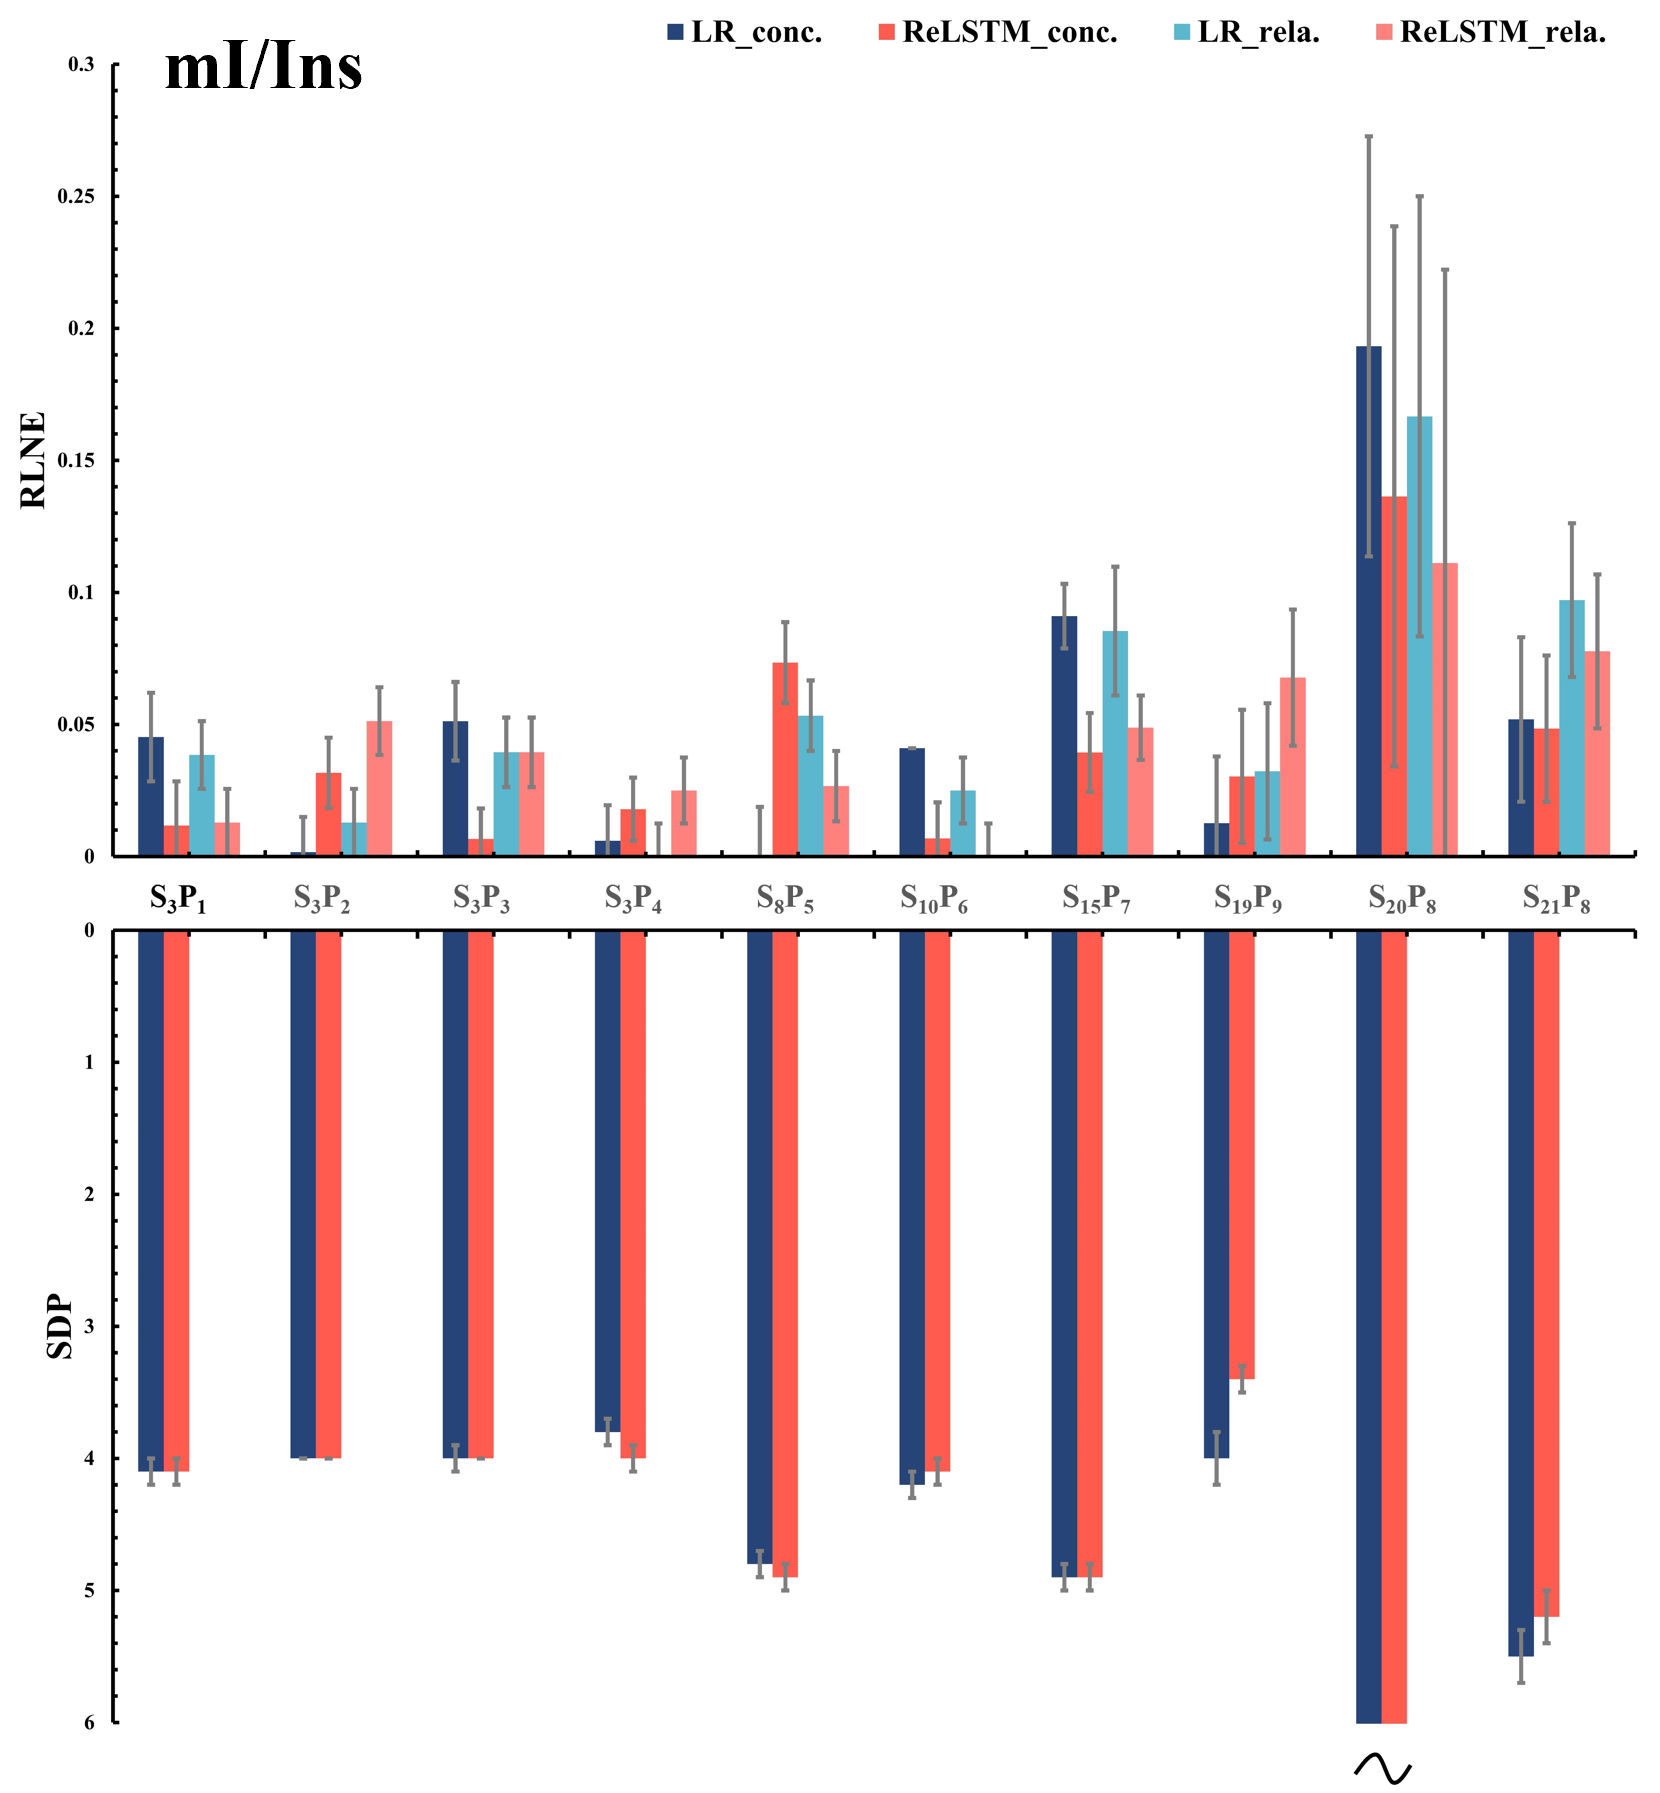
The denoised spectra are shown in Figure 2, which illustrated that ReLSTM is closer to the $$$\mathbf{SA} _{128}^{128}$$$ in the SNR improvement but lower than Low-Rank (LR) method. And LCModel11 quantitative results for 10 in vivo MRS including 4 frontal lobes(S3P1-4),1 occipital lobe(S8P5),1 parietal lobe(S10P6), 1 posterior cingulate cortex(S15P7) and 3 lesion regions(S19- S21) are shown in Figure 3-5, which are found that compared with the LR, our method has lower RLNE(Relative L2 Norm Error) and SDP(Standard Deviations Percentage using CRLB) in quantifying metabolites Glx (9 in 10), tCho (6 in 10) and mI (6 in 10).Conclusions
We designed a novel deep learning denoising model ReLSTM which learns a time-domain mapping from the low SNR MRS (n=24 SA) to the high SNR one (n=124 SA) by a few in vivo measured data. 7 different healthy subjects’ brains and 3 patients’ lesion region MRS experiments show that compared with the state-of-the-art LR denoising method, ReLSTM has higher accuracy and reliability in quantifying metabolites Glx, tCho and mI. and comparable quantitative results in NAA andCr. The potential robustness of the proposed ReLSTM against low SNR MRS allow a fast single-voxel MRS acquisition of the human brain with 50% (from about 12 minutes to 6 minutes) acquisition time saving, which may be an important technical development for clinical studies.Acknowledgements
This work was supported in part by the National Natural Science Foundation of China under grants 62122064, 61971361, 61871341, and 61811530021, the National Key R&D Program of China under grant 2017YFC0108703, and the Xiamen University Nanqiang Outstanding Talents Program.
The correspondence should be sent to Prof. Xiaobo Qu (Email: quxiaobo@xmu.edu.cn)
References
[1] Arnold JT, Dharmati S, Packard ME, "Chemical effects on nuclear induction signals from organic compounds," J. Chem. Phys., vol. 19, no. 4, pp. 507-507, 1951.[2] [Cresshull ID, Gordon RE, Hanley PE, et al., "Localization of metabolites in animal and human tissue using ³¹P topical magnetic resonance, " Bull. Magnet. Reson., vol. 5, no. 2, pp. 299-299, 1981.
[3] Proctor WG, Yu FC, "The dependence of a nuclear magnetic resonance frequency upon chemical compound," Phys. Rev., vol. 77, no. 5, pp. 717-717, 1950.
[4] Ross BD, Radda GK, Gadian DG, et al., "Examination of a case of suspected McArdle's syndrome by ³¹P nuclear magnetic resonance," N Engl. J. Med., vol. 304, no. 22, pp. 1338-1342, 1981.
[5] Howard B B , Linder B , Emerson M T, "Effect of Dispersion Interaction on Nuclear Magnetic Resonance Shifts," J. Chem. Phys., vol. 36, no. 2, pp. 485-490, 1962.
[6] Cecil K M, "Proton Magnetic Resonance Spectroscopy: Technique for the Neuroradiologist, " Neuroimag. Clin. N. Am., vol. 23, no.3, pp. 1052-5149, 2013.
[7] Poullet JB, Sima DM and Van Huffel S, "MRS signal quantitation: a review of time-and frequency-domain methods," J. Magn. Reson., vol. 195, no. 2, pp. 134-144, 2008.
[8] Provencher SW, "Estimation of metabolite concentrations from localized in vivo proton NMR spectra," Magn. Reson. Med., vol. 30, no. 6, pp. 672-679, 1993.
[9] Valaparla SK, Ripley EM, et al., Clarke, "Evaluation of vastus lateralis muscle fat fraction measured by two-point Dixon water-fat Imaging and 1H-MRS," in Proc. Intl. Soc. Mag. Reson. Med, vol. 22, p. 1221, 2014.
[10] Choi C,Ganji SK, et al., "Measurement of glycine in the human brain in vivo by 1H‐MRS at 3 T: application in brain tumors," Magn. Reson. Med., vol. 66, no. 3, pp. 609-618, 2011.
[11] Provencher SW, "Automatic quantitation of localized in vivo 1H spectra with LCModel," NMR Biomed., vol. 14, no. 4, pp. 260-264, 2001.
Figures
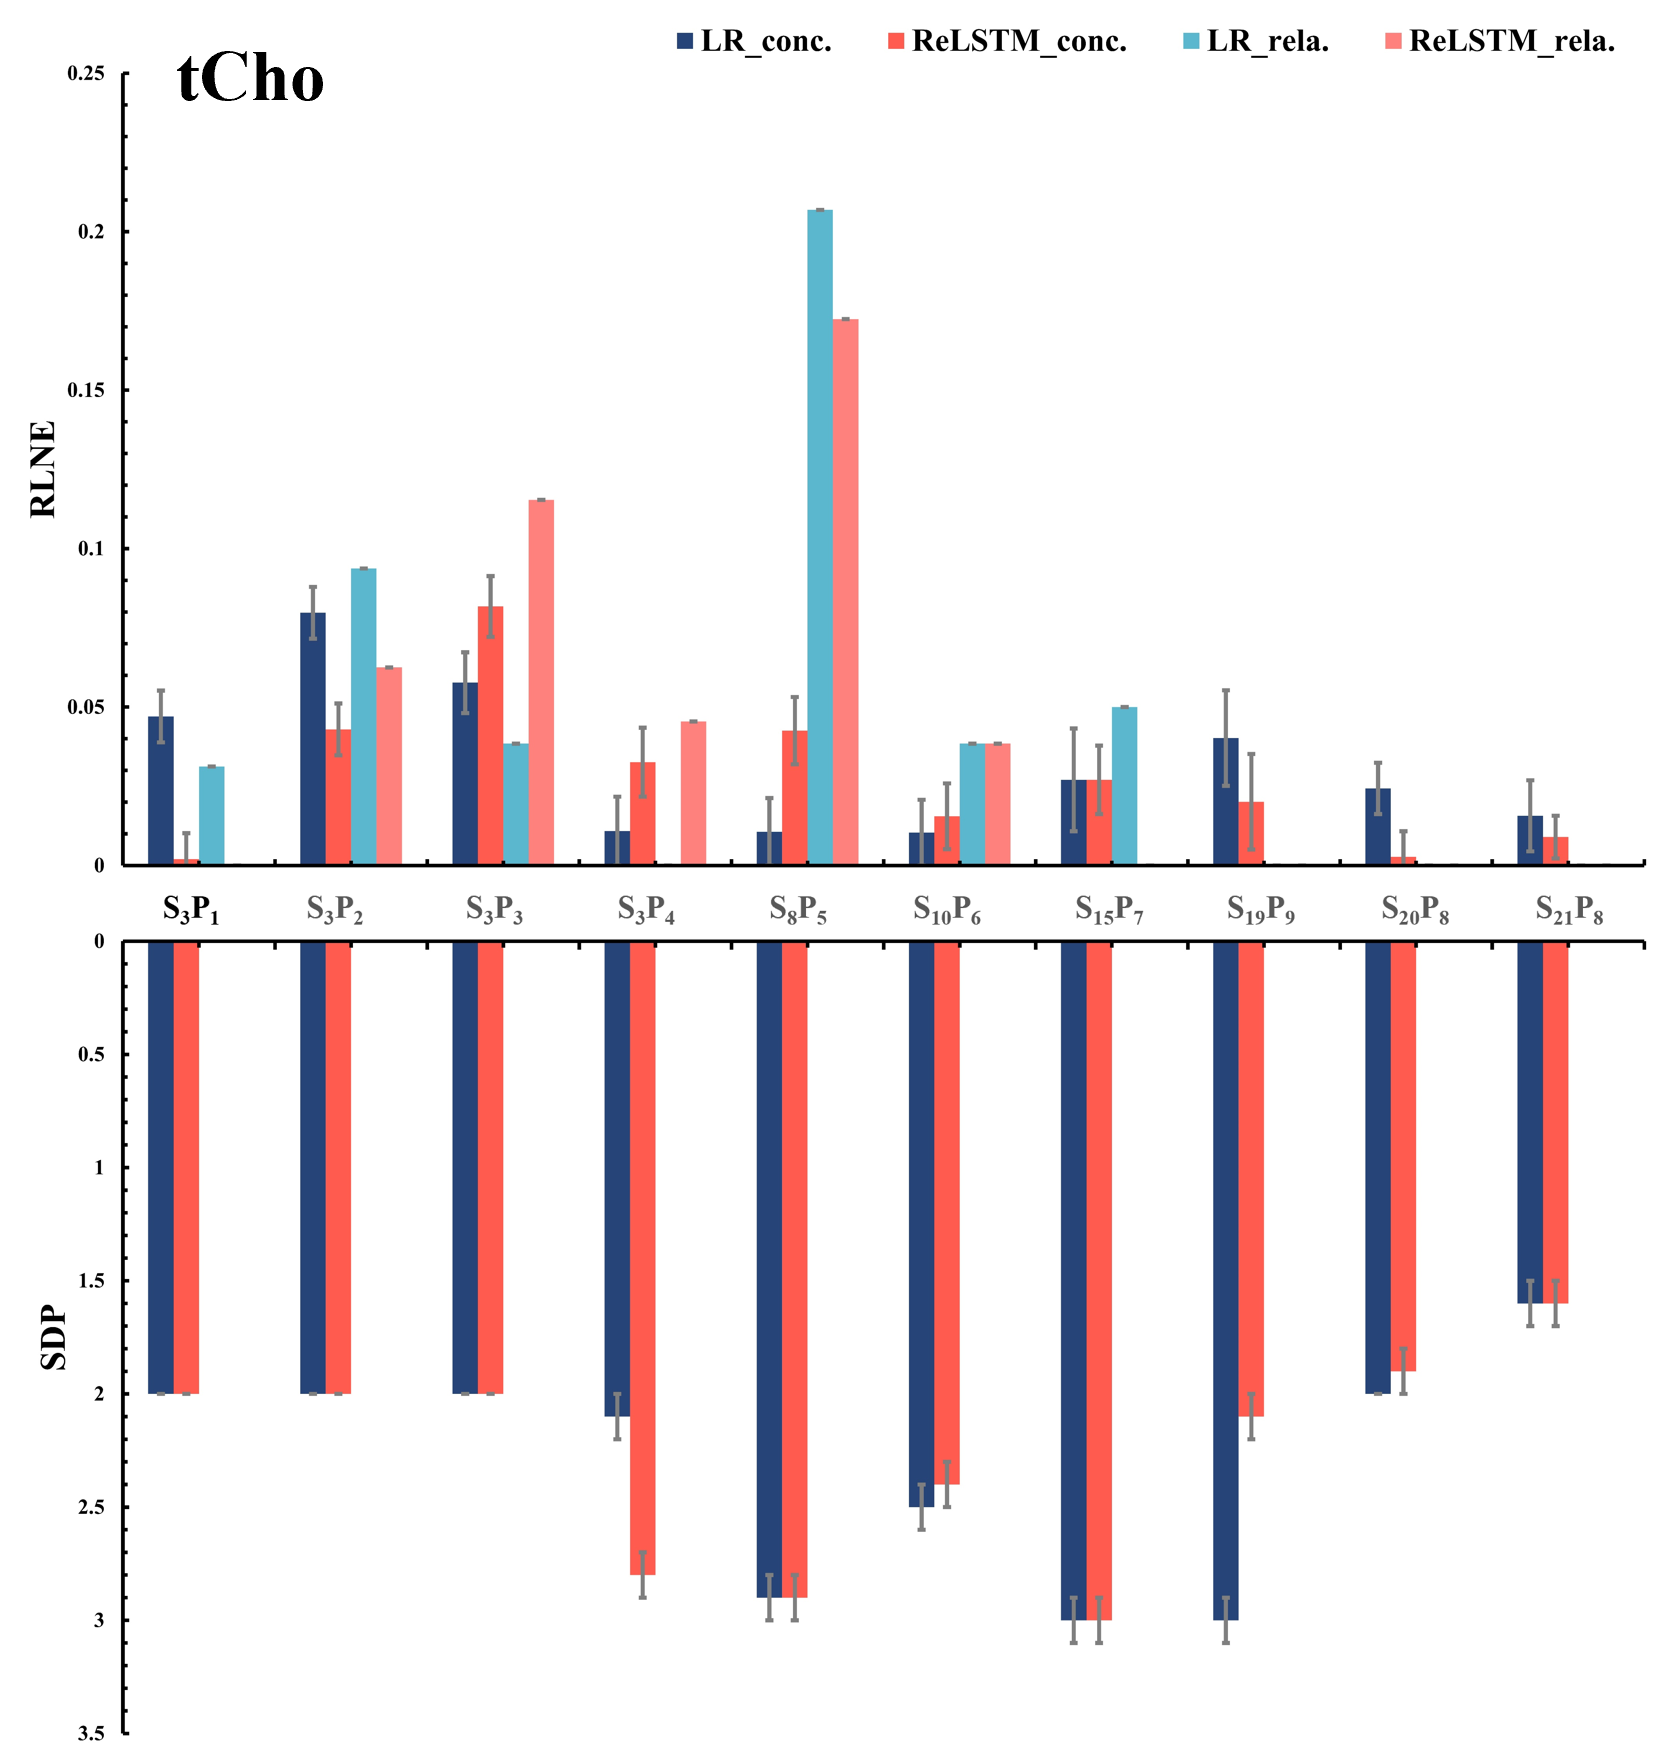
LCModel quantitative results of denoised spectra from SA24128 for tCho (total Choline).