3182
Fast Magnetic Resonance Imaging by Deep Learning the Sparsified Complex Data1Hangzhou Dianzi University, Hangzhou, China, 2University of British Columbia, Vancouver, BC, Canada
Synopsis
In this study, we exploited a sparsifying deep learning method and an inverse filtering reconstruction to obtain high quality complex MR images for under-sampled MRI data. This study allows much more flexible data representations for complex MRI data training, leading to significantly higher complex reconstruction quality for practical MRI applications.
Purpose
To reconstruct high quality complex images for fast magnetic resonance imaging (MRI) with under-sampled k-space data by using a sparsified deep learning method and an inverse filtering reconstruction.Methods
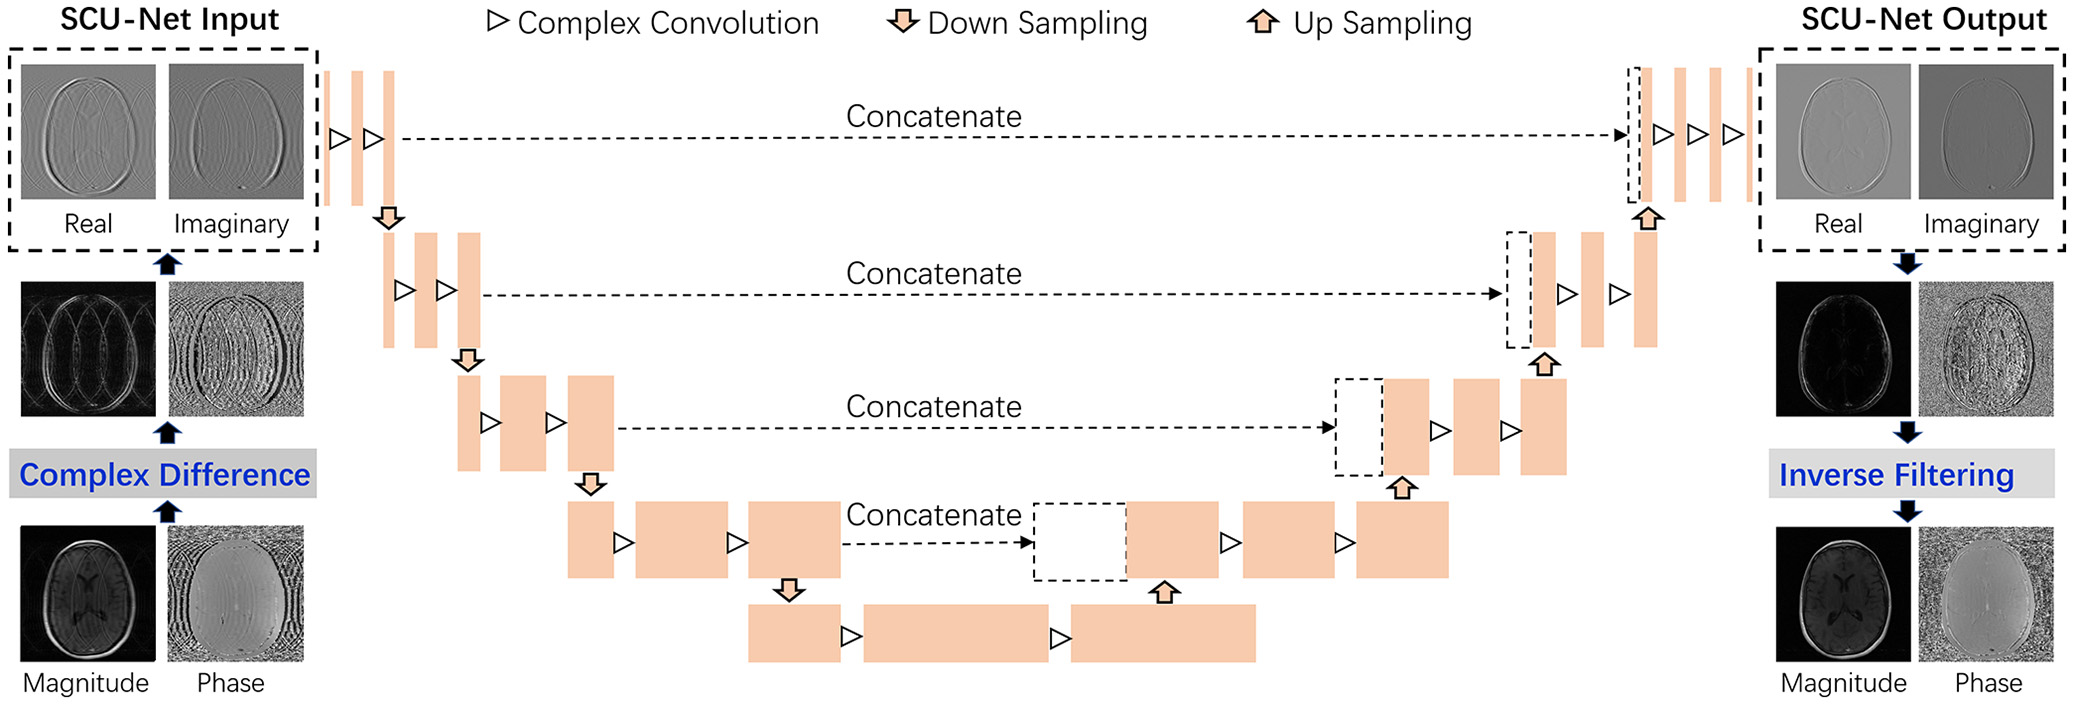
Regular under-sampling except near the center of k-space was retrospectively performed on fully sampled k-space data S(kx, ky), which was followed by zero-filling iDFT (inverse Discrete Fourier Transform) reconstruction to obtain aliased complex images with ghosts. A CDT (complex difference transform) operation was performed along PE (Phase Encoding) direction in image domain to obtain sparsified ghosted-edge images1.Complex U type architecture for CNN (CU-Net) was constructed and extended to support sparse complex data training and reconstruction (SCU-Net). SCU-Net architecture was composed of four encoder layers and four decoder layers (Fig. 1). Each encoder layer consisted of two complex convolution blocks (including complex convolution, complex batch normalization, and complex activation) and one complex pooling operation.
The input and output of SCU-Net were both sparsified complex edge images, as shown in dashed rectangular boxes in Fig.1. They both included two channels, one was real part of edge map Eu(x, y), denoted as Ereal(x, y), and the other was imaginary part of Eu(x, y), denoted as Eimag(x, y). Two output channels formed sparsified complex data to produce deghosted magnitude edge images and phase edge images, followed by an inverse filtering reconstruction to get final deghosted complex images E(x, y).
The edge map E(x, y) can be transformed into k-space by using a DFT (Discrete Fourier Transform) operation, followed by inverse filtering (Eq. [1]), $$ {\it iHP}({\it k_{y}})=\frac{1}{{\it exp}(-{j2\pi}\frac{\it k_y}{\it N_y})-1} \qquad [1]$$ replacing the inverse-filtered data with several fully sampled lines near k-space center to avoid “divided by zero” problem. Data consistency were performed to improve the predicted reconstruction. Finally, the updated k-space data were iDFT back into image space to yield the complex image I(x, y).
Totally 180 multi-coil k-space raw datasets of dimensions 320×640×16×16 were downloaded from https://fastmri.med.nyu.edu/ with the approval of the Institutional Review Board 2, 3. Virtual reference coil algorithm 4 was used to combine the reconstructed 16 coils complex images into a single-coil complex image, which was used as a fully sampled reference image in training. A total of 160×16 = 2560 images obtained from 160 datasets were used for training, and a total of 20×16 = 320 images were selected from remaining 20 datasets for testing.
For comparison, training and reconstructions were performed with three neural networks, namely CU-Net, FDCU-Net (1D finite difference module was added in CU-Net), and SCU-Net respectively. The codes were implemented using Python and Pytorch programming language on a personal computer with 16 GB RAM, 2.21 GHz CPU, and NVIDIA RTX2070 GPU.
Results
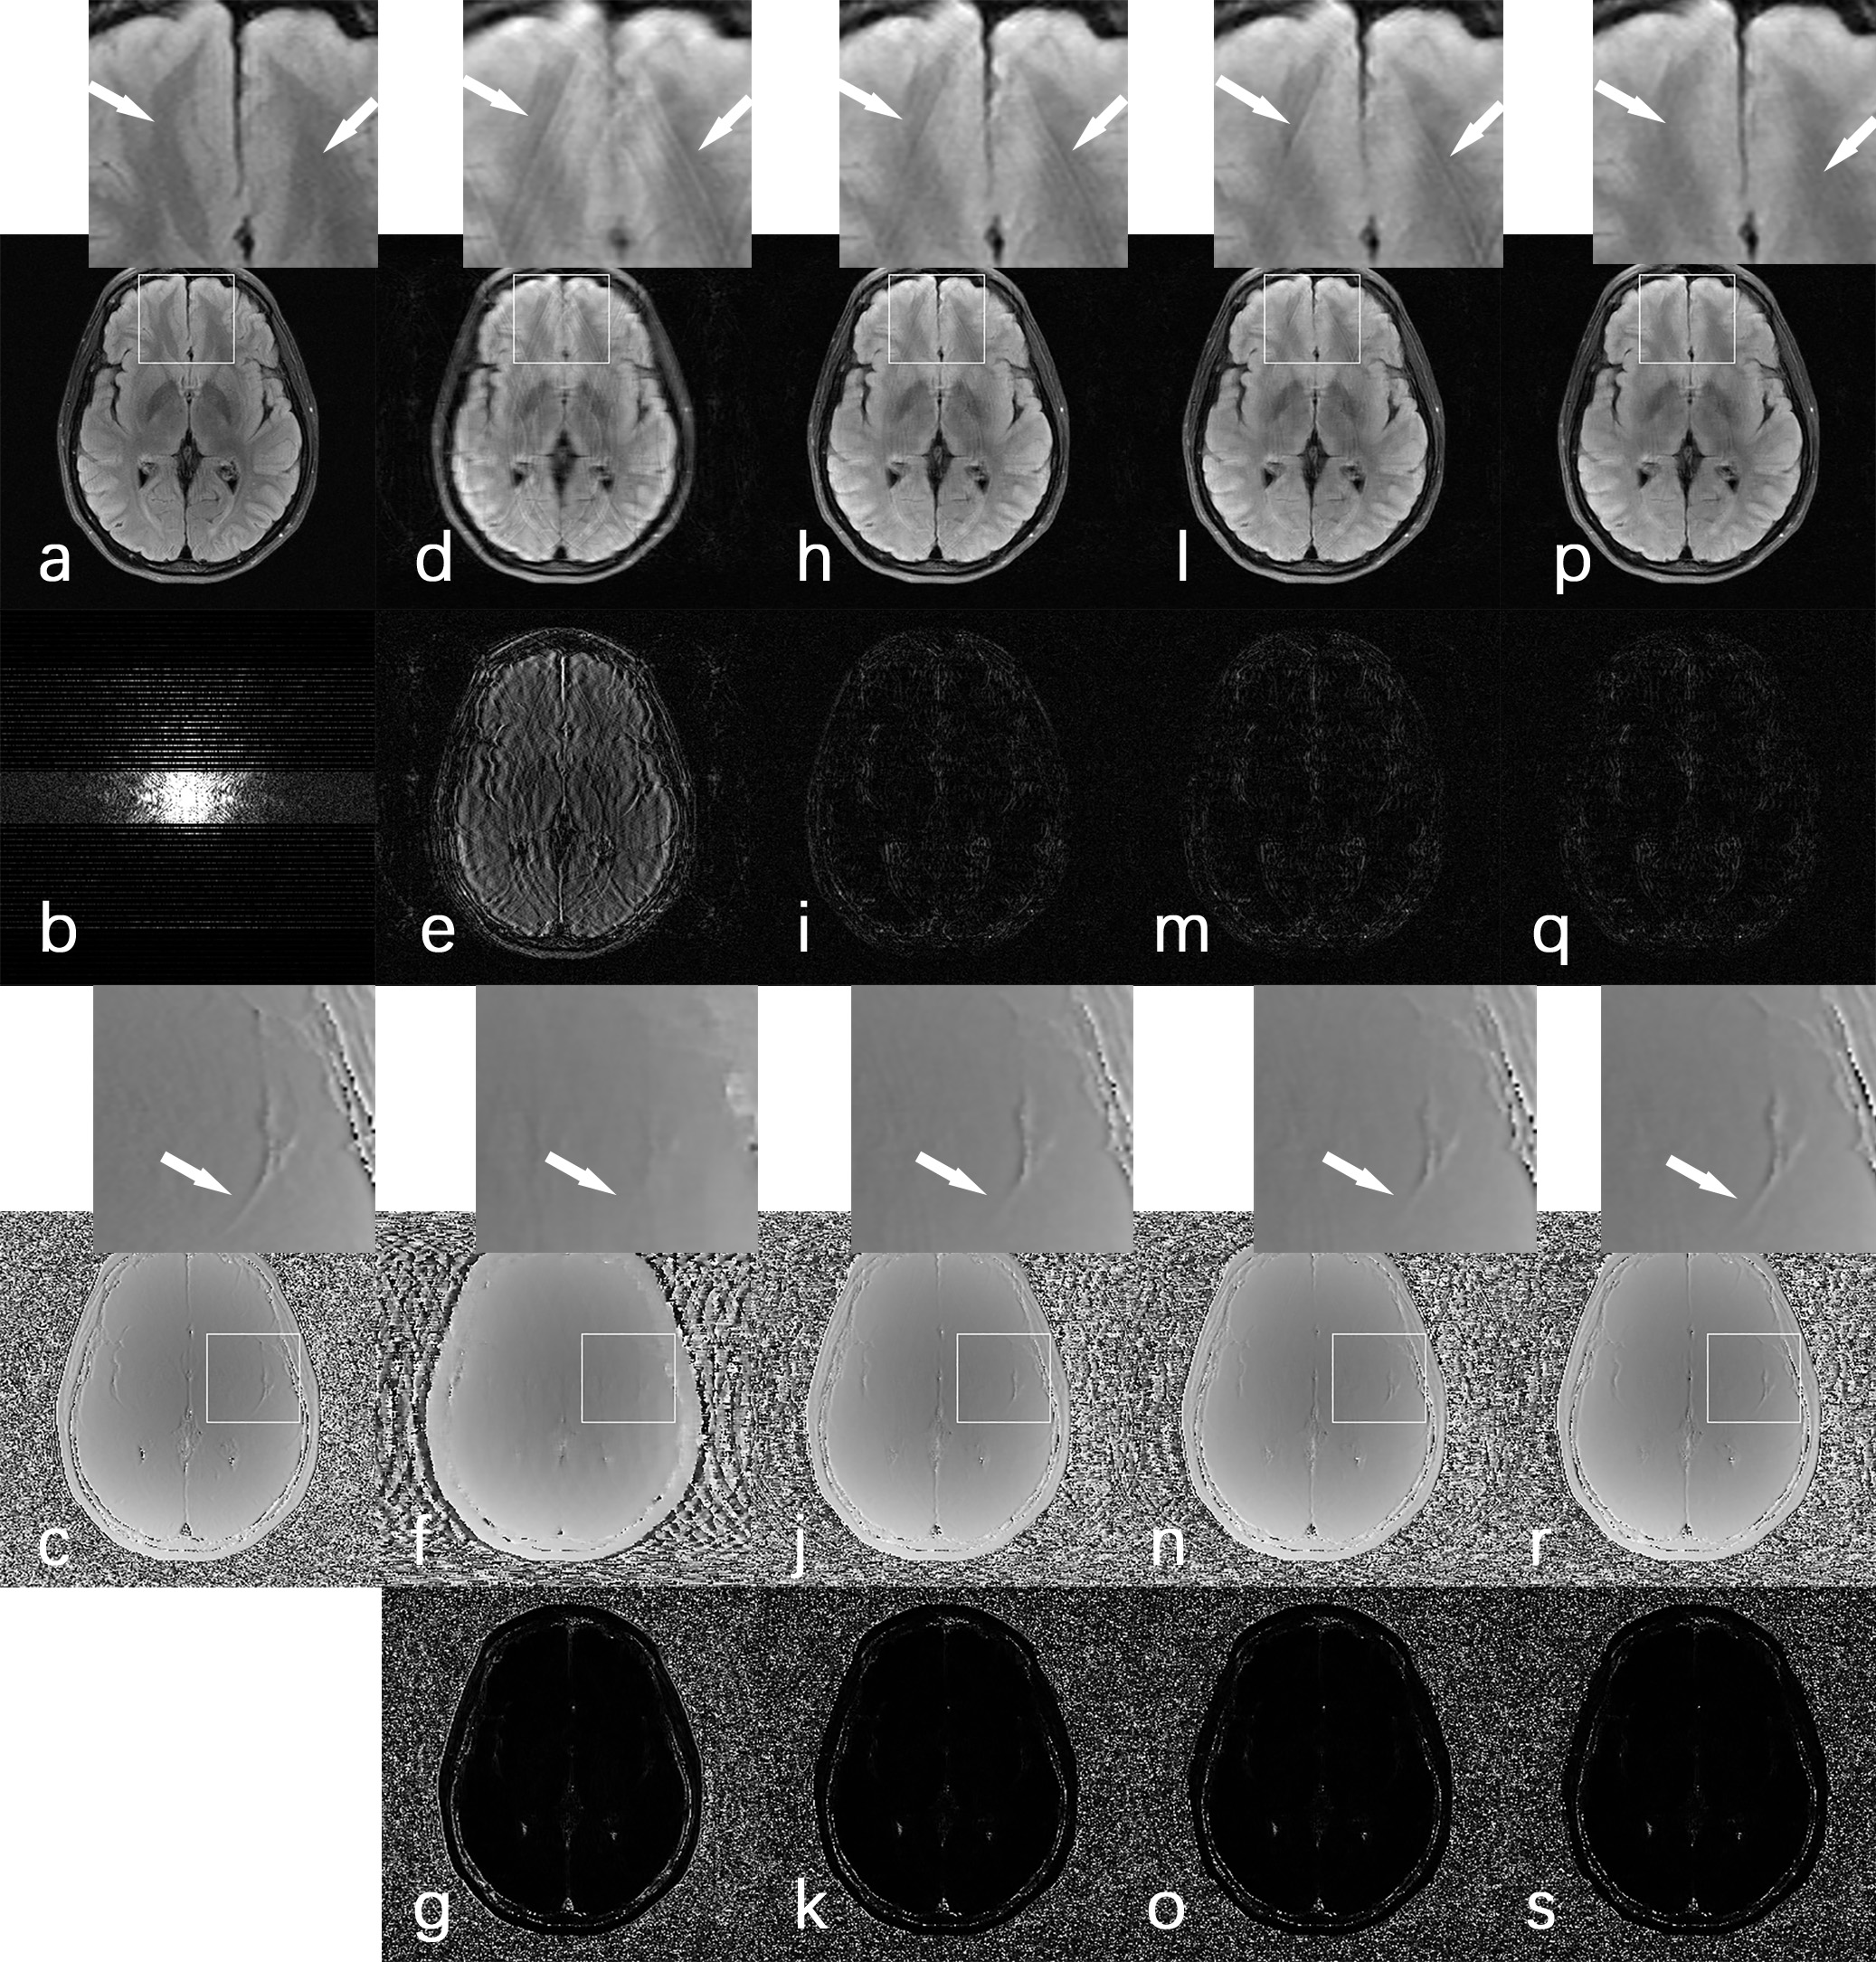
Figure 2 shows reconstruction results of a representative slice from FLAIR brain testing data. The “gold-standard” magnitude image (a) and corresponding phase image (c) were reconstructed with fully sampled k-space data. Skip size (N = 5) was used in retrospective regular under-sampling for all training, except the C = 44 lines near k-space center were fully sampled by the pattern as shown in (b). Zero-filling (ZF) reconstruction was performed on the under-sampled k-space data to yield (d, e, f, and g). Figs. (h, i, j, and k), (l, m, n, and o), (p, q, r, and s) are the reconstruction results of CU-Net, FDCU-Net, and SCU-NET, respectively. The top row figures are the reconstructed magnitude images (a, d, h, l, p), second row figures are the magnitude error maps for ZF (d), CU-Net (h), FDCU-Net (l), and SCU-NET (p), respectively. The third row are the corresponding reconstructed phase images (c, f, j, n, r), and the bottom row are corresponding phase error maps for ZF (g), CU-Net (k), FDCU-Net (o), and SCU-NET (s), respectively. The neural network of CU-Net, FDCU-Net, and SCU-NET were all trained with 50 epochs. The final reconstructed k-space data of ZF, CU-Net, FDCU-Net, and SCU-NET were all replaced by the actual acquired k-space data wherever available. From the enlarged areas of magnitude images (d, h, l), obvious strip artifacts can be seen as indicated by white arrows. These artifacts were well suppressed in Fig. p using the proposed SCU-NET reconstruction. As shown in the enlarged areas of phase images, CU-Net, FDCU-Net, and SCU-NET can all provide higher quality phase image than that of ZF reconstruction. The SSIM values of ZF, CU-Net, FDCU-Net, and SCU-Net are 0.72, 0.83, 0.83, and 0.85, respectively. The PSNR values of ZF, CU-Net, FDCU-Net, and SCU-Net are 23.12, 32.33, 32.47, and 33.02, respectively. Both SSIM and PSNR values of SCU-NET are the highest among all other reconstruction methods, suggesting superior reconstruction quality.Conclusion
Training sparsified complex data based on SCU-Net leads to higher reconstruction quality for regularly under-sampled k-space data. It allows more flexible data representations for complex data training, and is desirable for many practical situations, especially for phase sensitive MRI applications.Acknowledgements
The authors are grateful to the grant support from National Natural Science Foundation of China (61372024) and financial support from Children's & Women's Health Centre of British Columbia.References
1. Xiang QS. Accelerating MRI by skipped phase encoding and edge deghosting (SPEED). Magn Reson Med 2005;53:1112-1117.
2. Knoll F, Zbontar J, Sriram A, Muckley MJ, Lui YW. fastMRI: a publicly available raw k-Space and DICOM dataset of knee images for accelerated MR image reconstruction using machine learning. Radiol Artif Intell 2020:29;2(1). DOI: 10.1148/ryai.2020190007.
3. Zbontar J, Knoll F, Sriram A, Muckley MJ, Murrell T. fast MRI: an open dataset and benchmarks for accelerated MRI. 2019; arXiv:1811.08839.
4. Parker DL, Payne A, Todd N, and Hadley JR. Phase reconstruction from multiple coil data using a virtual reference coil. Magn Reson Med 2014;72:536-569.
Figures