3180
Applying Continuous-Time-Random-Walk (CTRW) diffusion model based Radiomics in Predicting HER-2 Expression in Breast Invasive Ductal Cancer1Department of Radiology, The First Affiliated Hospital of China Medical University, Shenyang, China, 2MR Scientific Marketing, Siemens Healthineers Ltd., Beijing, China, 3Shanghai Key Laboratory of Magnetic Resonance, East China Normal University, Shanghai, China
Synopsis
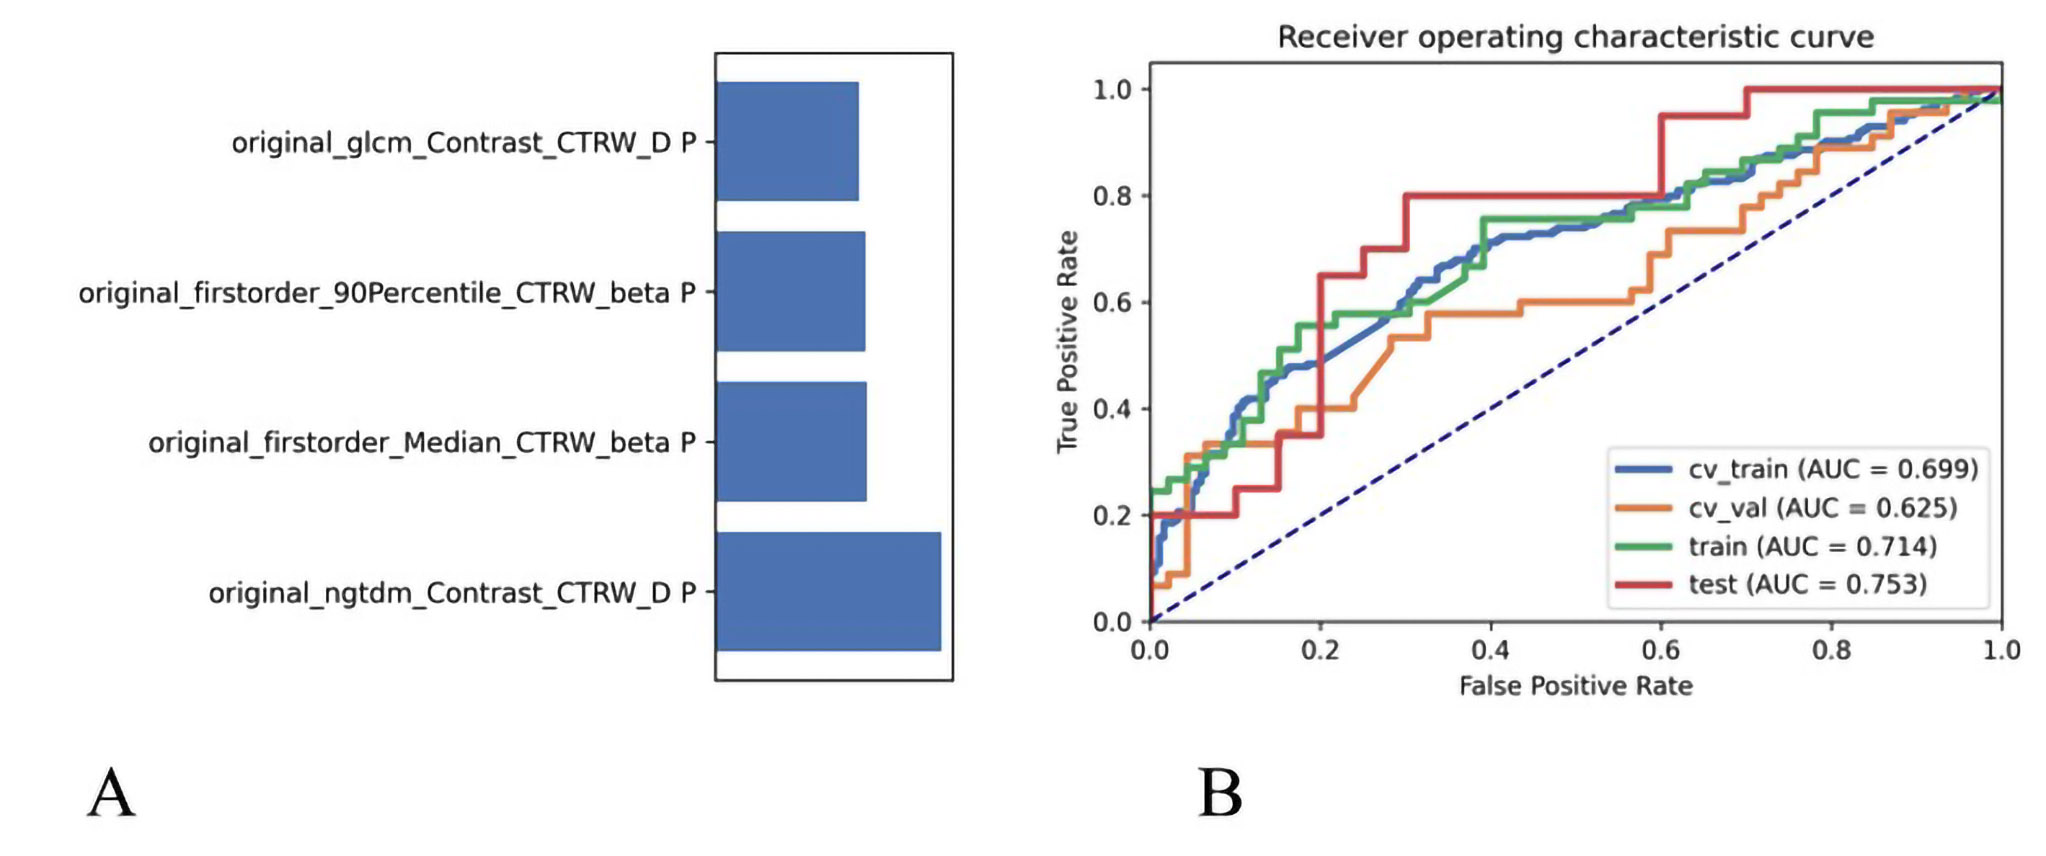
In this study, we built a support vector machine (SVM) model based on quantitative parameters of continuous-time random-walk (CTRW) diffusion model in predicting the human epidermal growth factor receptor-2 (HER-2) expression in breast invasive ductal carcinoma. An AUC of 0.753 was achieved, which may have a great potential in future clinical practice.
Backgrounds and Purpose
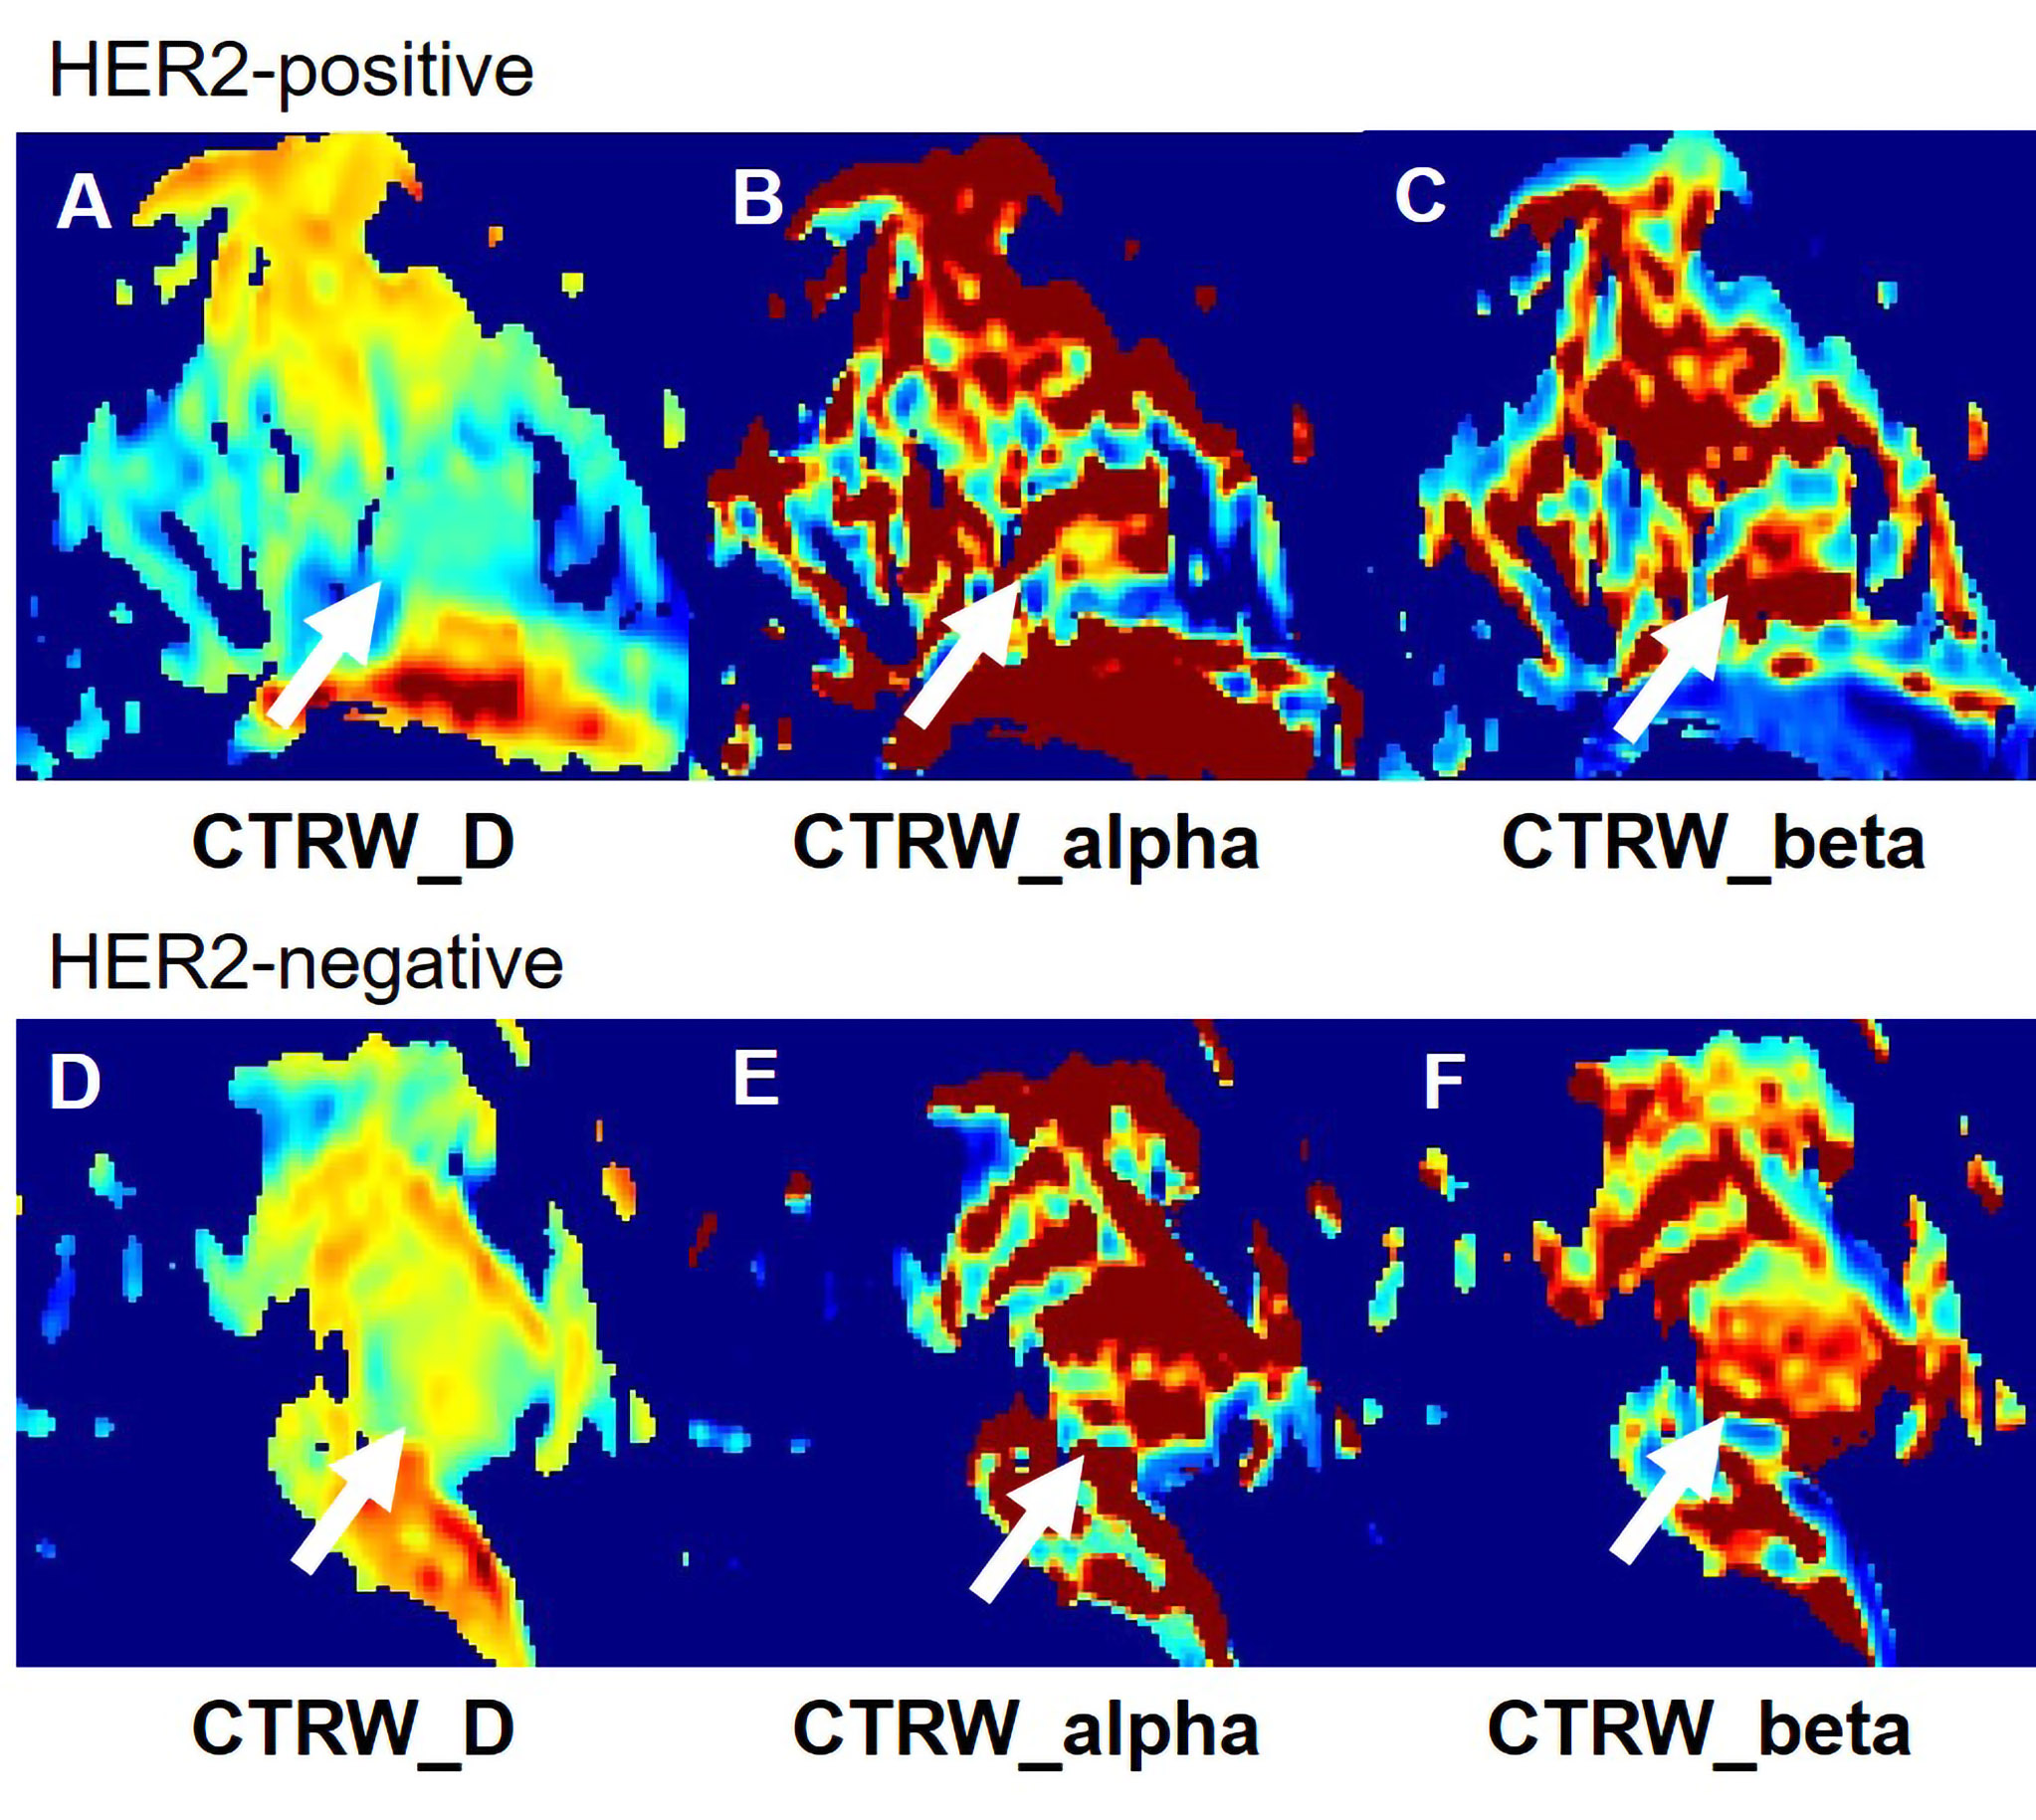
In recent years, diffusion weighted imaging plays a vital role in breast cancer differential diagnosis and therapeutic effect evaluation. However, the microenvironments of biological tissues in cancer, a heterogeneity tumor, are complicated. Therefore, more specific models were developed to reflect heterogeneity of the water motion in the human body1. The continuous-time random-walk (CTRW) diffusion model reflects intravoxel diffusion heterogeneity in both time and spatial scale. Therefore, it may be a potential biomarker to reflect the changes of tissue complexity and microenvironment. In making therapy schedule of invasive ductal carcinoma (IDC) of the breast, the levels of human epidermal growth factor receptor-2 (HER-2) expression plays an important role. In this study, we will evaluate the value of radiomics based on continuous-time random-walk (CTRW) diffusion model combined with a support vector machine (SVM) in predicting the HER-2 expression in breast invasive ductal carcinoma.Materials and Methods
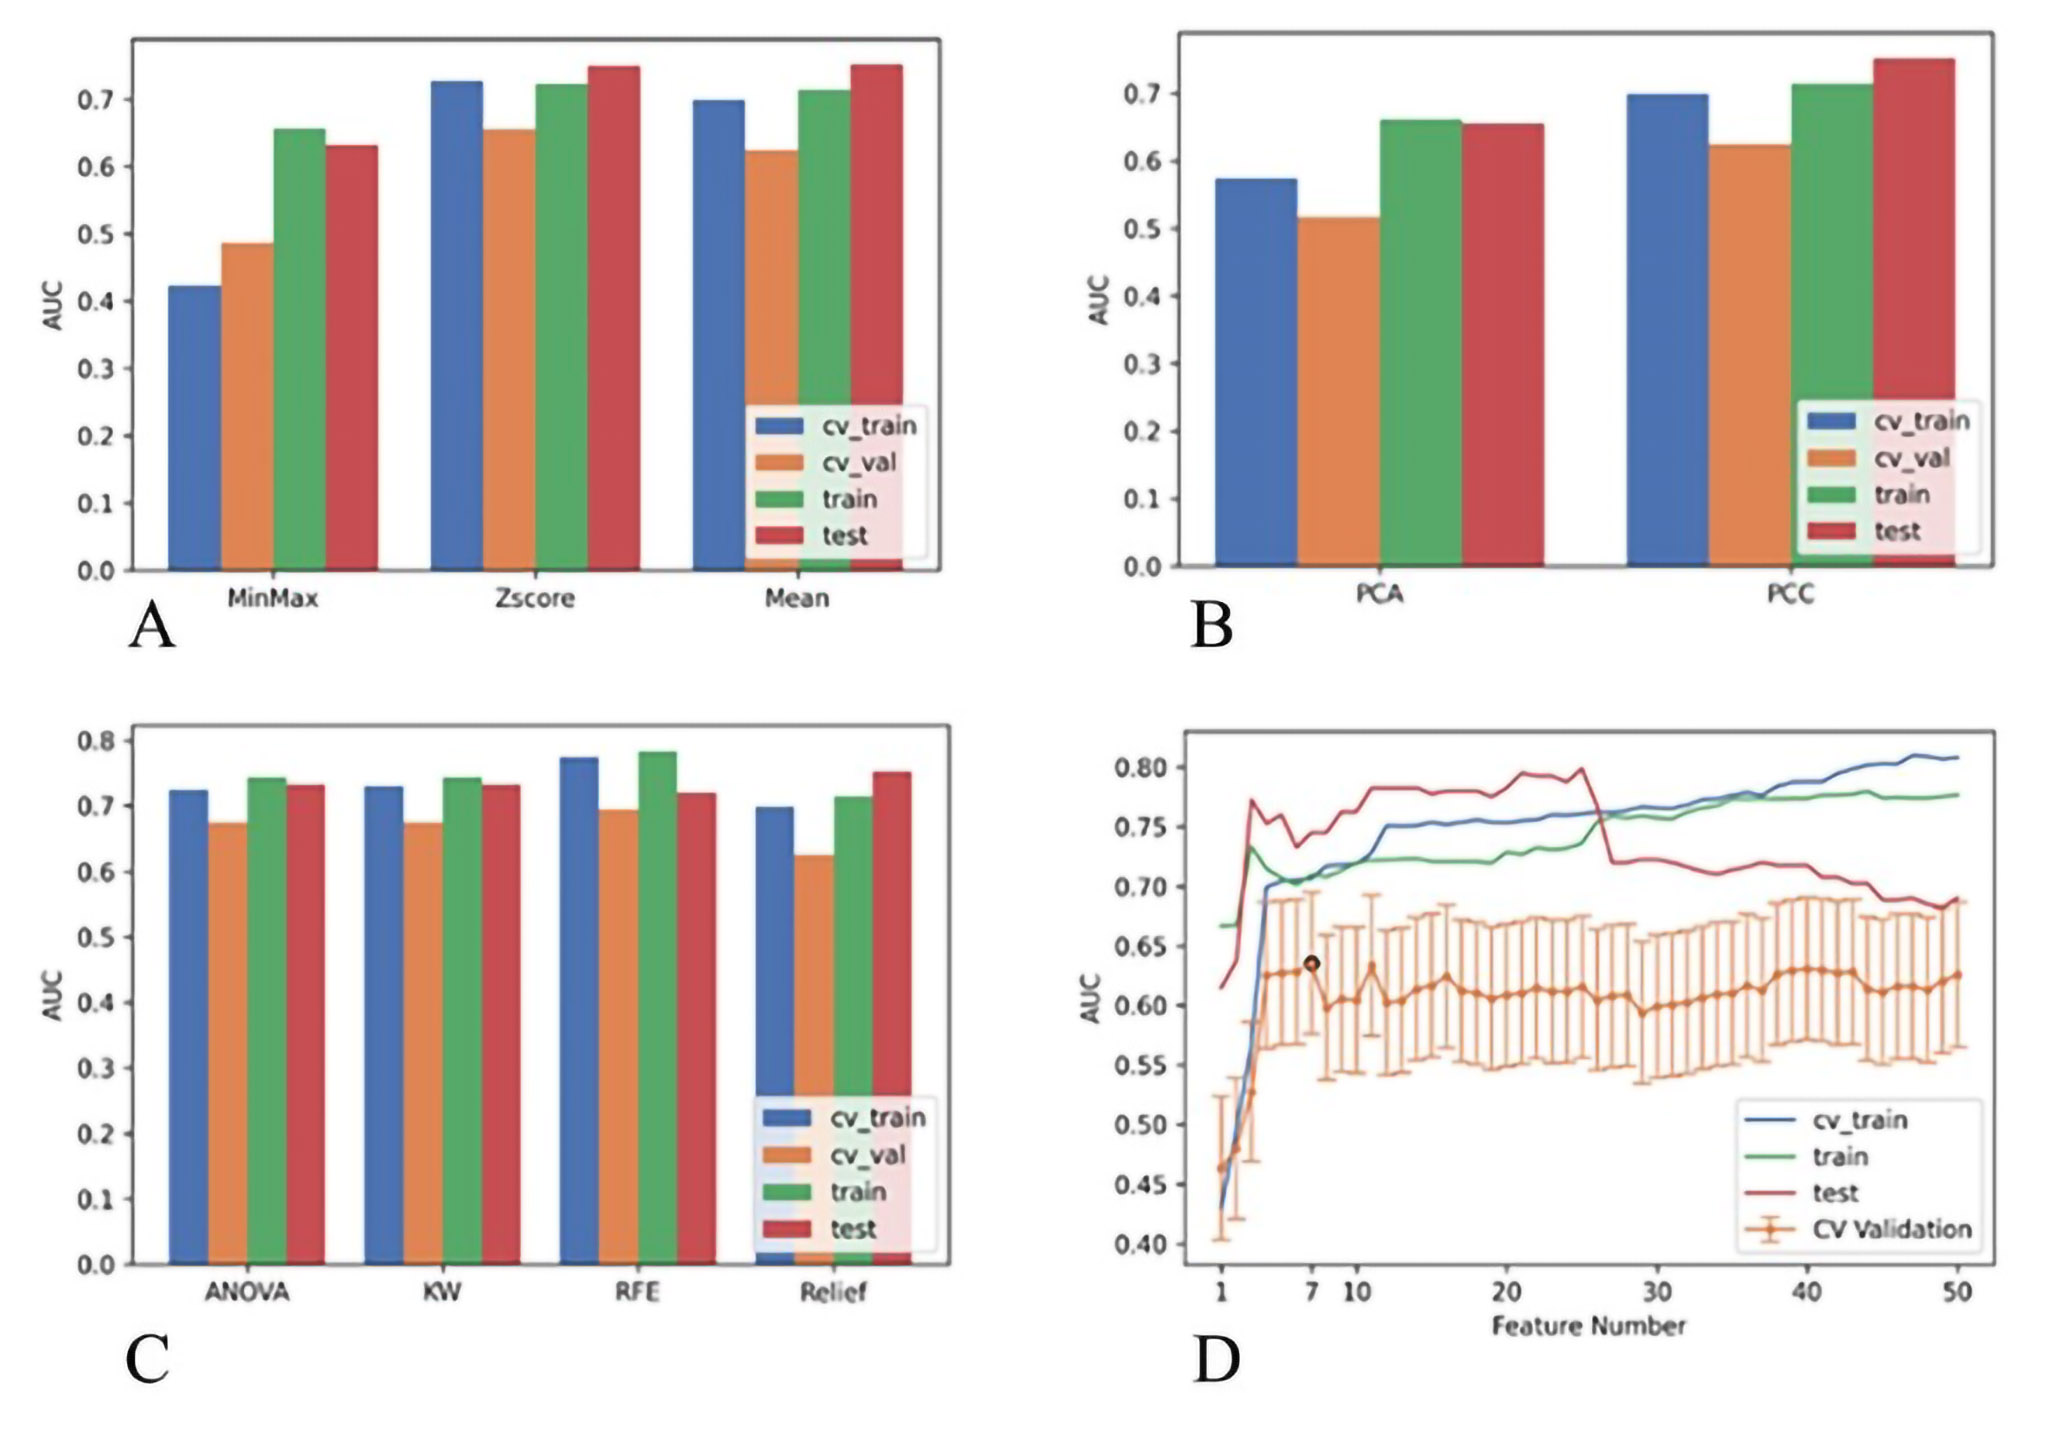
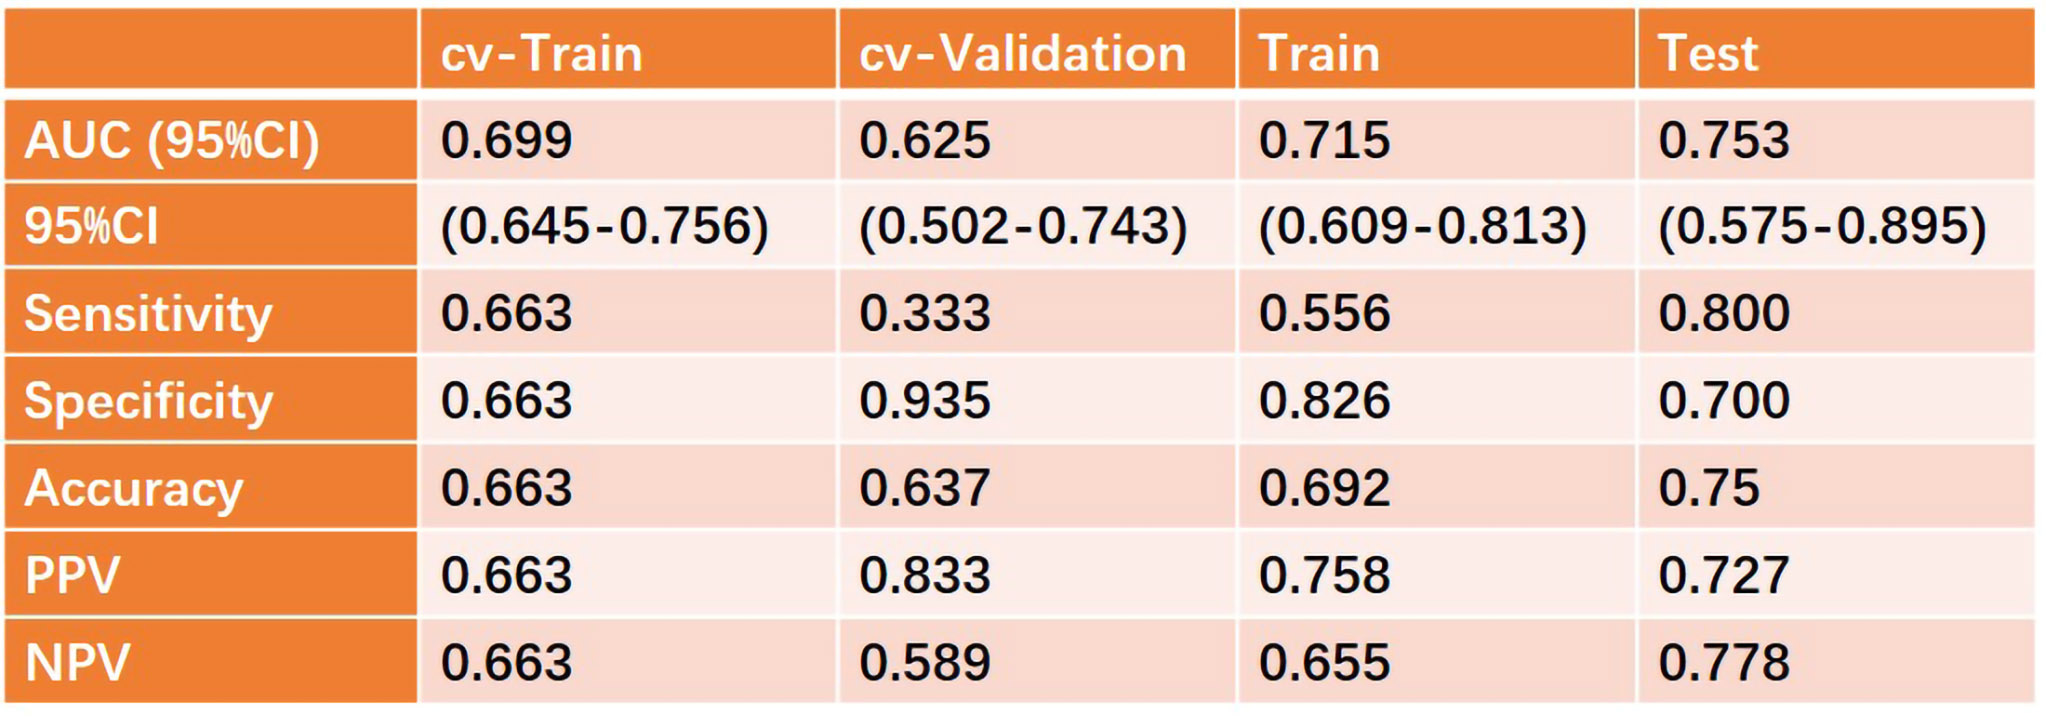
A total of 131 females, diagnosed with breast invasive ductal carcinoma (IDC) with biopsy confirmed, were enrolled from May 2020 to October 2021. According to the HER-2 states confirmed with immunohistochemistry results, all patients were divided into HER2-positive and HER2-negative groups. All MR examinations were performed on a 3T scanner (MAGNETOM Skyra, Siemens, Erlangen, Germany). The parameter maps of the CTRW were calculated by an in-house developed software called BoDiLab, which is based on Python 3.7. Based on a high b value images (b= 800 s/mm2), the whole tumor volume was delineated using a software itk-snap (http://www.itksnap.org/), by referring to the corresponding T1 contrast-enhancement or T2WI images . Radiomics features were extracted using an open source tool named Pyradiomics (https://pyradiomics.readthedocs.io/). During data preprocessing and model establishing, considering the effective and robust of the classifier, a SVM classifier was used. To explore the potential of this classifier, data enhancement, data normalization, dimension reduction and feature screening schemes in model establishing were optimized, and the optimal number of features in the prediction efficiency was also explored. The performance of the model was evaluated using receiver operating characteristic (ROC) curve analysis. The area under the ROC curve (AUC) was calculated for quantification. The accuracy, sensitivity, specificity, positive predictive value (PPV), and negative predictive value (NPV) were also calculated. All above processes were implemented with FeAture Explorer (FAE,v0.2.5,https://github.com/salan668/FAE) on Python (3.6.8,https://www.python.org/).Results
After comparing and optimizing in model establishing, to remove the unbalance of the training data set, a synthetic minority oversampling technique (SMOTE) was used to make positive/negative samples balance. In the normalization of the feature matrix, each feature vector was subtracted by the mean value of the vector, and was divided by the length of it. In the feature dimension reduction, a pearson correlation coefficient (PCC) method was used. Before building the model, a Relief method was used to select features. Finally, when 4 features of original_ngtdm_Contrast_CTRW_D, original_glszm_LargeAreaHighGrayLevelEmphasis_CTRW_beta, original_firstorder_Median_CTRW_beta, original_firstorder_90Percentile_CTRW_beta were adopted, the SVM demonstrated the highest diagnostic values in training, validation and test data (Table 2).Discussions
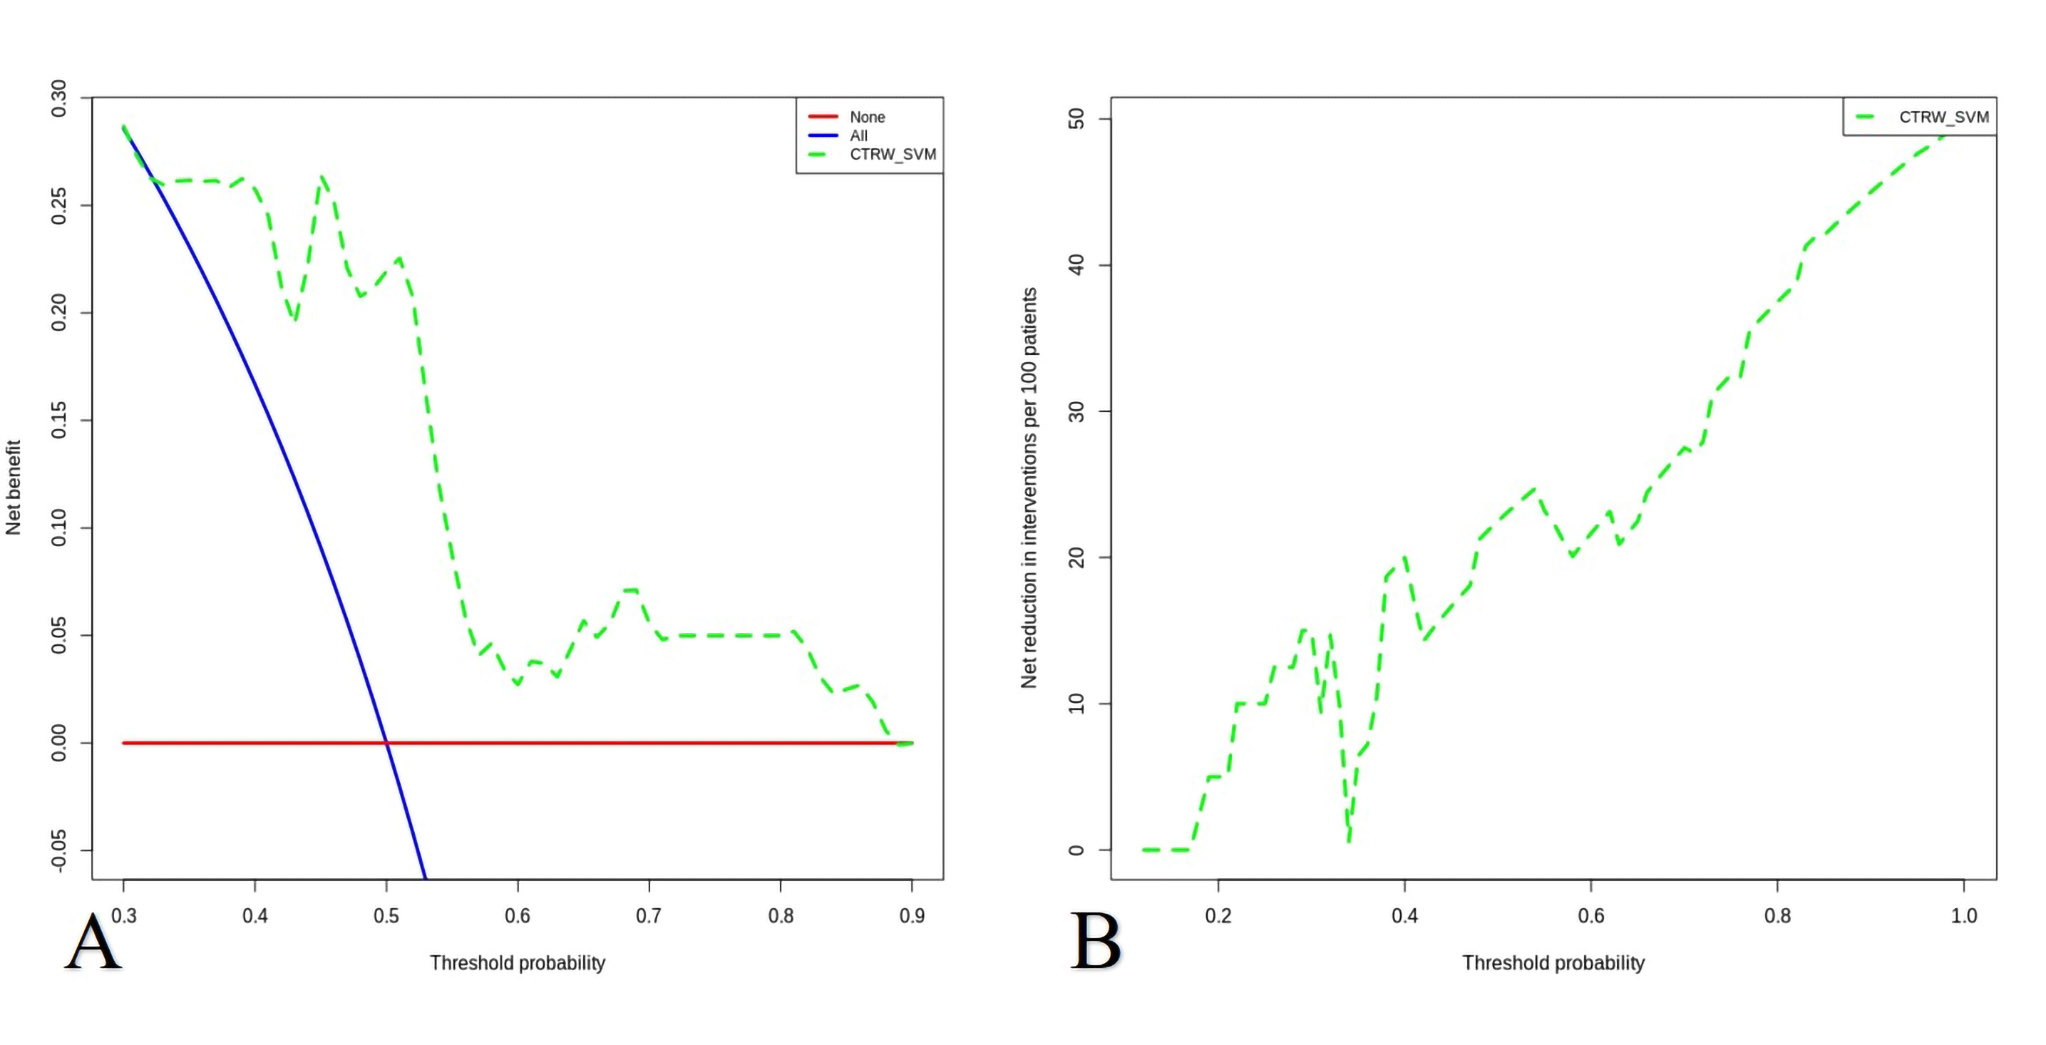
Unlike the other DWI models reflecting Gaussian or non-Gaussian diffusion behavior, the CTRW model can reflect intravoxel diffusion heterogeneity in both time and space, thus could be a potential biomarker for changes of tissue complexity and microenvironment2 . Radiomics, since first proposed by Philippe Lambin in 2012 3, have gained remarkable achievements in clinical practice, especially together with machine learning models. However, radiomics, especially texture features are very sensitive to image quality, signal intensity, matrix, or the physiological and physical means. Therefore, a quantitative parameter map, which the signal intensity will not change with the difference of scanning parameters, is of great significance for radiomics in the clinical application. SVM was an effective and robust classifier to build the model. The kernel function has the ability to map the features into a higher dimension to search the hyper-plane for separating the cases with different labels. Here we used the linear kernel function because it was easier to explain the coefficients of the features for the final model. To determine the hyper-parameter (e.g. the number of features) of model, we applied cross validation with 5-fold on the training data set. Using the SVM, the radiomics based on CTRW derived maps in predicting the HER-2 expression in breast IDC showed a high diagnostic performance, and it may have a great potential in future clinical practice.Conclusions
The support vector machine based on radiomics of CTRW derived maps demonstrated high diagnostic performance in predicting the HER-2 expression in invasive ductal carcinoma of the breast, which may have a great potential in future clinical practice.Acknowledgements
no.References
1. Iima M, Honda M, Sigmund EE, et al. Diffusion MRI of the breast: Current status and future directions. 2020;52(1):70-90.
2. Karaman MM, Zhang JX, Xie KL, et al. Quartile histogram assessment of glioma malignancy using high b-value diffusion MRI with a continuous-time random-walk model. 2021;34(4):e4485.
3. Lambin P, Rios-Velazquez E, Leijenaar R, et al. Radiomics: extracting more information from medical images using advanced feature analysis. Eur J Cancer, 2021;48(4):441-446.
Figures