3177
Self-supervised Liver T1rho Mapping with Physics-constrained Regularization
Chaoxing Huang1, Yurui Qian1, Jian Hou1, Baiyan Jiang1,2, Queenie Chan3, Vincent Wong4, Winnie Chu1, and Weitian Chen1
1Department of Imaging and Interventional Radiology, The Chinese University of Hong Kong, Shatin, Hong Kong, 2Illuminatio Medical Technology Limited, Hong Kong, China, 3Philips Healthcare, Hong Kong, China, 4Department of Medicine and Therapeutics, The Chinese University of Hong Kong, Shatin, Hong Kong
1Department of Imaging and Interventional Radiology, The Chinese University of Hong Kong, Shatin, Hong Kong, 2Illuminatio Medical Technology Limited, Hong Kong, China, 3Philips Healthcare, Hong Kong, China, 4Department of Medicine and Therapeutics, The Chinese University of Hong Kong, Shatin, Hong Kong
Synopsis
Quantification of liver T1rho has gained interest in liver pathological study. Traditional fitting method requires acquisition of multiple T1rho-weighted images and it can be affected by respiratory motion. We propose a physics-informed self-supervised mapping method by taking only one T1rho-weighted image to do the mapping. Our preliminary experimental results show that our method has the potential to outperform the traditional multi-TSL acquisition method, particularly in the scenario of free-breathing MRI scan.
Introduction
The ability to indicate liver inflammation noninvasively and the sensitivity to the change of macromolecular contents in tissue gives T1rho the feasibility of being used in liver pathological study 1 . Current liver T1rho quantification requires the acquisition of multiple T1rho-weighted images with varying time-of spin-lock( $$$TSL$$$) within a breath-hold of 8 to 10 seconds to avoid pixel misalignment 2. Previous learning-based quantification works 3,4,5 do not consider the problem of signal scale variations due to different scanning settings6. To tackle these problems, we propose a physics-informed self-supervised mapping method for taking only one T1rho weighted image to facilitate the special demands of liver T1rho mapping under different scaling conditions.Method
Loss FunctionGiven a mono-exponential model $$$ y=S_0\exp(\frac{-TSL}{T1rho})$$$ where $$$S_0$$$ is the constant scaling, the deep network takes one single T1rho weighted image as input, and results in the output of $$$S_0$$$ and T1rho . Let us denote a group of T1rho weighted images of the same slice of the liver with $$$n$$$ different $$$TSL$$$ as $$$G = \{I(TSL^{i})|i=1,2,\dots,n \}$$$, one would think of using the $$$S_0^{i}$$$ and $$$T1rho^i$$$ being obtained from $$$I(TSL^i)$$$ to synthesize another T1rho weighted image $$$I(TSL^j)$$$ in group $$$G$$$. The loss function can therefore be written as
$$L_1 = |S_0^i \exp(-\frac{TSL^j}{T1rho^i}) -I(TSL^j)|_{j\in { \{ 1,2,\dots,n \} }}$$
We need to regularize the model to learn the physics constraint that T1rho is unchanged under a different range of signals. During training, We uniformly sample $$$s$$$ from the interval of $$$[-S,S]$$$, and the scaling factor $$$k=10^s$$$. We input the scaled image $$$kI(TSL^{i})$$$ to the network and obtain the corresponding T1rho map as $$$Q1rho^{i}$$$ to synthesize the unscaled ground-truth. The total loss function can then be written as:
$$ L =\sum_{k=1}^{N}\sum_{i=1}^{n} \sum_{j=1}^{n} \left[ L_1+\lambda |S_0^i \exp(-\frac{TSL^j}{Q1rho^i}) -I(TSL^j)| \right ]$$
where $$$\lambda$$$ is a hyper-parameter, $$$N$$$ is the number of groups. The whole training pipeline is shown in Figure 1. The network we used is an UNet architecture7 with two-channel output.
Evaluation metric
The fitting result using non-linear least square method with 4 $$$TSL= 0, 10,30,50$$$ ms is used as the reference. The reliability of pixel-wise T1rho analysis can be affected by noise 8. As in the previous works1,8,9 , we use the mean value within ROIs for analysis to reduce noise influence. The mean value in the ROI (Figure 2) of the right lobe of liver parenchyma of the reference T1rho map is used as the reference value. The average value of the absolute error between the mean value in the ROI of the output T1rho and the reference value over all the predictions is the evaluation metric. Since we want to reduce the time for breath-hold during the scan, we set the performance of the traditional fitting method using two T1rho weighted images from two different TSLs (all adjacent dynamic scan pairs) as the benchmark. We also compared the proposed method to the traditional fitting method using 2 and 4 TSLs on data acquired using free-breathing, respectively.
Data acquisition
All scans were conducted using a 3.0 T MRI scanner (Philips Achieva TX, Philips Healthcare, Best, Netherlands). A 32-channel cardiac coil (Invivo Corp, Gainesville, USA) was used as the receiver and the body coil was used as the RF transmitter. The parameter setting is shown in Figure 5. We train our model on the T1rho weighted images acquired from 15 healthy volunteers and test it on 40 subjects with data acquired using breath-hold and 6 subjects with data acquired using free breathing.
Results
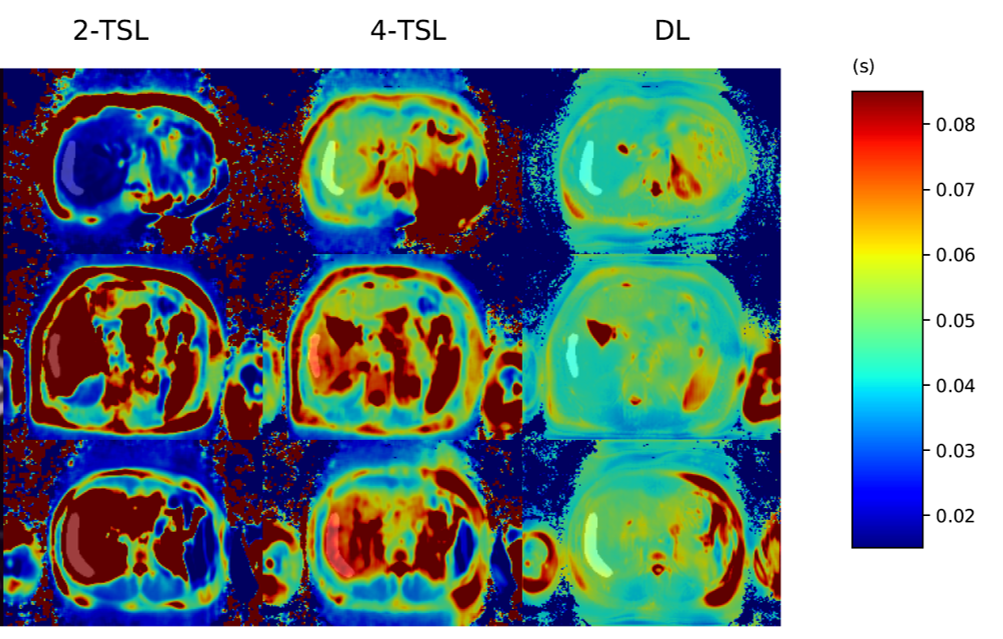
The results on 40 subjects are shown in Figure 3. Note our model achieved a better performance than the benchmark traditional 2-TSL approach even though we used fewer T1rho-weighted images. Note the performance was further improved after using the proposed physics-constrained regularization. Figure 4 shows the comparison of the proposed method to the traditional multi-TSL fitting methods on data acquired using free breathing. We compared the proposed method to the traditional 2-TSL and 4-TSL approaches. Note the traditional method using either 2 TSLs or 4 TSLs were sensitive to motion and produced erroneous T1rho values. In contrast, our proposed method can produce reasonable output even during free breathing.Discussion
Why can the physics-constrained regularization improve the performance?In the T1rho relaxation model, the parameter $$$S_0$$$ can be affected by multiple factors including tissue-dependent proton density and T1 relaxation time, pulse sequence acquisition parameters, hardware settings such as coil sensitivity, and post-processing settings. Such differences between the test-set and the training- set can lead to a change of signal scale. By adding the physics-constrained regularization, the model can generalize to different signal scales rather than overfit on the signal scale of the training set.
Conclusion
We proposed a learning-based framework that has the potential to predict T1rho by using a single T1rho-weighed image. It is challenging to use the traditional T1rho imaging in the liver with free breathing. We demonstrated the proposed method has the potential to be used for T1rho imaging of the liver with free breathing. We also demonstrated model generality by using physics-constrained regularization. Future work will focus on improving the generality under different scanning protocol settings or even different MR pulse sequences by decoupling the representations in the learning process.Acknowledgements
This study was supported by a grant from the Innovation and Technology Commission of the Hong Kong SAR (Project MRP/046/20X), a Faculty Innovation Award from the Chinese University of Hong Kong, and a grant from the Research Grants Council of the Hong Kong SAR (Project SEG CUHK02). We would like to thank Professor Thierry Blu for providing the code for non-linear least square fitting.References
- Allkemper, Thomas, et al. "Evaluation of fibrotic liver disease with whole-liver T1ρ MR imaging: a feasibility study at 1.5 T." Radiology 271.2 (2014): 408-415.
-
Chen W, Chan Q, Wáng YX.
Breath-hold black blood quantitative T1rho imaging of liver using single
shot fast spin echo acquisition. Quantitative imaging in medicine and
surgery. 2016 Apr;6(2):168.
- Fang, Zhenghan, et al. "Deep learning for fast and spatially constrained tissue quantification from highly accelerated data in magnetic resonance fingerprinting." IEEE transactions on medical imaging 38.10 (2019): 2364-2374.
- Varadarajan, Divya, et al. "Unsupervised learning of MRI tissue properties using MRI physics models." arXiv preprint arXiv:2107.02704 (2021).
- Liu, Fang, et al. "Magnetic resonance parameter mapping using model‐guided self‐supervised deep learning." Magnetic Resonance in Medicine 85.6 (2021): 3211-3226.
- Filo, Shir, and Aviv A. Mezer. "PD: Proton Density of Tissue Water 1." Quantitative MRI of the Brain: Principles of Physical Measurement. CRC Press, 2018. 55-72.
- Buda, M., Saha, A., & Mazurowski, M. A. (2019). Association of genomic subtypes of lower-grade gliomas with shape features automatically extracted by a deep learning algorithm. Computers in biology and medicine, 109, 218-225.
- Chen, Weitian. "Errors in quantitative T1rho imaging and the correction methods." Quantitative imaging in medicine and surgery 5.4 (2015): 583.
- Chen, Weibo, et al. "Quantitative assessment of liver function with whole-liver T1rho mapping at 3.0 T." Magnetic resonance imaging 46 (2018): 75-80.
Figures
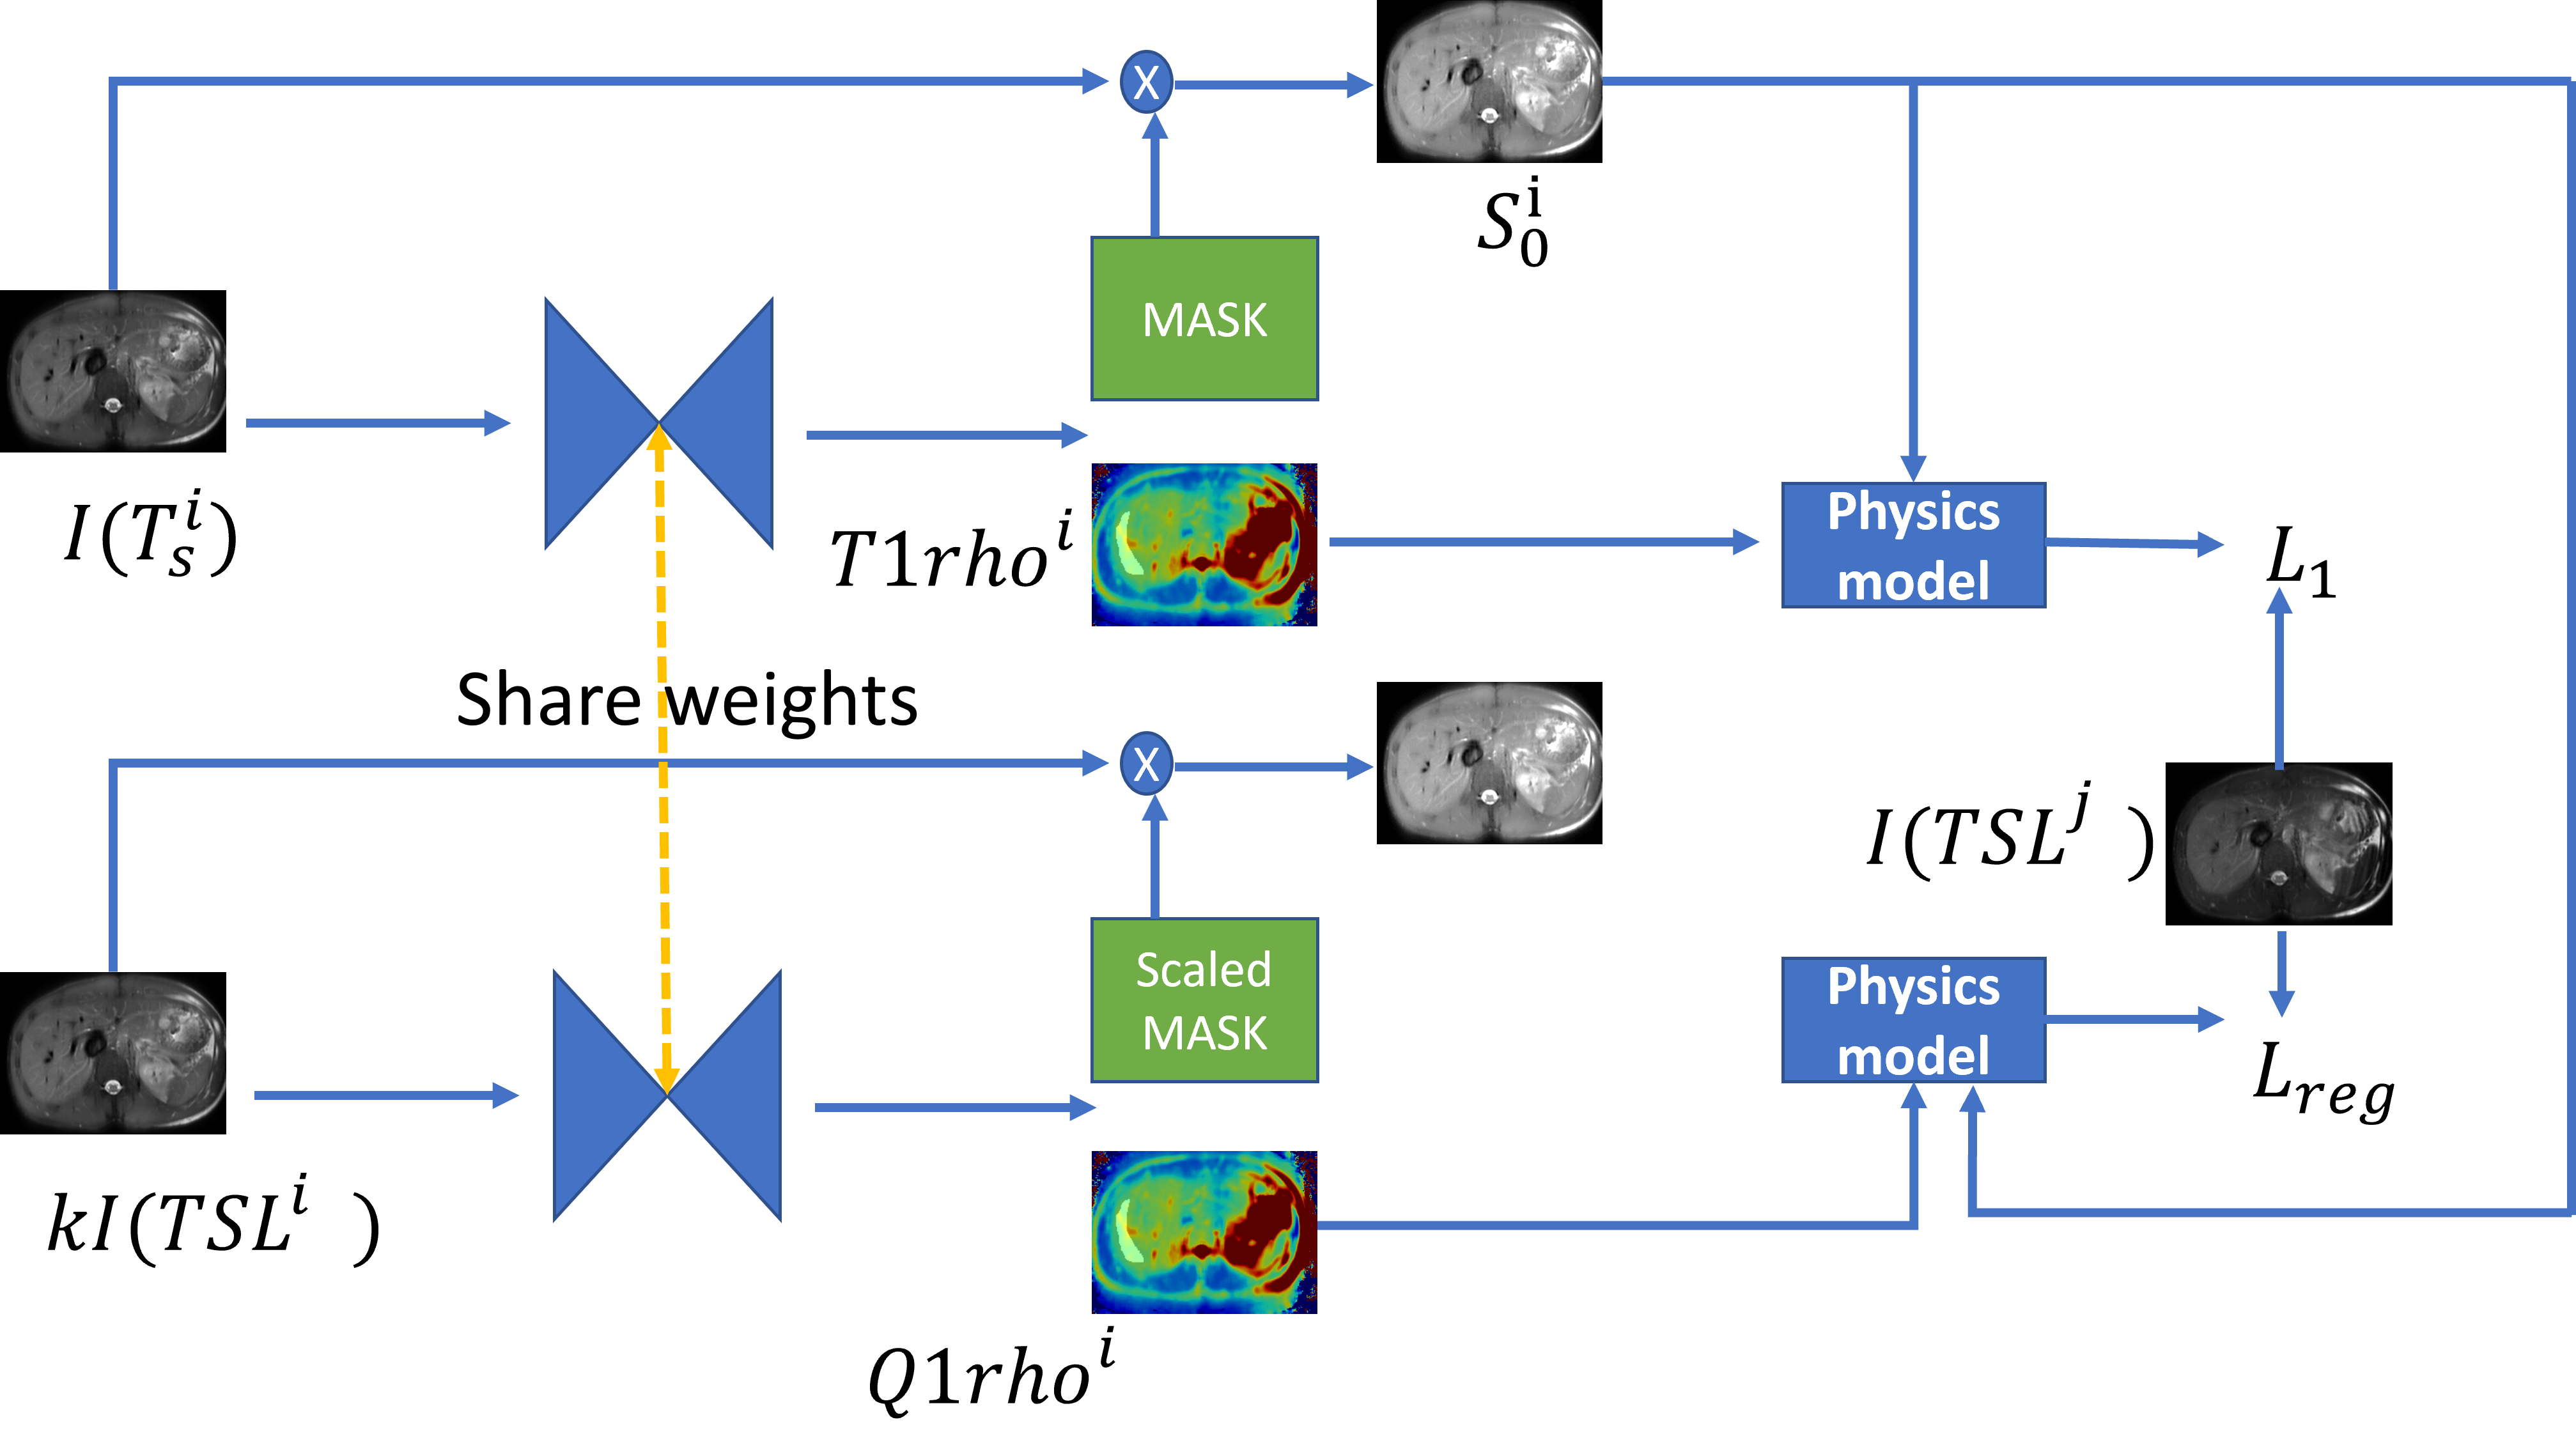
Figure 1. The training pipeline of the model. The network takes the forward pass for the original image and random scaled image respectively. Their output T1rho should all ensure a successful synthesis of the reference T1rho weighted image in the training set. Lreg stands for the scaling regularization loss.
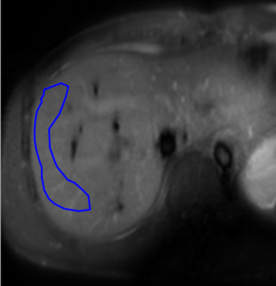
Figure 2. The ROI example during testing. We draw the ROI at the right lobe of the liver parenchyma to avoid large vessels and apparent artifacts.
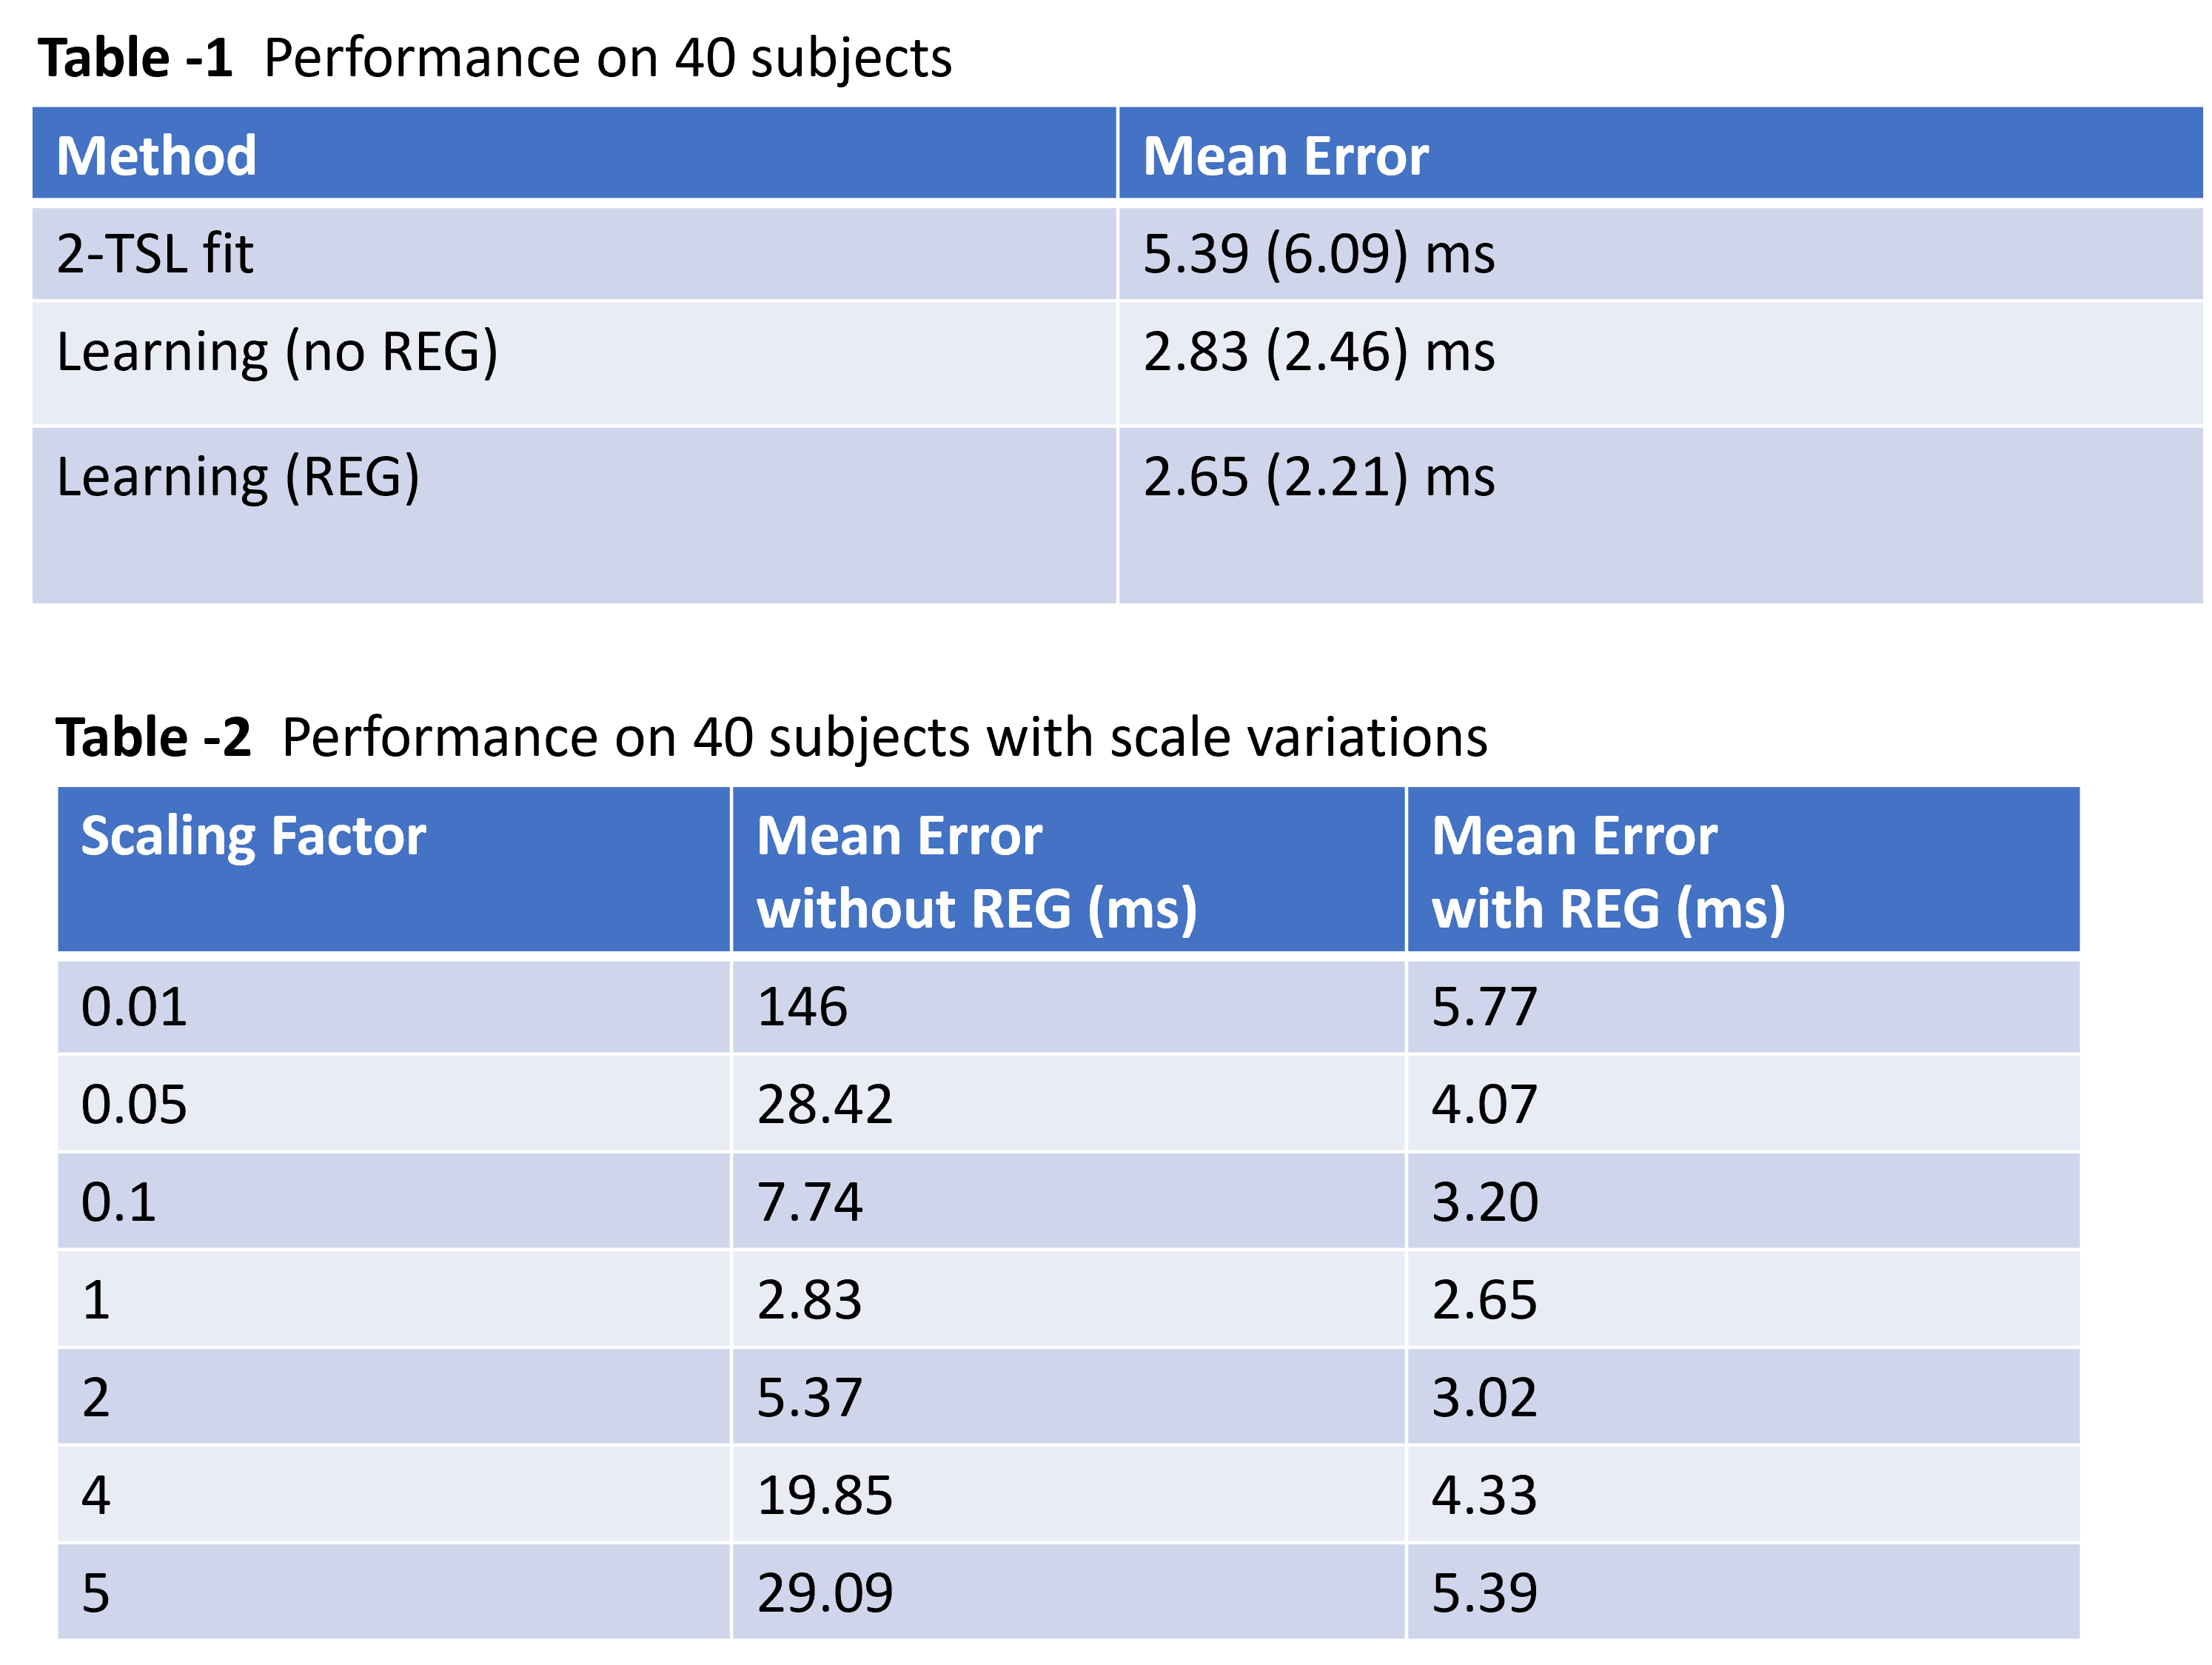
Figure 3. The performance results on 40 subjects. Learning (no REG) stands for deep learning model without scaling regularization. Learning (REG) stands for deep learning model with scaling regularization. The number in the bracket is the standard deviation.
Figure
4. The visualization examples of our deep learning method and those traditional
multi-TSL fitting method. The data was acquired using free breathing. The bright areas are the test ROIs. Both
2-TSL and 4-TSL fitted results have erroneous appearance in the ROI due to
motion.
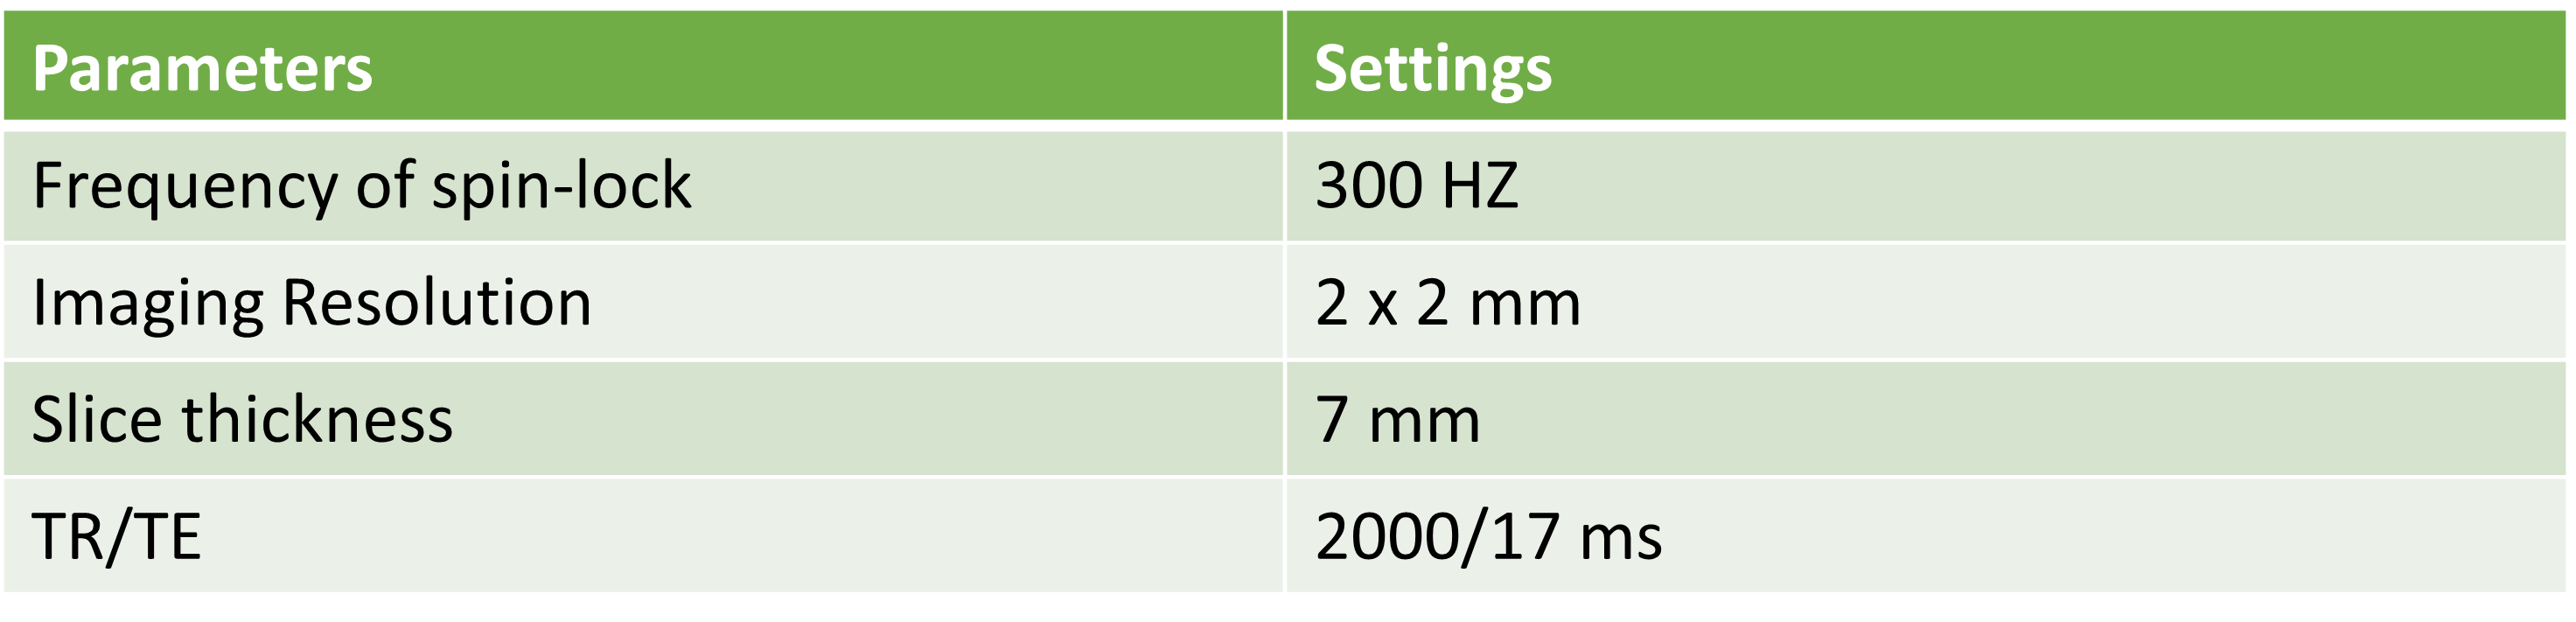
Figure
5. The scan setting during data acquisition. The fat and blood signals were
suppressed through spectral pre-saturation with inversion recovery (SPIR) and
double inversion recovery (DIR),respectively. A pencil beam volume shimming box was placed
on the right lobe of the liver to reduce the susceptibility effect.
DOI: https://doi.org/10.58530/2022/3177