3176
XCloud-HyperLRF: Fast Hypercomplex NMR Spectroscopy with Cloud-based Low Rank Hankel Matrix Reconstruction1School of Computer and Information Engineering, Xiamen University of Technology, Xiamen, China, 2Department of Electronic Science, Biomedical Intelligent Cloud R&D Center, Fujian Provincial Key Laboratory of Plasma and Magnetic Resonance, Xiamen University, Xiamen, China, 3China Mobile Group, Xiamen, China, 4Department of Chemistry and Molecular Biology, University of Gothenburg, Gothenburg, Sweden
Synopsis
Nuclear magnetic resonance (NMR) serves as an indispensable tool in revealing physical, chemical and structural information about molecules. We present a hypercomplex low rank approach to reconstruct hypercomplex NMR spectrum reconstruction. We first introduce an adjoint matrix operation to convert the hypercomplex signal into complex matrix and then propose a low-rank model and algorithm to reconstruct hypercomplex signal. The experiment results demonstrate that the proposed method provides a fast and high-fidelity reconstruction of hypercomplex NMR data. Furthermore, we made the method available at an open-access and easy-to-use cloud computing platform.
Purpose
Multi-dimensional NMR offers a major improvement in resolution by spreading the signals in several dimensions but also significantly increases experiment time and produces hypercomplex data that is difficult to be handled1,2. The experiment time can be reduced effectively with non-uniformly sampling but the spectra need to be reconstructed with an advanced algorithm3-5. A direct way is to handle a hypercomplex signal is to split it into two complex signals followed by applying a reconstruction algorithm for complex data 6,7. However, such a strategy may lead to distorted spectra in the reconstruction since redundant information among different components is not utilized. In this work, we propose a method for multi-component complementary hypercomplex NMR reconstruction with low rank Hankel matrix8 and derive a matrix factorization algorithm for fast reconstruction.Methods
To a good approximation, the hypercomplex NMR signals can be modelled as the sum of exponentials in hypercomplex form, i.e. $$$\begin{equation}\dot{\mathbf{X}}_{m, n} \in \mathbb{H}^{M \times N}\end{equation}$$$ is modelled as 9 ,$$ \begin{equation}\dot{\mathbf{X}}(m, n)=\sum_{p=1}^{P} \alpha_{p} e^{-\frac{m \Delta t_{1}}{\tau_{1, p}}} e^{j_{1}\left(\omega_{1, p}\ m \Delta t_{1}+\varphi_{1, p}\ \right)} e^{-\frac{n \Delta t_{2}}{\tau_{2, p}}} e^{j_{2}\left(\omega_{2, p}\ n \Delta t_{2}+\varphi_{2, p}\ \right)}\end{equation},(1)$$
where $$$p$$$ denotes the $$$p^{th}$$$ spectral peaks and $$$P$$$ stands for the total number of peaks. Accordingly, $$$\omega_{p}$$$, $$$\varphi_{p}$$$ and $$$\tau_{i, p}$$$ (i=1,2) denote the central frequency, phase and damping factors of $$$p^{th}$$$ spectral peaks along the $$$1^{st}$$$ and $$$2^{nd}$$$ indirect dimension, $$$j_{1}$$$ and $$$j_{2}$$$ denote imaginary units, $$$m \Delta t_{1}$$$ and $$$n \Delta t_{2}$$$ denote the acquisition time corresponding to the two indirect dimensions, and the amplitude for the spectral peak is $$$a_{p}$$$.
The multi-component complementary Hypercomplex Low Rank (HyperLR) reconstruction method is formulated as ,
$$ \begin{equation}\min _{\dot{\mathbf{X}}}\|\mathbf{P}(\hat{\mathbf{B}} \dot{\mathbf{X}})\|_{*}+\frac{\lambda}{2}\left\|\dot{\mathbf{Y}}-\hat{\mathcal{P}_{\Omega}} \dot{\mathbf{X}}\right\|_{F}^{2}\end{equation},(2)$$
where operator $$$\mathbf{P}$$$ denotes the mapping from hypercomplex signal to complex signal, operator $$$\hat{\mathbf{B}}$$$ denotes constructing block Hankel matrix using the hypercomplex signal, $$$\begin{equation}\dot{\mathbf{X}} \in \mathbb{H}^{M \times N}\end{equation}$$$ is the full hypercomplex FID signal (with four components) to be reconstructed, $$$\begin{equation}\dot{\mathbf{Y}} \in \mathbb{H}^{M \times N}\end{equation}$$$ is the acquired hypercomplex FID with non-acquired positions zero-filled, $$$\hat{\mathcal{P}_{\Omega}}$$$ is an undersampling operator, $$$\Omega$$$ represents sampling space, regularization parameter $$$\lambda$$$ tradeoffs between data fidelity and low-rank constraint, $$${{\left\|\cdot\right\|}_{*}}$$$ represents the nuclear norm, and $$${{\left\|\cdot\right\|}_{F}}$$$ denotes the Frobenius norm.
To avoid the time-consuming Singular Value Decomposition when the nuclear norm is minimized, we introduce the matrix factorizations10,11. Hence, the fast Hypercomplex Low Rank matrix Factorization (HyperLRF) reconstruction method is:
$$ \begin{equation}\min _{\mathbf{U}, \mathbf{V}} \frac{1}{2}\left(\|\mathbf{U}\|_{F}^{2}+\|\mathbf{V}\|_{F}^{2}\right)+\frac{\lambda}{2}\left\|\dot{\mathbf{Y}}-\hat{\mathcal{P}}_{\Omega} \dot{\mathbf{X}}\right\|_{F}^{2} \quad \text { s.t. } \mathbf{P}(\hat{\mathbf{B}} \dot{\mathbf{X}})=\mathbf{U} \mathbf{V}^{H}\end{equation},(3)$$
where $$$\mathbf{U}$$$ and $$$\mathbf{V}$$$ denote two factorized matrices, the superscript $$${H}$$$ represents conjugate transpose.
Results
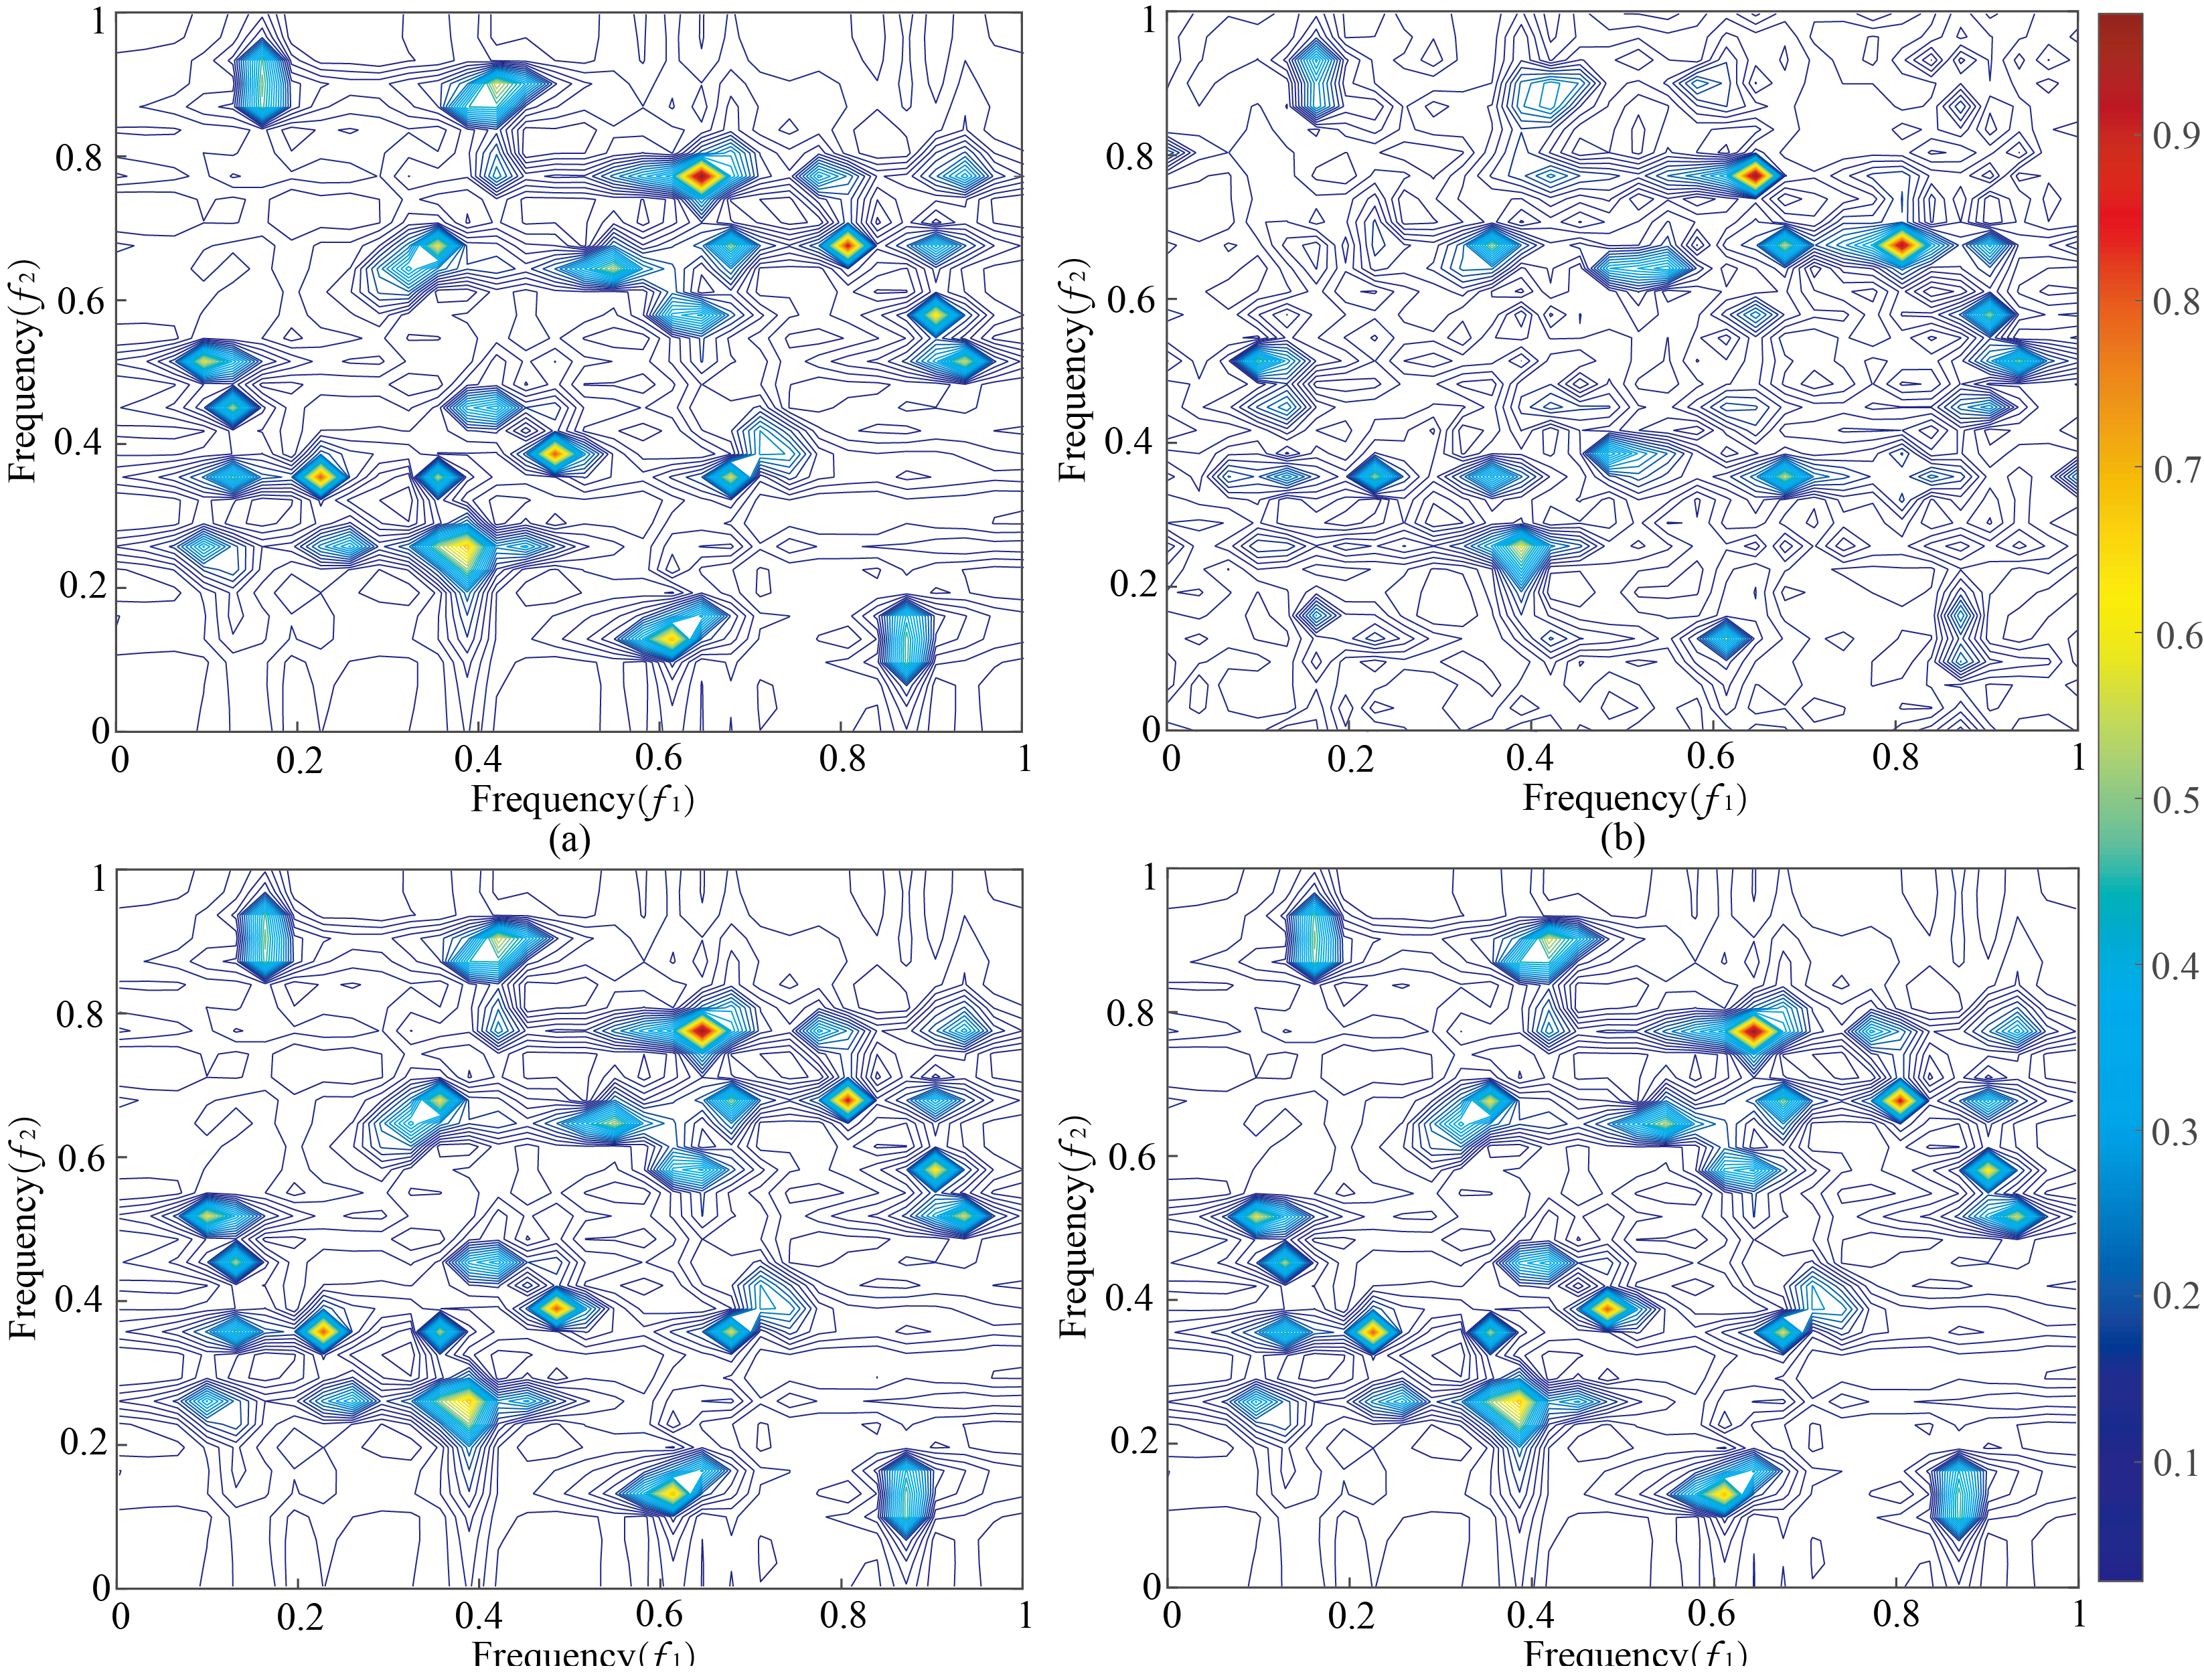
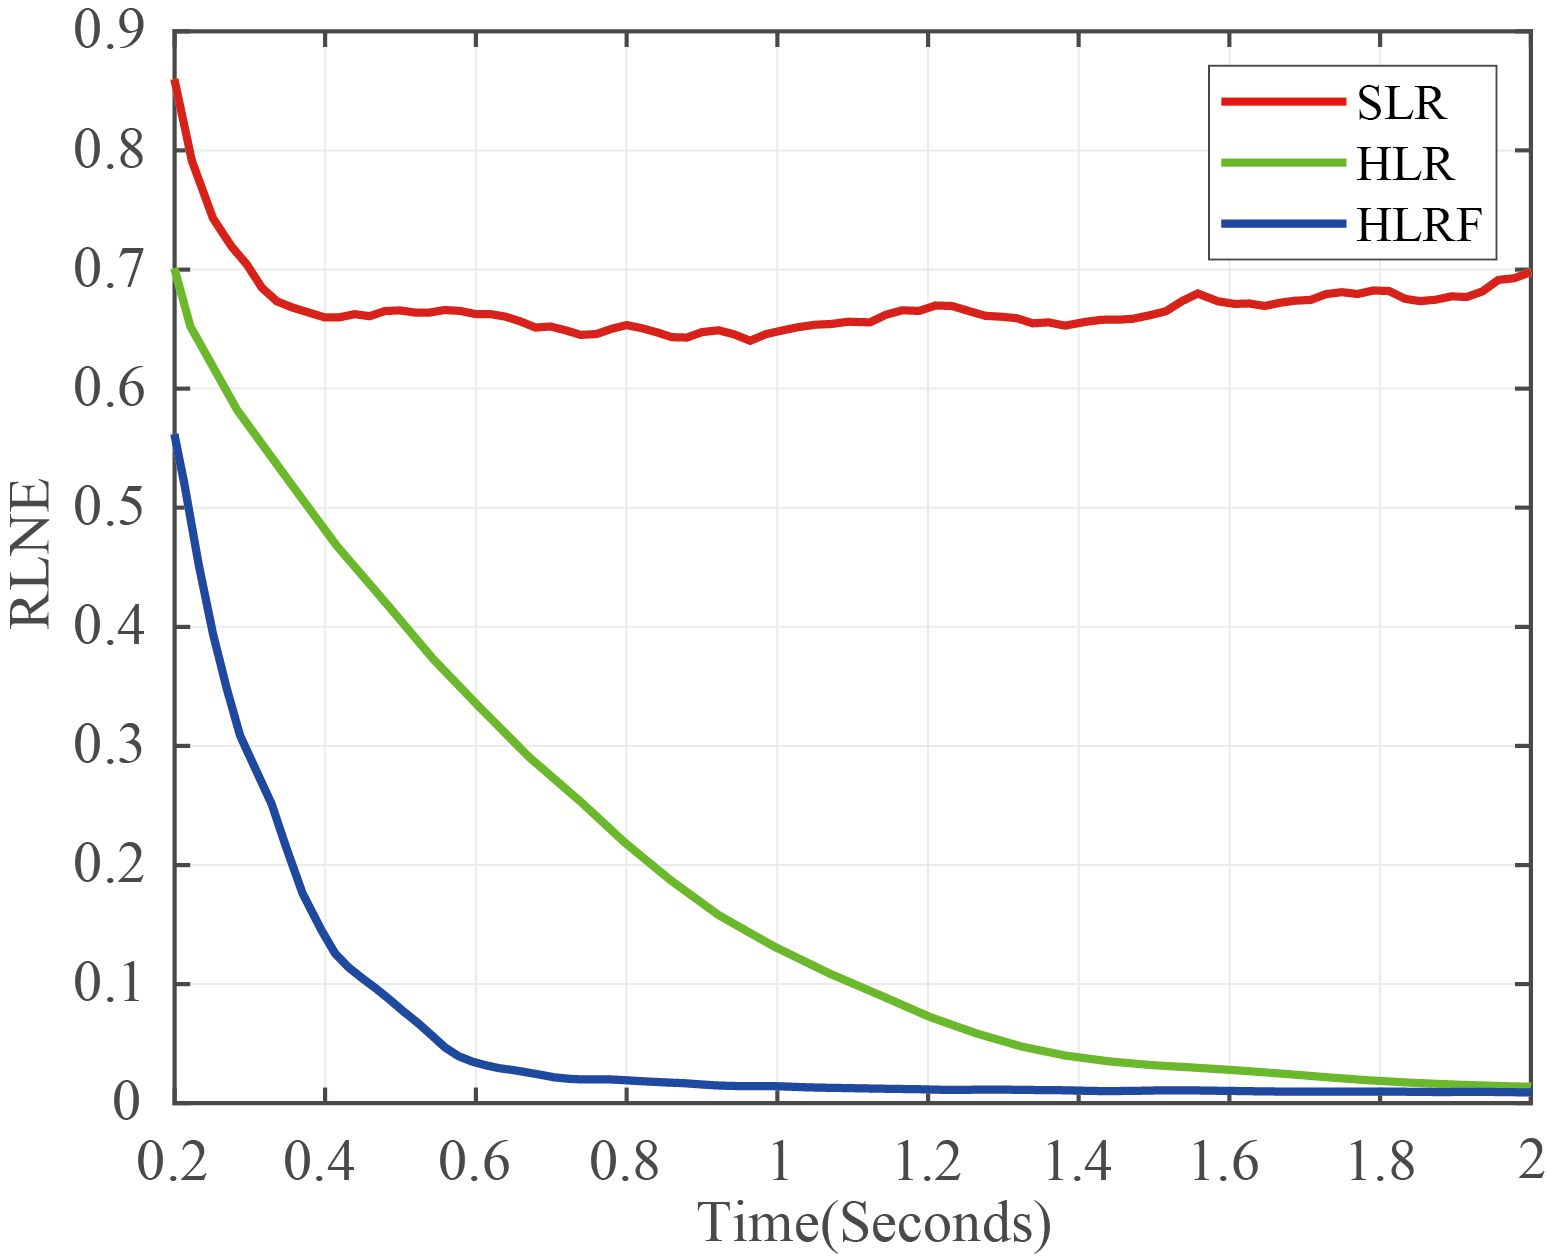
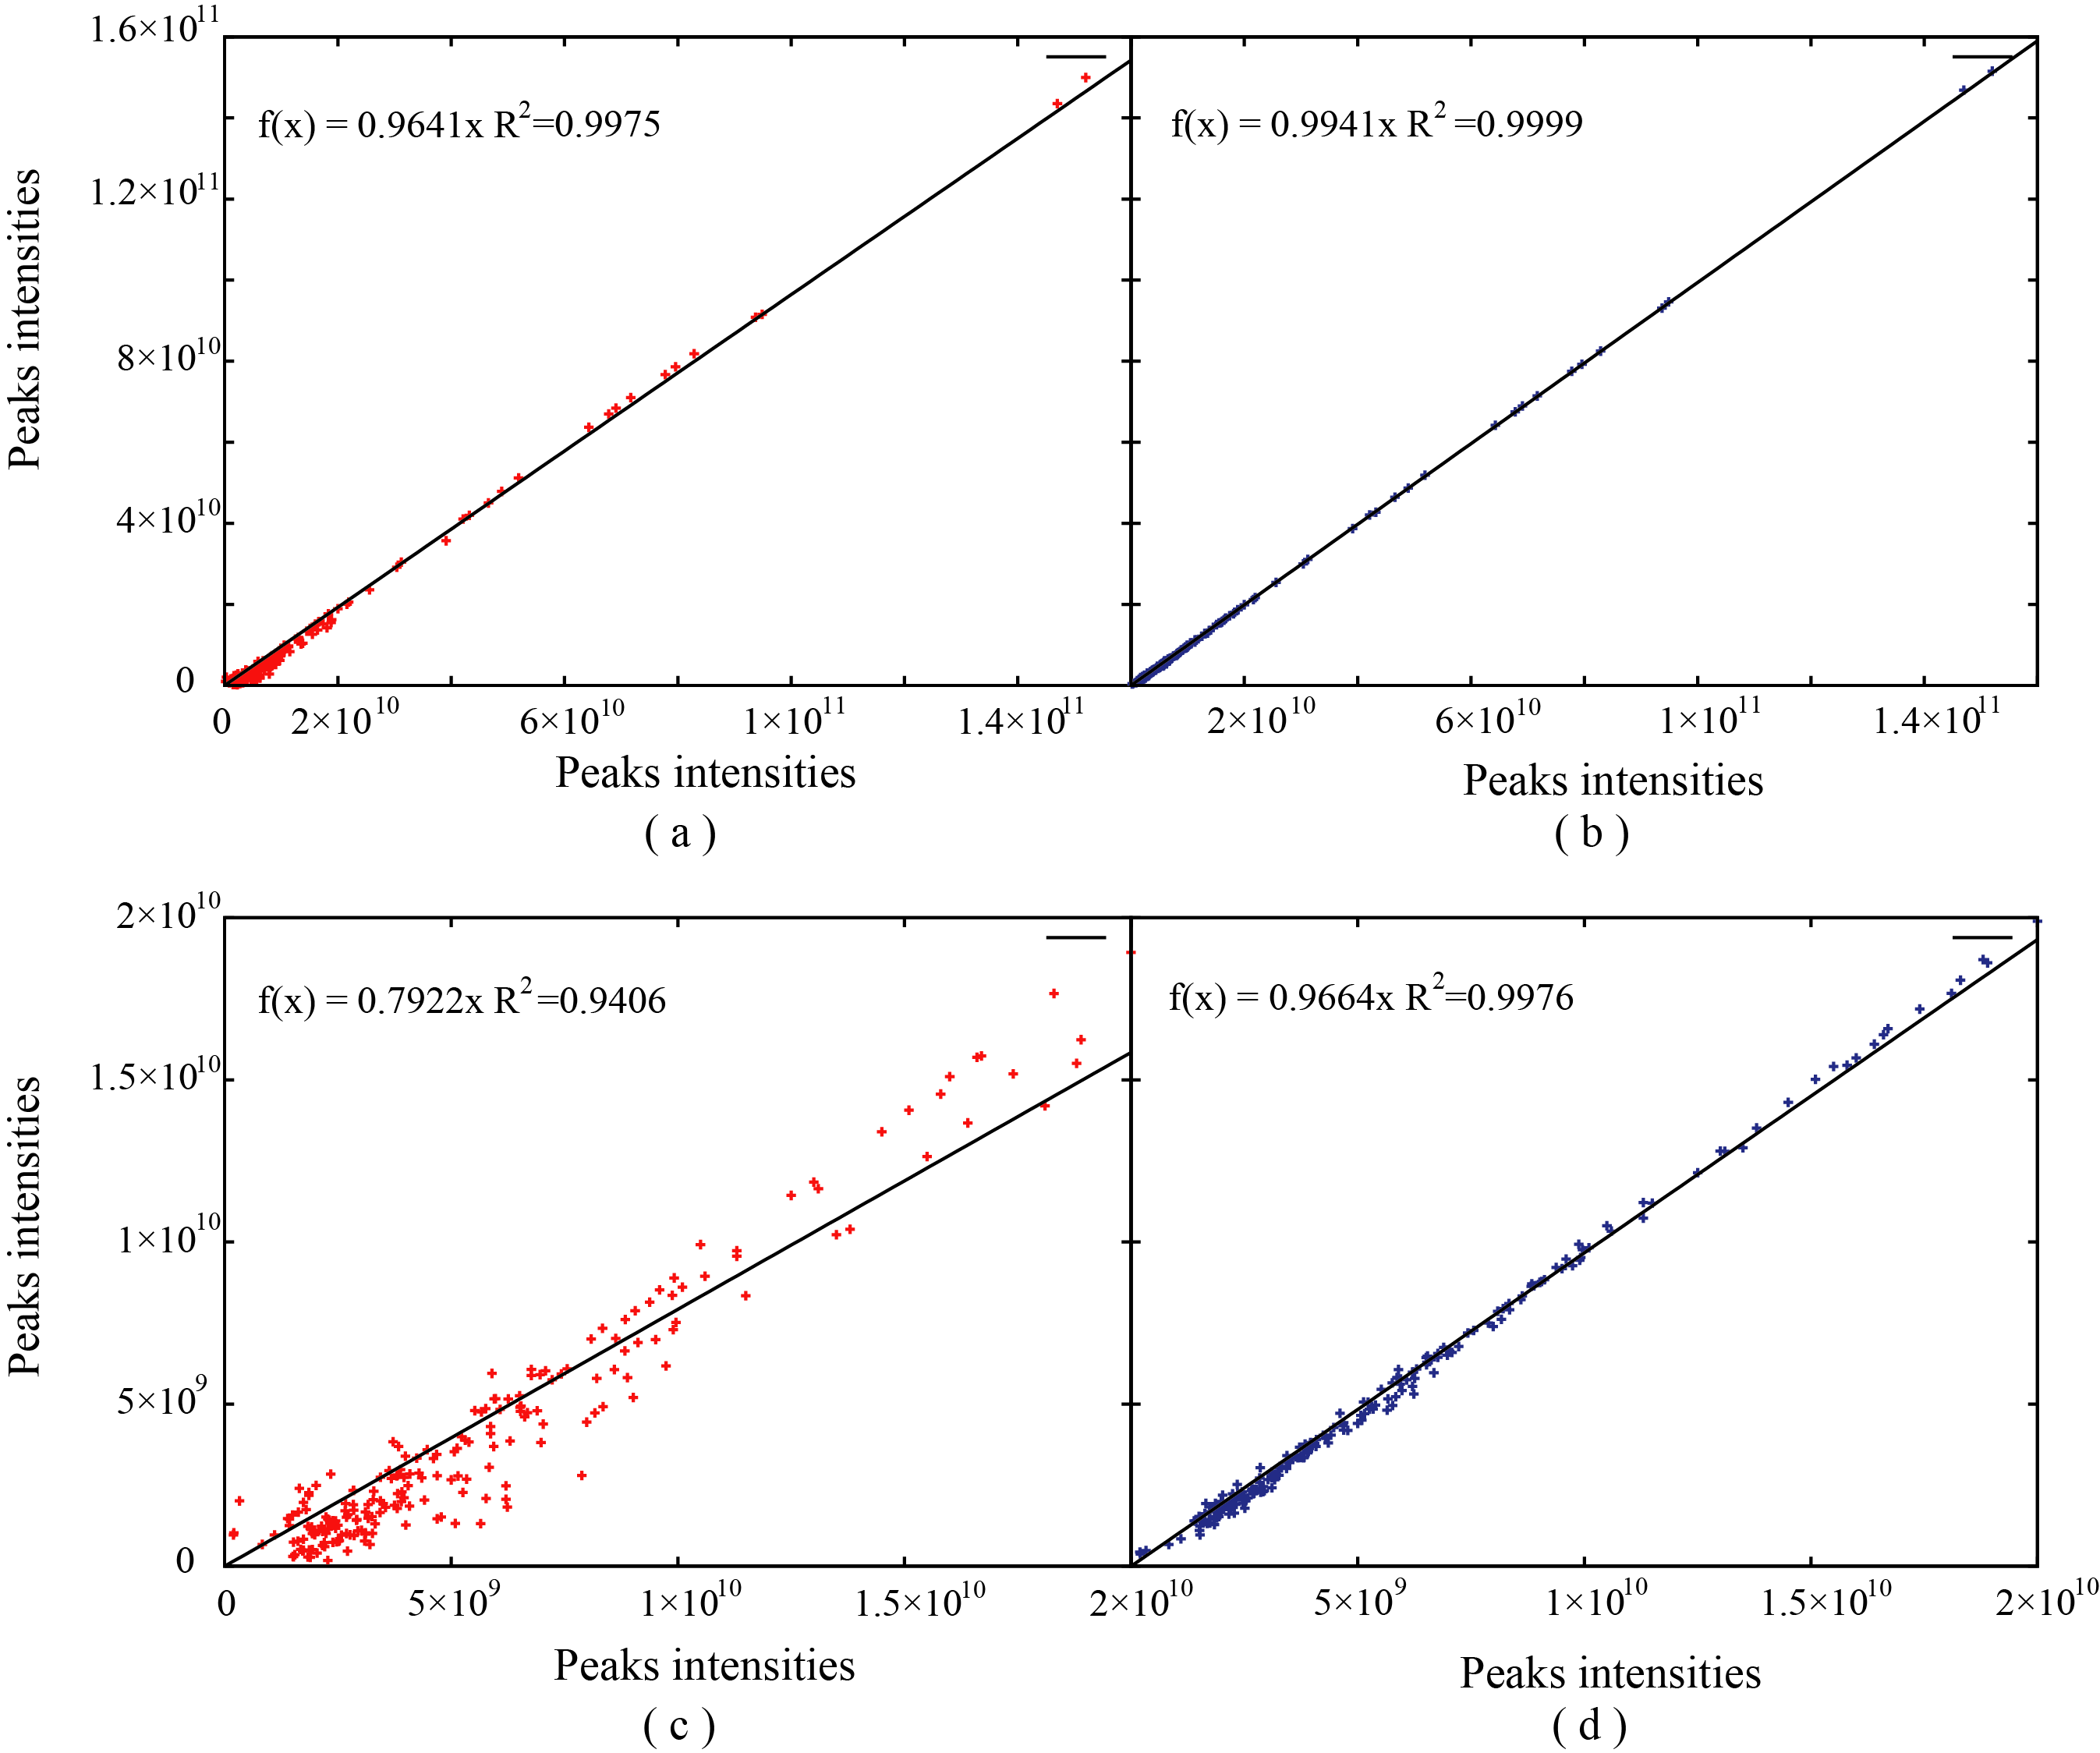
In order to validate the performance, the proposed method is tested on synthetic and realistic NMR data compared to the proposed approach with SLR8. Simultaneously, the relative norm error (RLNE)12 was adopted to quantify reconstruction quality. First, we simulated a 2D hypercomplex NMR signal with the size of 32×32 according to Eq. (1) and added Gaussian noise. Figure 1 shows spectra reconstructed using three methods. While with few sampled data (25% NUS), the peaks are seriously distorted by SLR (Figure 2(b)), these peaks are reconstructed equally well by the HyperLR (Figure 2c) and HyperLRF (Figure 2(d)). Figure 2 shows the RLNEs versus time curves of different reconstruction methods. It is obvious that the RLNEs of the HLRF decreases fastest compared with SLR and HLR. Besides, the HLR and HLRF have lower RLNEs. Then, the result on real data is presented below. Figure 3 shows a reconstruction spectra comparison of the 3D HNCACB spectrum of GB1-HttNTQ7 protein. While most of the spectral peaks are reconstructed successfully at different NUS levels by all their methods, the peak indicated by the arrow is lost by the SLR method but is present in the HyperLRF spectra. The regression analysis in Figure 4 further confirms that HyperLRF provides high fidelity reconstruction.Since cloud computing technology has many practical advantages, we further introduce cloud platform XCloud-HyperLRF to simplify and accelerate the spectra reconstruction with the proposed method. Figure 5 describes the flowchart of XCloud-HyperLRF.
Conclusion
A hypercomplex low-rank approach for reconstructing high-fidelity hypercomplex NMR spectra is proposed under high acceleration factors. Results on synthetic and realistic experimental data demonstrate that the proposed method is effective for hypercomplex data and thus it opens a way to use the high-fidelity low-rank approach for multidimensional spectra that are routinely used in biomolecular NMR. Notably, we further develop an open-access cloud platform, XCloud-HyperLRF, for fast reconstruction with the proposed method.Acknowledgements
This work was supported in part by National Natural Science Foundation of China (6212200447, 61871341, 61971361, 61811530021), Natural Science Foundation of Fujian Province of China (2021J011184), Health-Education Joint Research Project of Fujian Province (2019-WJ-31), Xiamen University Nanqiang Outstanding Talents Program, and the Swedish Foundation for International Cooperation in Research and Higher Education (STINT CH2017-7231). The authors thank Jinfa Ying for assisting in the processing and helpful discussions on the 3D HNCACB spectrum, Tatiana Agback for providing the 3D MALT1 protein. W. He and S. Fang and T. Wu from Information and Network Center of Xiamen University are acknowledged for the help with the GPU computing. The spectra of MALT1 and Azurin were acquired at the Swedish NMR Center.References
[1] V. Jaravine, I. Ibraghimov, and V. Y. Orekhov, “Removal of a time barrier for high-resolution multidimensional NMR spectroscopy,” Nature Methods, vol. 3, no. 8, pp. 605-607, 2006.
[2] H. Zhan, Y. Huang, and Z. Chen, “An orthogonal-pattern absorption-mode 2D J-resolved NMR spectroscopy for analyses on complex samples,” IEEE Transactions on Instrumentation and Measurement, vol. 70, pp. 1-9, 2021.
[3] M. Mobli, and J. C. Hoch, “Nonuniform sampling and non-fourier signal processing methods in multidimensional NMR,” Progress in Nuclear Magnetic Resonance Spectroscopy, vol. 83, pp. 21-41, 2014.
[4] T. Qiu, Z. Wang, H. Liu, D. Guo, and X. Qu, “Review and prospect: NMR spectroscopy denoising and reconstruction with low‐rank Hankel matrices and tensors,” Magnetic Resonance in Chemistry, vol. 59, no. 3, pp. 324-345, 2021.
[5] J. Ying, H. Lu, and Q. Wei, “Hankel matrix nuclear norm regularized tensor completion for N-dimensional exponential signals,” IEEE Transactions on Signal Processing, vol. 65, no. 14, pp. 3702-3717, 2017.
[6] M. W. Maciejewski, M. Fenwick, A. D. Schuyler, A. S. Stern, V. Gorbatyuk, and J. C. Hoch, “Random phase detection in multidimensional NMR,” Proceedings of the National Academy of Sciences of the United States of America, vol. 108, no. 40, pp. 16640-16644, 2011.
[7] A. D. Schuyler, M. W. Maciejewski, A. S. Stern, and J. C. Hoch, “Nonuniform sampling of hypercomplex multidimensional NMR experiments: dimensionality, quadrature phase and Hankel randomization,” Journal of Magnetic Resonance Imaging, vol. 254, pp. 121-130, 2015.
[8] X. Qu, M. Mayzel, J.-F. Cai, Z. Chen, and V. Y. Orekhov, “Accelerated NMR spectroscopy with low‐rank reconstruction,” Angewandte Chemie International Edition, vol. 54, no. 3, pp. 852-854, 2015.
[9] J. C. Hoch, and A. S. Stern, “NMR data processing,” Physics in Medicine and Biology, vol. 42, no. 3, pp. 611, 1997.
[10] N. Srebro, “Learning with matrix factorizations,” 2004.
[11] D. Guo, H. Lu, and X. Qu, “A fast low rank Hankel matrix factorization reconstruction method for non-uniformly sampled magnetic resonance spectroscopy,” IEEE Access, vol. 5, pp. 16033-16039, 2017.
[12] X. Zhang, H. Lu, D. Guo, L. Bao, F. Huang, Q. Xu, and X. Qu, “A guaranteed convergence analysis for the projected fast iterative soft-thresholding algorithm in parallel MRI,” Medical Image Analysis, vol. 69, pp. 101987, 2021.
Figures