3174
MS or not MS: T2-weighted image (T2WI)-based radiomics findings distinguishes MS from its mimics1The First Affiliated Hospital, Nanchang University, Nanchang, China
Synopsis
Multiple sclerosis (MS) is the most common immune-mediated disease of the central nervous system. Early identification of MS lesions and its mimics is very important to help alleviate the tension between the benefits of early diagnosis of MS and inaccurate diagnosis that can have serious health and economic consequences.The radiomics feature model based on T2-weighted images (T2WIs) has obvious clinical value and high specificity in differentiating patients with multiple sclerosis and ischemic demyelination. The high specificity of radiomic model could improve the accuracy of the 2017 McDonald diagnostic criteria for MS, by differentiating it from its mimics-- ischemic demyelination.
Introduction and Purpose
Multiple sclerosis (MS) is an autoimmune disease characterized by the demyelination of the axons in the central nervous system, which is the main cause of disability among young and middle-aged people around the world and results in a considerable social and economic burden 1. Early diagnosis and treatment of MS is the key to preventing disability and depression 2. MS diagnosis remains challenging in the current clinical routine, and the diagnosis relies mainly on MRI examination to showing typical dissemination of lesions in space (DIS) and in time (DIT), according to the 2017 revised McDonald criteria 3. Despite the revised criteria easier to apply with greater sensitivity 4, 5 but less specificity for a patients with an initial demyelinating event 6-10.Ischemic vasculopathy, particularly small-vessel disease, may present mimicking MS on conventional MRI non-enhanced examinations, presenting with multiple periventricular or subcortical lesions and should be included in the differential diagnosis of MS-like lesions 11. It is one of MRI red flags proposed over a decade ago by the European Magnetic Resonance Network in MS (MAGNIMS). In clinical practice of real-world, we often have to face the scenario of middle-aged woman or man with multiple periventricular or subcortical MS-like lesions detected by MRI, whether to consider MS for further enhance scan. Or further, the patient had no enhanced lesions on the enhanced MRI, should the diagnosis of MS be considered at this time? What Distinguishes MS From Its Mimics? In other words, “MS or not MS” should be a good question.
Radiomics can extract high-throughput imaging features from imaging big data for quantitative analysis and extract deep features contained in images that cannot be found by clinicians with the naked eye, thus providing a better basis for medical decision-making 12-14. Radiomics helps to distinguish between different types of neuroimmune demyelinating lesions (MS vs neuromyelitis optica spectrum disorders) 15, 16, it may also provide important information for differentiating from MS-like ischemic lesions.
The aim of our study is to investigate whether T2WI-based radiomics can differentiate MS patients from the patients with MS-like lesions due to ischemic demyelination.
Materials and Methods
A retrospective study was conducted in 38 patients (627 lesions) with MS and 914 patients (2466 lesions) with the mimics lesions of ischemic demyelination in periventricular or subcortical region. All patients underwent 3 T MRI. Four hundred seventy-two radiomics features were extracted from the T2WI of each patient. Intraclass correlation coefficients were used to select the features with excellent stability and repeatability. Then, we used the minimum-redundancy maximum-relevance (mRMR) and the least absolute shrinkage and selection operator (LASSO) algorithms for feature selection. After feature selection, various classifiers (including logistic regression, decision tree, AdaBoost, random forest (RF), or support vector machine (SVM)) were trained. The performance of the classifier was validated in the test set by determining the area under the curve (AUC).Results
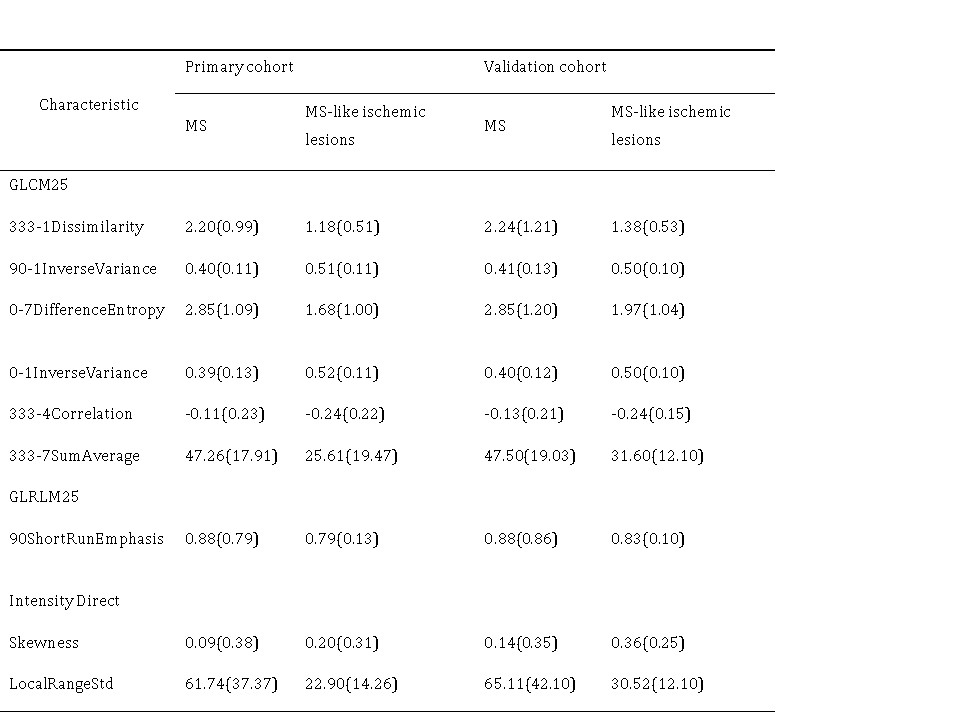
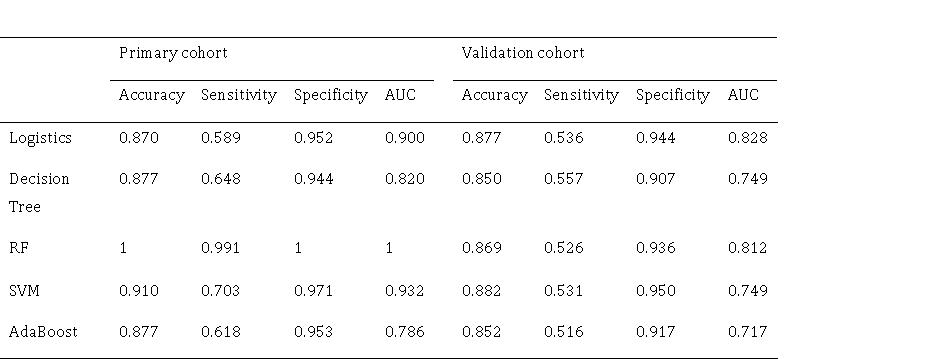
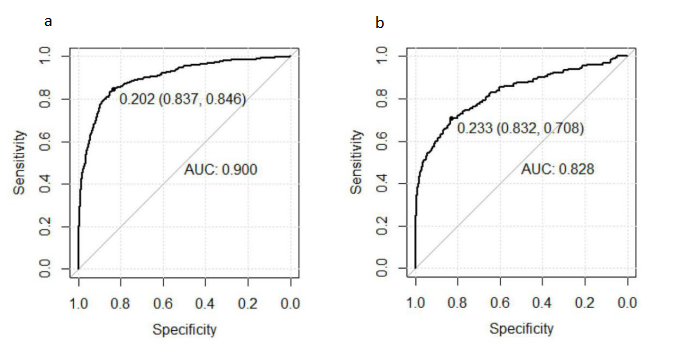
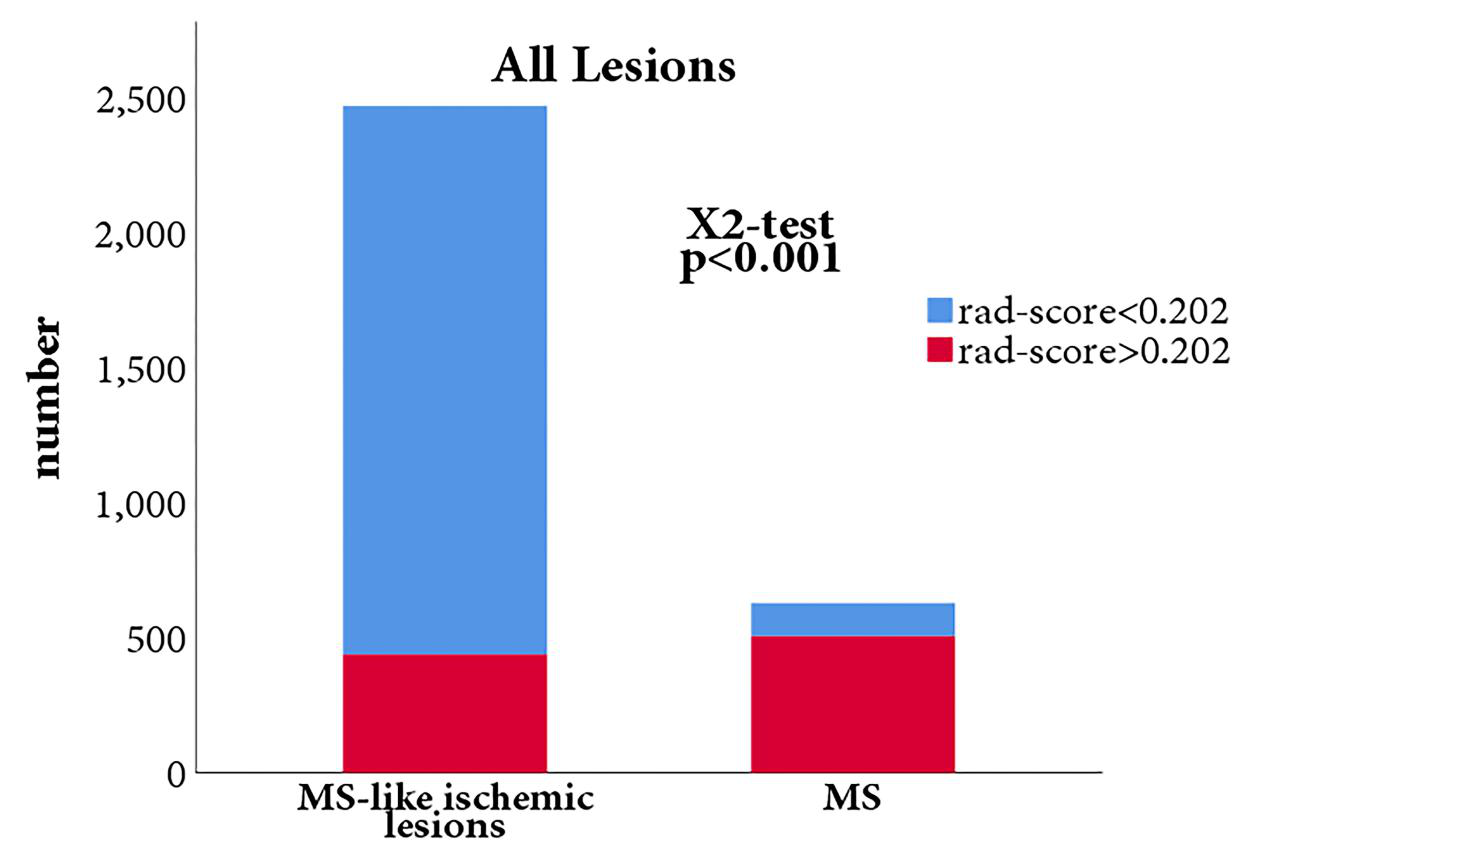
The top 10 features were selected based their mRMR scores. By 10 cross-validations of the LASSO algorithm, nine features were selected to distinguish patients with multiple sclerosis from those with ischemic demyelination (figure 1, table 1). The radiomics signature was significantly different between the MS and ischemic demyelinating patients (p < 0.01). RF and SVM were overfitted. The LASSO logistic regression model was the best performing radiomics model, and the AUC, sensitivity, and specificity were 0.900 (95% CI: 0.883-0.918), 87.0%, 58.9% and 95.2%, respectively, in the training set and 0.828 (95% CI: 0.791-0.864), 87.7%, 53.6% and 94.4%, respectively, in the validation set. Specific numerical differences between radiological classifier models are shown in the table 2. The AUC curve of the LASSO logistic regression model is shown in figure 2.The discriminant ability of the model was calculated according to the score threshold of the LASSO logistic regression model. In the ROC analysis, the optimal threshold of 0.202 was selected by using the Youden index in the training set. According to the model score, all the lesions were divided into high-score and low-score groups. There was a significant difference in the proportion of lesions in different groups of MS and ischemic demyelination patients (figure 3).Conclusion
The T2WI-based radiomics signature can effectively differentiate MS patients from the patients with MS-like lesions due to ischemic demyelination.Discussion
In this study, we investigated whether T2WI-based radiomics characteristics distinguish the lesions of MS from it mimics of ischemic demyelination. A total of nine noninvasive radiomics features were selected for identification. The best radiomics model was obtained by LASSO logistic regression, showing an accuracy of 87.7% in the independent test set, we selected an optimal cutoff value of 0.202 based on the highest Youden index (sensitivity: 84.6%, specificity: 83.7%). Our results suggest that T2WI images of MS lesions were finer, brighter and more heterogeneous than ischemic demyelination. The more serious the myelin and axonal pathology is, the stronger the heterogeneity of tissue texture, and radiological features may provide unique information about the microstructural changes in demyelinating white matter lesions.Acknowledgements
Funding: This work was supported by the National Science Foundation of China (81771808 and 81560284), Jiangxi Provincial key research and development program (20192BBGL70034). The funder had no role in the study design, data collection, and analysis, decision to publish, or preparation of the manuscript.
Declarations of interest: none
References
1. Stenager E. A global perspective on the burden of multiple sclerosis. Lancet Neurol. Mar 2019;18(3):227-228.
2. Feinstein A, Magalhaes S, Richard JF, Audet B, Moore C. The link between multiple sclerosis and depression. Nat Rev Neurol. Sep 2014;10(9):507-517.
3. Thompson AJ, Banwell BL, Barkhof F, et al. Diagnosis of multiple sclerosis: 2017 revisions of the McDonald criteria. Lancet Neurol. Feb 2018;17(2):162-173.
4. Gaetani L, Prosperini L, Mancini A, et al. 2017 revisions of McDonald criteria shorten the time to diagnosis of multiple sclerosis in clinically isolated syndromes. J Neurol. Nov 2018;265(11):2684-2687.
5. Beesley R, Anderson V, Harding KE, et al. Impact of the 2017 revisions to McDonald criteria on the diagnosis of multiple sclerosis. Mult Scler. Nov 2018;24(13):1786-1787.
6. Habek M, Pavičić T, Ruška B, et al. Establishing the diagnosis of multiple sclerosis in Croatian patients with clinically isolated syndrome: 2010 versus 2017 McDonald criteria. Mult Scler Relat Disord. Oct 2018;25:99-103.
7. Hyun JW, Kim W, Huh SY, et al. Application of the 2017 McDonald diagnostic criteria for multiple sclerosis in Korean patients with clinically isolated syndrome. Mult Scler. Oct 2019;25(11):1488-1495.
8. van der Vuurst de Vries RM, Mescheriakova JY, Wong YYM, et al. Application of the 2017 Revised McDonald Criteria for Multiple Sclerosis to Patients With a Typical Clinically Isolated Syndrome. JAMA Neurol. Nov 1 2018;75(11):1392-1398.
9. Gobbin F, Zanoni M, Marangi A, et al. 2017 McDonald criteria for multiple sclerosis: Earlier diagnosis with reduced specificity? Mult Scler Relat Disord. Apr 2019;29:23-25.
10. Wong YYM, de Mol CL, van der Vuurst de Vries RM, et al. Real-world validation of the 2017 McDonald criteria for pediatric MS. Neurol Neuroimmunol Neuroinflamm. Mar 2019;6(2):e528.
11. Geraldes R, Ciccarelli O, Barkhof F, et al. The current role of MRI in differentiating multiple sclerosis from its imaging mimics. Nat Rev Neurol. Mar 20 2018;14(4):213. 12. Lambin P, Rios-Velazquez E, Leijenaar R, et al. Radiomics: extracting more information from medical images using advanced feature analysis. Eur J Cancer. Mar 2012;48(4):441-446.
13. Lambin P, Leijenaar RTH, Deist TM, et al. Radiomics: the bridge between medical imaging and personalized medicine. Nat Rev Clin Oncol. Dec 2017;14(12):749-762.
14. Gillies RJ, Kinahan PE, Hricak H. Radiomics: Images Are More than Pictures, They Are Data. Radiology. Feb 2016;278(2):563-577.
15. Liu Y, Dong D, Zhang L, et al. Radiomics in multiple sclerosis and neuromyelitis optica spectrum disorder. Eur Radiol. Sep 2019;29(9):4670-4677.
16. Ma X, Zhang L, Huang D, et al. Quantitative radiomic biomarkers for discrimination between neuromyelitis optica spectrum disorder and multiple sclerosis. J Magn Reson Imaging. Apr 2019;49(4):1113-1121.
Figures
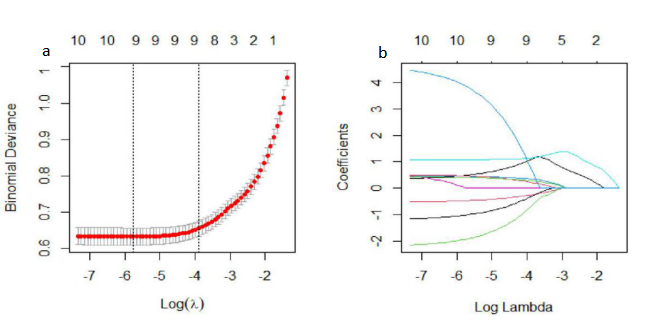
(a) Selection of the tuning parameter (lambda) in the LASSO model using 10-fold cross-validation. Binomial deviances from the LASSO regression cross-validation model were plotted as a function of log (lambda). An optimal lambda value of 0.020 with log (lambda) = -3.912 and 9 nonzero coefficients were selected. (b) LASSO coefficient profiles of the 10 texture features. A vertical line was drawn at the optimal value selected using the 10-fold cross-validation process in (a).