3171
Association between white matter hyperintensity and diabetes-related mild cognitive impairment1Yiwei Medical Technology, Shenzhen, China, 2Department of Radiology, Wuxi No2. People’s Hospital, Affiliated Wuxi Clinical College of Nantong University, Wuxi, China
Synopsis
White matter hyperintensities (WMH) features may assist detecting diabetes-related MCI. We aimed to identify the correlations between WMH and MCI in T2D using brain magnetic resonance imaging. Fifty participants, matched for age, were included. Total and regional WMH volumes were calculated using automated segmentation approach. WMH patterns were compared between groups using a voxel-wise analysis. Results show that cognitive impairment was related to a higher prevalence of regional WMH. Subcortical WMH volumes in specific brain regions. The findings suggested that the presence of WMH in specific regions rather the WMH volumes appears to be correlated with the MCI in T2D.
INTRODUCTION
Type 2 diabetes (T2D) is regarded as a risk factor for mild cognitive impairment MCI 1, 2. Early cognitive interventions has shown potential benefit for prevention of the progression of dementia 3. White matter hyperintensities (WMH), visualized as areas of high signal intensity on T2 weighted imaging (T2WI), have been regarded as a risk factor of cognitive function impairment 4, 5. This study aimed to explore the WMH abnormalities related to MCI in type 2 diabetes (T2D) patients using multimodal MRI brain images by 1) examining the global and regional WMH burden using the WMH volume, 2) detecting differences in spatial distributions of WMH across the groups on a voxel-wise basis using the WMH map.METHODS
Participants: Total fifty participants, were included in this study with mean age of 55.5 ± 5.5 years. Medical histories of these outpatients were reviewed, appropriate clinical and cognitive tests were conducted by trained healthcare professionals. Among them, there were eighteen T2D patients with normal cognitive function (T2D group, mean age: 55.6 ± 7.5 years); eighteen T2D patients having MCI (T2D-MCI group, mean age: 57.0 ± 5.2 years) and fourteen controls people (HC group, mean age: 53.3 ± 5.4 years). The study protocol was approved by the local ethical committee. MRI Data Acquisition: MRI data were acquired using a Siemens 3 Tesla MRI scanner. T1-weighted images (TR/TE = 2300/3 ms, slice thickness = 1.1 mm) and T2-weighted fluid-attenuated inversion recovery (T2 FLAIR) images (TR/TE = 8500/81 ms, slice thickness = 5 mm) were used.Imaging Analysis: Voxel-based analysis was applied to investigate the association between the presence of WMH and MCI. Briefly, T1-weighted images (T1WI) and FLAIR images were co-registered in T1 space and were normalized to Montreal Neurological Institute (MNI) space using SPM 12; then WMH was automatically segmented using FLAIR images by the lesion prediction algorithm (LPA) implemented in SPM. To quantify the WMH burden, WMH volumes were calculated and normalized by the corresponding total intracranial volume (TIV). 68 brain regions were specified for regional WMH classification using an adult brain atlas: the Hammer atlas 6. Based on the brain anatomy, the specified regional WMHs were classified into periventricular WMH (PWMH) and deep WMH (DWMH). Statistical tests were conducted using the SPSS software. Continuous variables comparisons among groups were performed using the Kruskal-Wallis test as appropriate, followed by the Dunn’s test as post hoc analysis. A p-value lower than 0.05 was considered statistically significant. In order to investigate the association between WMH voxels and MCI, a voxel-based analysis was conducted using the Liebermeister test implemented on the MRIcron software package 8. The presence of MCI was regarded as the dependent variable. To isolate the WMH abnormalities associated with MCI on top of just having T2D, the between-group voxel differences (HC versus T2D-MCI, and T2D versus T2D-MCI) were compared. The difference set of the results were assumed to be WMH voxels that may contribute to MCI in diabetic patients.
RESULTS
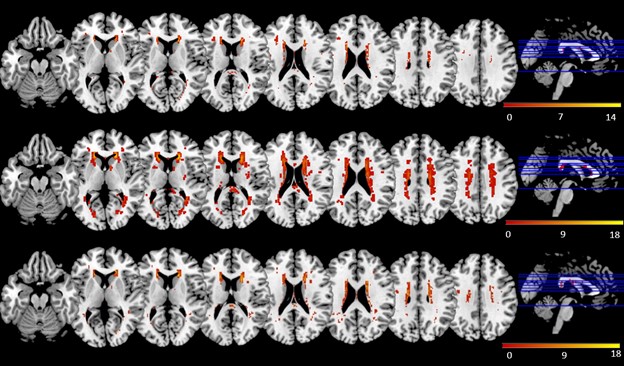
WMH Volume: T2D-MCI group had the largest median total WMH volume compared to HC and T2D group (0.031% versus 0.020% and 0.025%), and the narrowest interquartile range (lower quartile: 0.014%, upper quartile: 0.064%). However, the differences did not significant (p = 0.549).Distribution of WMH: The overlayed WMH distribution maps were shown in Figure 1. WMH was consistent in the periventricular region and diffuse in the subcortical region in all groups, while in the periventricular region, WMH at posterior caps was notable in the T2D group only. In addition, WMHs in the left insula and left thalamus were detected in T2D and T2D-MCI, but not in the HC. The post hoc analysis revealed a significant result between HC and T2D-MCI group in left insula (p = 0.00).
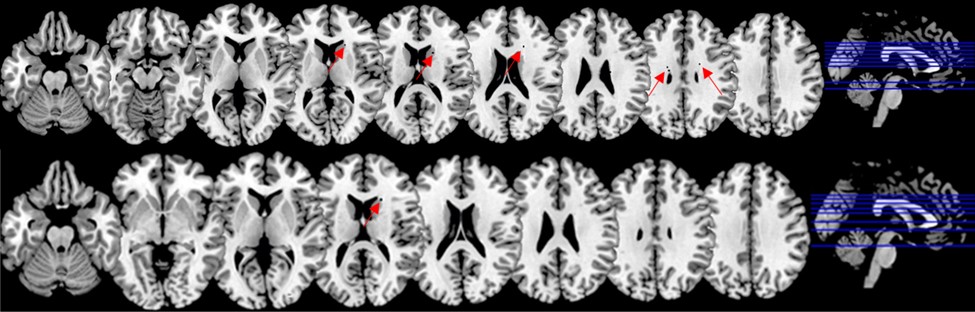
Incidence of WMH and the presence of MCI: The Liebermeister test result was shown in Figure 2, and the voxels that had a significant association with the presence of MCI were highlighted by arrows. A total of 15 WMH voxels in subcortical and periventricular regions were related to the presence of MCI between the HC and T2D-MCI group (p<0.05); 2 WMH voxels in subcortical region were significantly associated with the presence of MCI between T2D and T2D-MCI (p<0.05). The structures that revealed a significant result were identified by registering the statistical map to the atlas, and the difference set consisted of right temporal lobe and left inferior parietal lobe (z = 1.99, p < 0.05).
DISCUSSION and CONCLUSION
Distributions and incidences of WMH were analyzed in diabetic patients. Diabetic patients have more chances to have WMH especially in the patients with cognitive impairment. Specifically, our studies indicated that left insula, left inferior parietal lobe and right temporal lobe were likely to be insulted, which may indicate the insults of vessels. Our method may provide a useful information for quantitatively analysis of WMH.Acknowledgements
No acknowledgement found.References
1. W. Li, L. Sun, G. Li, and S. Xiao, ‘Prevalence, influence factors and cognitive characteristics of mild cognitive impairment in type 2 diabetes mellitus’, Front. Aging Neurosci., vol. 11, 2019, doi: 10.3389/fnagi.2019.00180.
2. G. Cheng, C. Huang, H. Deng, and H. Wang, ‘Diabetes as a risk factor for dementia and mild cognitive impairment: a meta-analysis of longitudinal studies: Diabetes and cognitive function’, Internal Medicine Journal, vol. 42, no. 5, Art. no. 5, May 2012, doi: 10.1111/j.1445-5994.2012.02758.x.
3. Harvard Health, ‘Understanding mild cognitive impairment’, Dec. 22, 2020. https://www.health.harvard.edu/promotions/harvard-health-publications/mild-cognitive-impairment (accessed Dec. 22, 2020).
4. N. J. Gates, P. S. Sachdev, M. A. Fiatarone Singh, and M. Valenzuela, ‘Cognitive and memory training in adults at risk of dementia: A systematic review’, BMC Geriatrics, vol. 11, no. 1, p. 55, Sep. 2011, doi: 10.1186/1471-2318-11-55.
5. E. Smith et al., ‘Magnetic resonance imaging white matter hyperintensities and brain volume in the prediction of mild cognitive impairment and dementia’, Arch Neurol, vol. 65, no. 1, Art. no. 1, Jan. 2008, doi: 10.1001/archneurol.2007.23.
6. J. Alber et al., ‘White matter hyperintensities in vascular contributions to cognitive impairment and dementia (VCID): Knowledge gaps and opportunities’, Alzheimers Dement (N Y), vol. 5, pp. 107–117, Apr. 2019, doi: 10.1016/j.trci.2019.02.001.
7. Biomedical Image Analysis Group, Imperial College London, ‘Adult brain maximum probability map (“Hammersmith atlas”; n30r83) in MNI space – Brain Development’. http://brain-development.org/brain-atlases/adult-brain-atlases/adult-brain-maximum-probability-map-hammers-mith-atlas-n30r83-in-mni-space/ (accessed Dec. 24, 2020).
8. C. Rorden, H.-O. Karnath, and L. Bonilha, ‘Improving lesion-symptom mapping’, Journal of Cognitive Neuroscience, vol. 19, no. 7, Art. no. 7, Jul. 2007, doi: 10.1162/jocn.2007.19.7.1081.
Figures