3166
Classifier fusion improves prostate cancer detection using MP-MRI11- Department of Medical Radiation Engineering, Science and Research Branch, Islamic Azad University, Tehran, Iran (Islamic Republic of), 22- Department of Radiology Technology, School of Allied Medical Sciences, Shahid Beheshti University of Medical Sciences, Tehran, Iran (Islamic Republic of), 3Tehran University of Medical Science, Tehran, Iran (Islamic Republic of), 4Quantitative MR Imaging and Spectroscopy Group, Research Center for Molecular and Cellular Imaging, Tehran University of Medical Sciences, Tehran, Iran (Islamic Republic of), 53- Department of Radiology, Hazrat Rasoul Akram Hospital, School of Medicine, Iran University of Medical Sciences, Tehran, Iran (Islamic Republic of)
Synopsis
Multiparametric MRI (MP-MRI) has been widely used for detection of Prostate Cancer (PCa). In this study, we propose a new method using MP-MRI including T2-weighted (T2W) and dynamic contrast enhanced (DCE-) MRI for detection of PCa. 32 patients who had high prostate specific antigen (PSA) level recruited. We generated predictive models by extracting radiomics features and classifying benign and malignant lesions. The feature scores are evaluated with Relieff feature selection for each of the modalities. The fused classifier using decision template method showed the highest performance with accuracy, specificity, and sensitivity of 100.
Introduction
In recent years, prostate cancer (PCa) has become the most common cancer among men, especially those aged 50 years and older in the world. Prostate-specific antigen (PSA) screening can lead to diagnose more men with localized, low-risk, and low-grade PCa [1]. Although the PSA test has a lack of specificity in PCa detection, it is basic and is utilized for PCa diagnosis [2, 3]. In patients with rising PSA and/or with abnormal digital rectal examination (DRE), random systematic transrectal ultrasound (TRUS) guided prostate biopsy is the most commonly used technique for PCa diagnosis. DRE fails in detecting many tumors originating in the different zones of prostate, as well as tumors that are too small to be palpated [4, 5]. Over 20% of the PCa-positive subjects are missed or under-sampled during the first TRUS prostate biopsy session [5, 6]. The most useful and accurate imaging modality PCa is MP-MRI that can be used as a digital biopsy and can suggest new possibilities in detection, characterization, and staging of PCa [7]. Accurate PCa classification is the first and vital step in PCa management and treatment. In contrast to semantic features, the huge range of quantitative features, called radiomic, can be extracted and evaluated to perform prostate stratification and classify the malignant and benign prostate lesions [8]. The current study was aimed to evaluate the performance of a radiomic model using T2-W and DCE images to diagnose PCa known as malignant tumors.Methodology and Algorithm
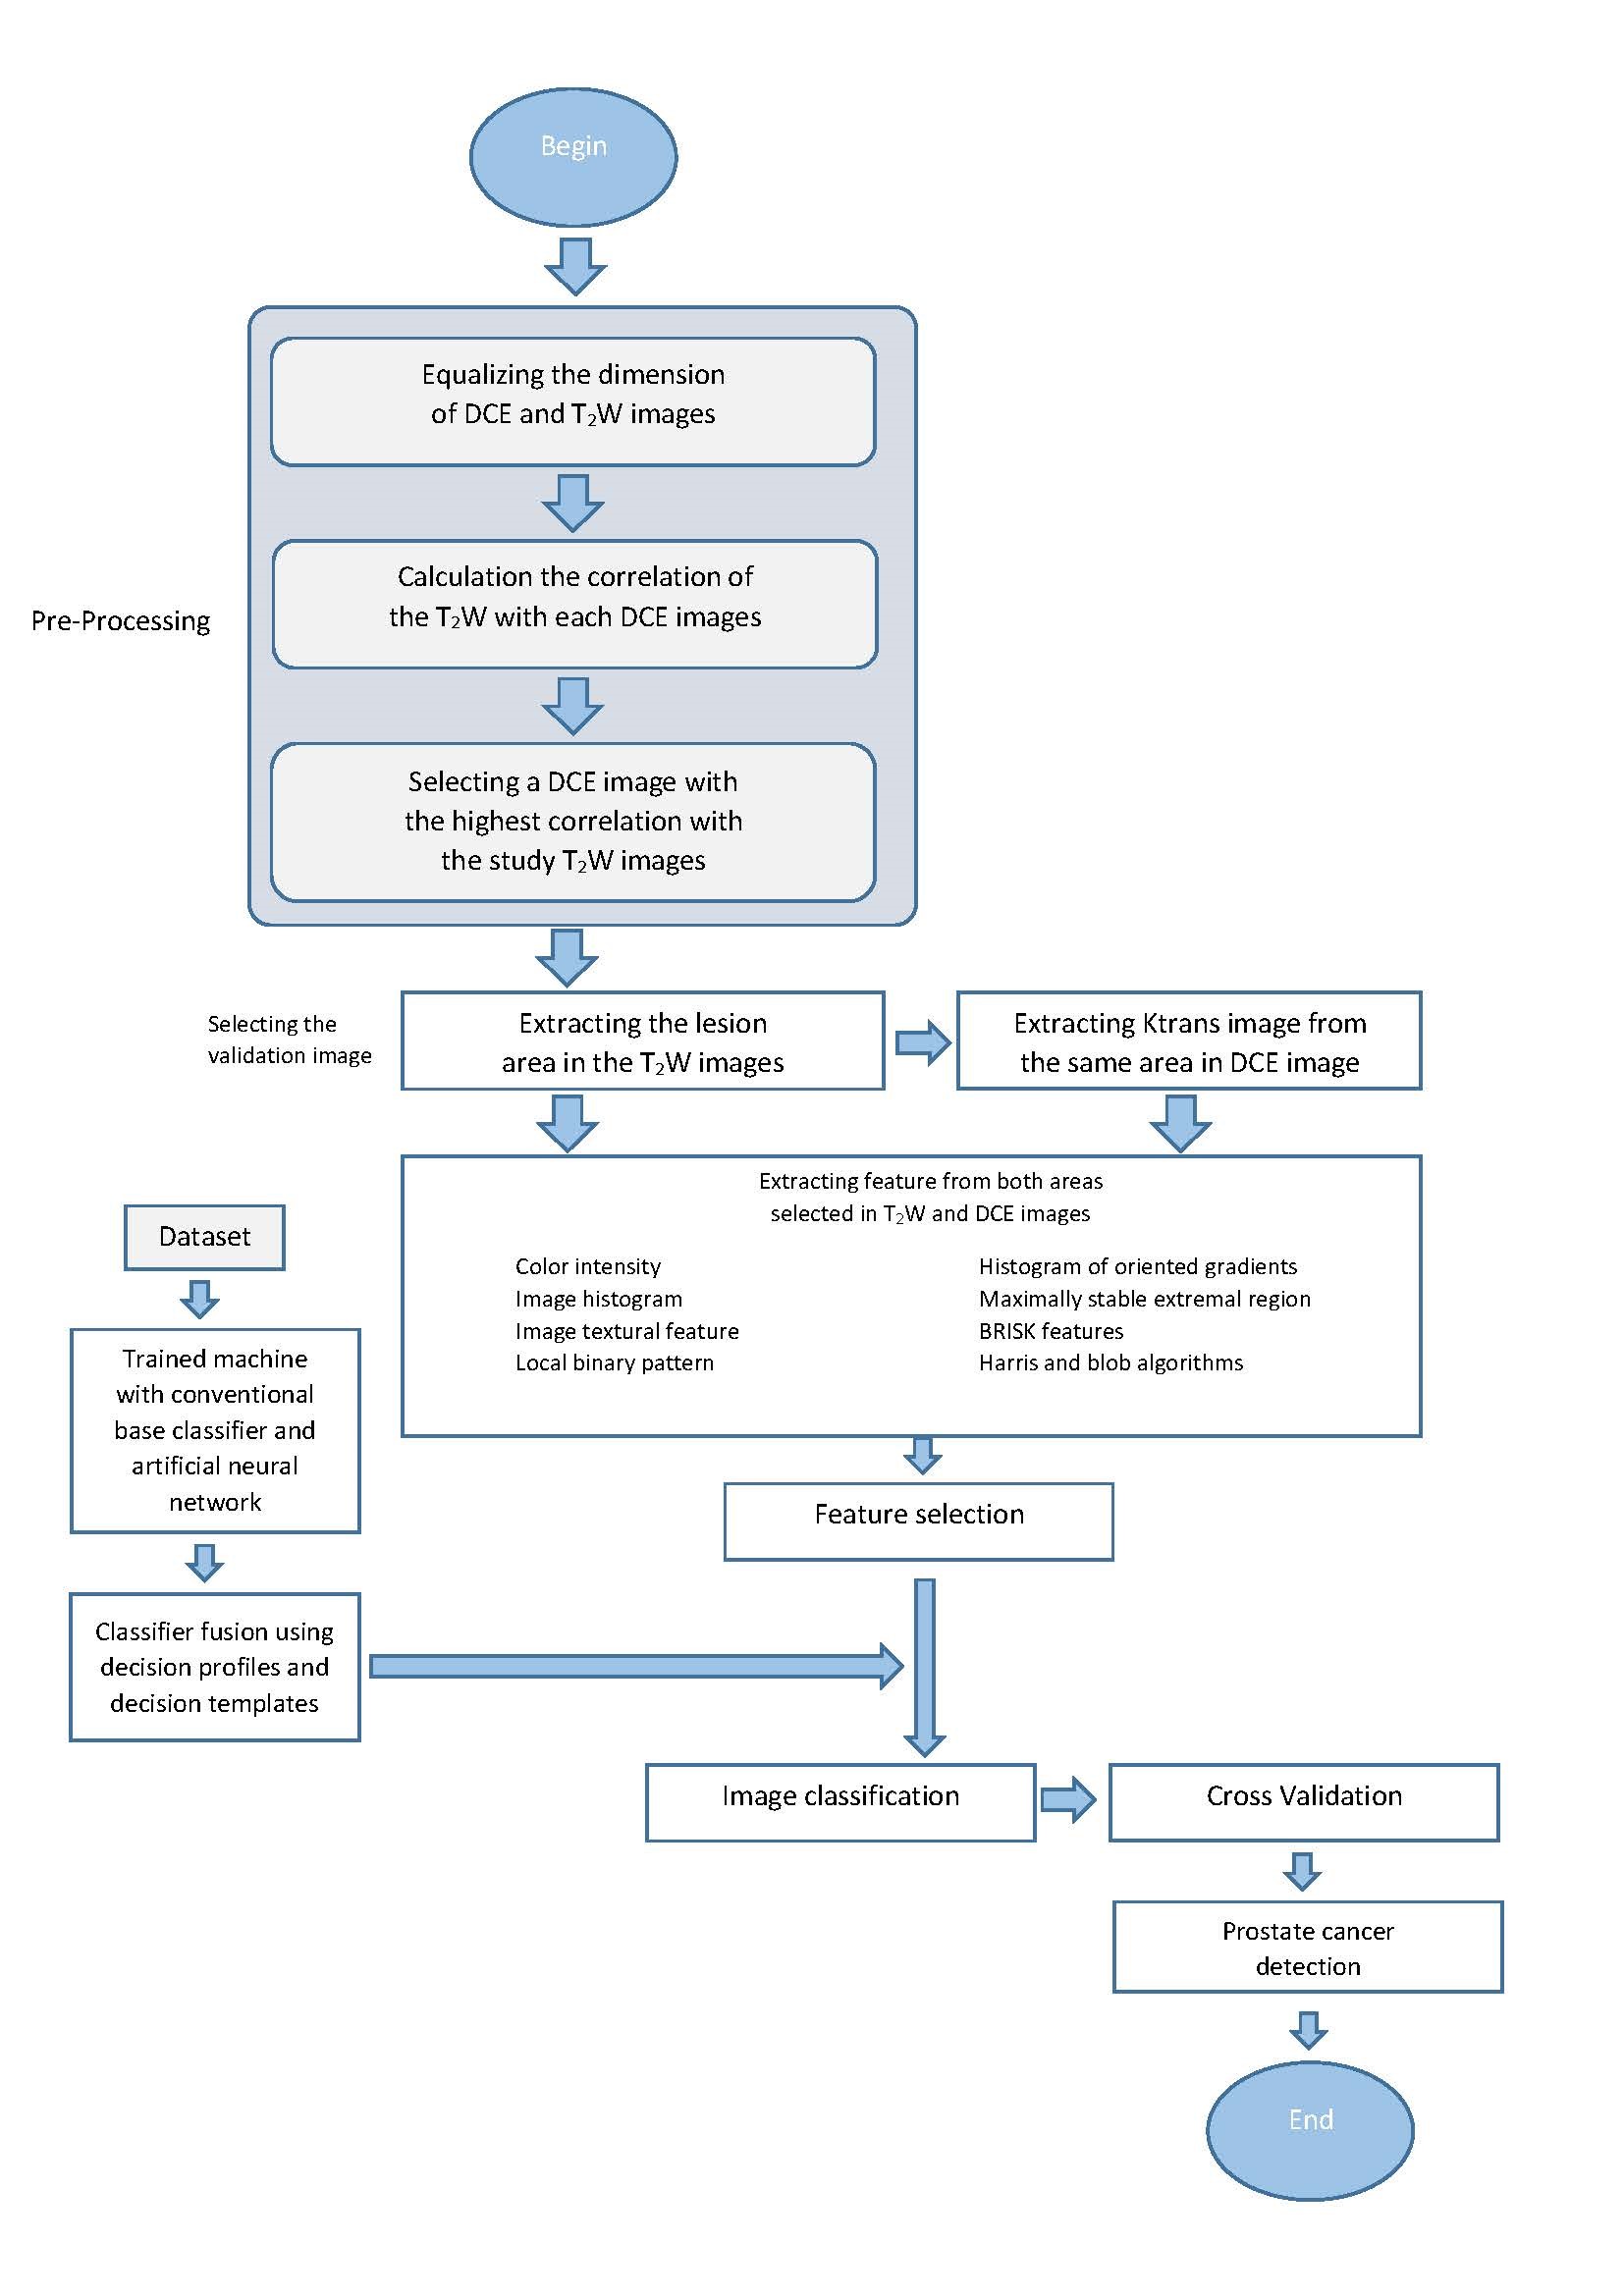
Dataset In this research, the dataset is collected from the archive of Hazrat Rasoul Akram University-affiliated hospital (Tehran, Iran), which contains 32-anonymized-men subjects with a mean age of approximately 64 years, with higher than normal PSA level for three consecutive months, abnormal DRE tests, or family history of PCa were included. All the patients underwent the MRI scan on a 1.5 T scanner (Magnetom Avanto, Siemens Healthcare, and Erlangen, Germany) using a body coil for signal transmission, a phased-array body coil, and an endorectal coil (MEDRAD). The MP-MRI data were derived from T2W and DCE-MRI.The proposed algorithm for diagnosing PCa using T2-W and DCE images is shown in Figure 1. Initially, a pre-processing stage is performed on the T2-W and DCE images. The image in which the biopsy region is considered by the expert of Urogenital radiologist is a T2-W image and the Region of interests (ROI) identified by him from the biopsies (categorized to malignant and benign lesions). Afterwards, radiomics features extraction and selection are considered from the ROIs for machine-learning techniques. After features selection were used to train and test data using leave-one-out cross-validation approach. Classifier fusion algorithms were used to improve the results. In each method, the class rankings for each sample are considered and the maximum result would be the output of classifier fusion. Finally, the decision template method that uses the information of confusion matrices of the classifiers was implemented. It is used as a combiner that is trainable, simple and effective in multiple classifier rule.
Results
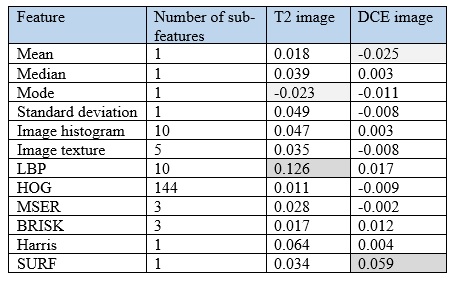
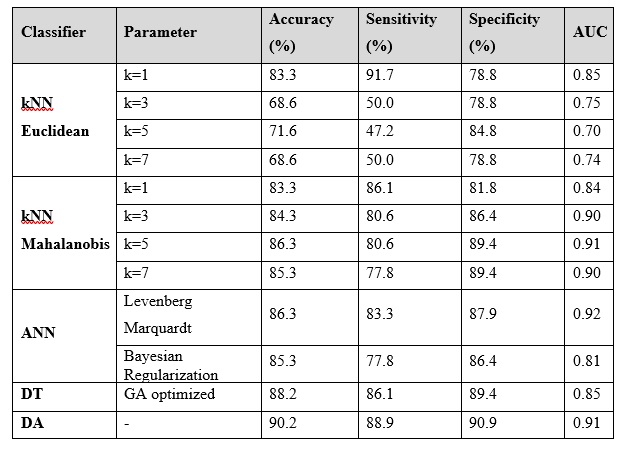
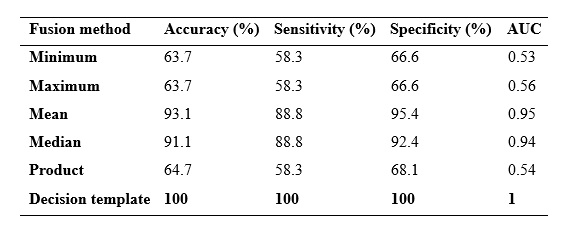
According to table 1. number of features for both modalities totally were 362 where the best and the worst weigh of feature selection ranking are shown.Moreover, the performance including accuracy, sensitivity, specificity and area under the curve (AUC)of the base classifier and the fusion method are specified in table 2 and 3 respectively.
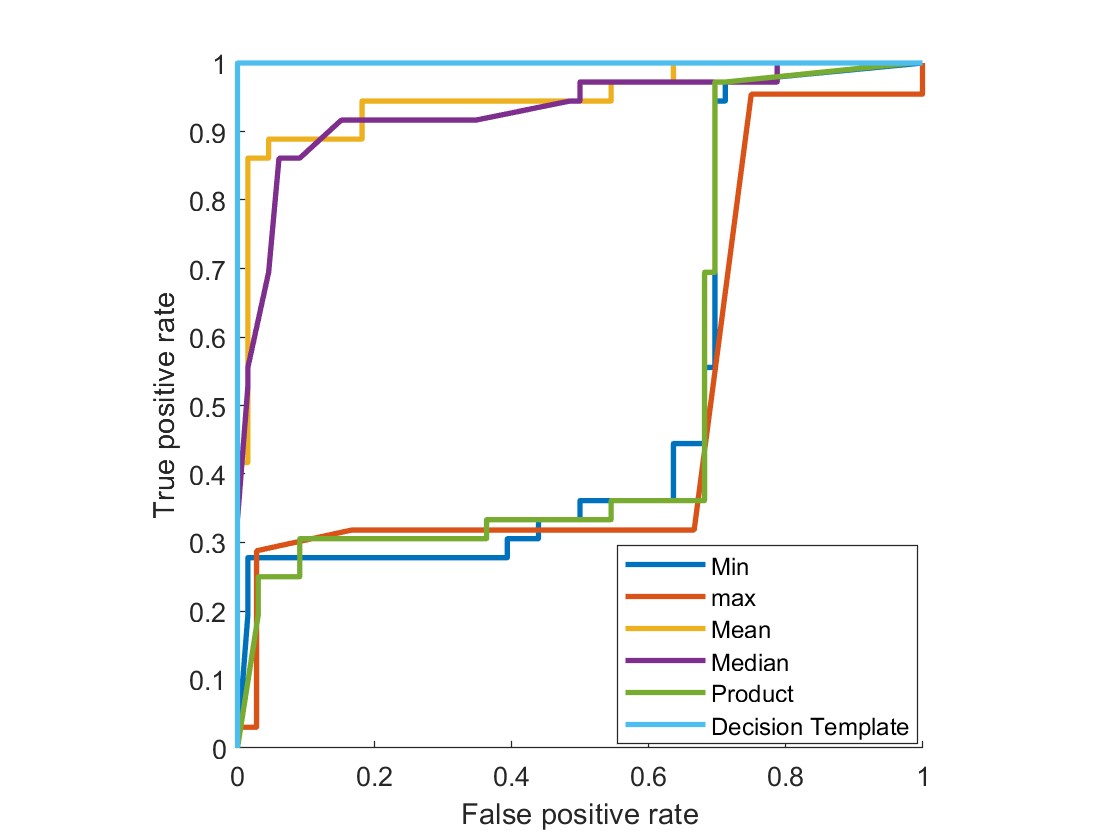
KNN (K=1 in Euclidean and K=5 in Mahalanobis) and ANN (Levenberg Marquardt) were used for classifier fusion. The results of the classifier fusion are summarized in Table 3. As it is shown, classifier fusion improves the performance of PCa diagnosis since sensitivity, accuracy, and specificity values of the fused classifier with the Decision Template method were found to be 100%. Therefore, classifier fusion can be considered as a reliable technique to fuse the important information of simple classifiers to provide promising results in diagnosing PCa.
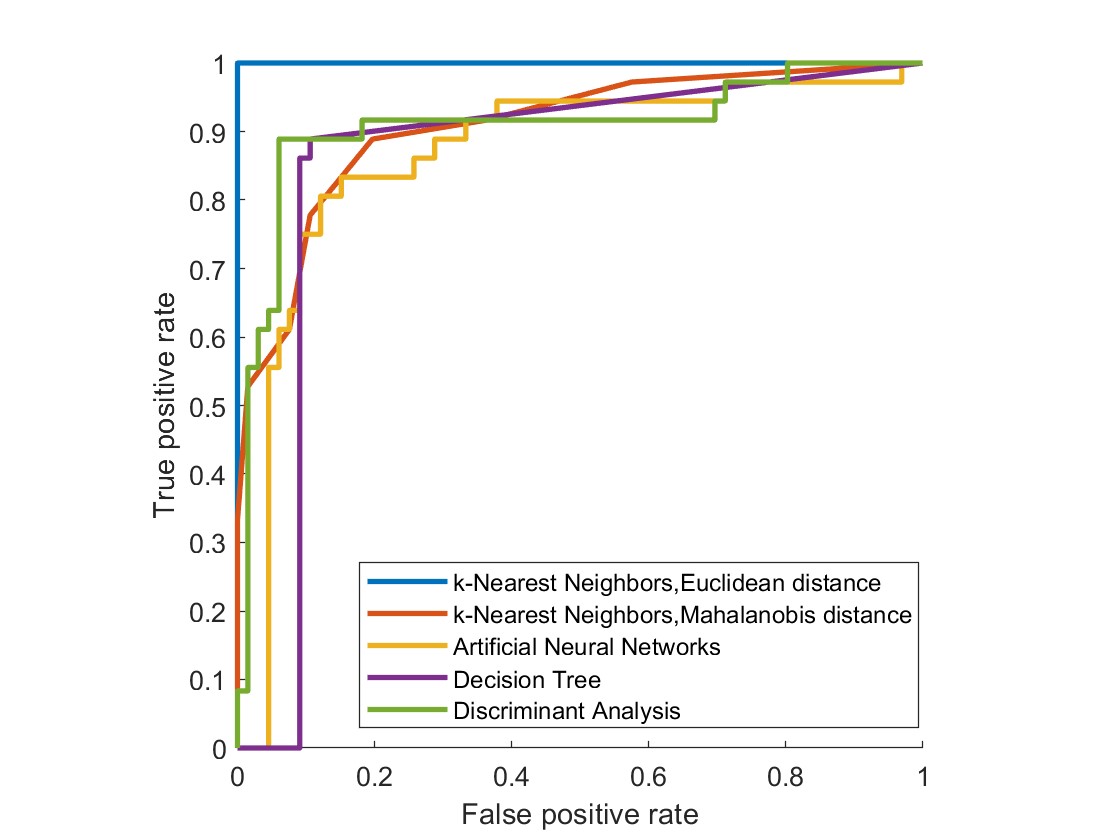
Finally, ROC curves of base classifiers and classifier fusion are plotted in Figure 2a and 2b, respectively. for base classifiers, DA indicated the best performance with AUC=0.91, while the best performance was achieved for fused classifier using DT method with AUC of 1.
Discussion
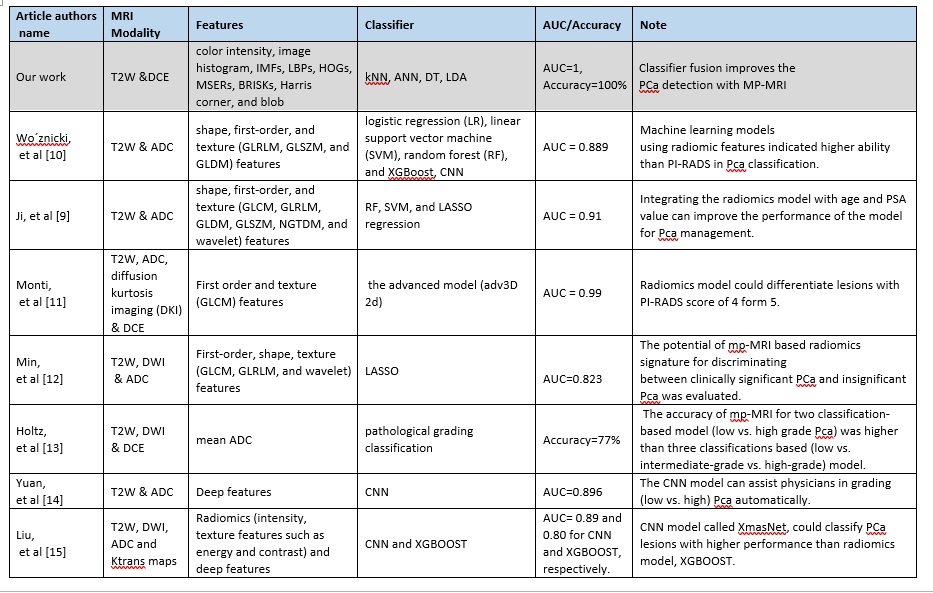
According to what explained, an accurate diagnosis of PCa is important for clinical aspect and the following treatment process. Table 4 shows the summary of our results and previous studies that all the results can be compared with the previous works. Different MRI modalities, feature extractions and classifiers are compared with their accuracy, sensitivities and specificities results as well as AUC results.Eventually with our method, the results show that the accurate PCa diagnosis is achievable by T2-W features images (rather than the DCE), and the Decision template classifier fusion method helps us to classify the lesion with high accuracy.
Conclusion
This study showed that classifier fusion as a machine learning method has a potential to aid PCa diagnosis in MP-MR imaging. The results indicated that T2-W features can diagnose PCa more accurately. In addition, the fused classifier, which is build using the decision template method implies better performance than other fusion methods and individual classifiers. Further studies with more patients are required to achieve better and comprehensive views.Acknowledgements
No acknowledgement found.References
1. Ferlay, J., et al., Estimates of worldwide burden of cancer in 2008: GLOBOCAN 2008. International journal of cancer, 2010. 127(12): p. 2893-2917.
2. Boesen, L., Multiparametric MRI in detection and staging of prostate cancer. Danish medical journal, 2017. 64(2).
3. Engholm, G., et al., NORDCAN–a Nordic tool for cancer information, planning, quality control and research. Acta oncologica, 2010. 49(5): p. 725-736.
4. Thompson, I.M., et al., Prevalence of prostate cancer among men with a prostate-specific antigen level≤ 4.0 ng per milliliter. New England Journal of Medicine, 2004. 350(22): p. 2239-2246.
5. Kumar, V., et al., Multiparametric (mp) MRI of prostate cancer. Progress in nuclear magnetic resonance spectroscopy, 2018. 105: p. 23-40.
6. Djavan, B., et al., Prospective evaluation of prostate cancer detected on biopsies 1, 2, 3 and 4: when should we stop? The Journal of urology, 2001. 166(5): p. 1679-1683.
7. Mansbridge, M., E. Chung, and H. Rhee, The use of MRI and PET imaging studies for prostate cancer management: brief update, clinical recommendations, and technological limitations. Medical Sciences, 2019. 7(8): p. 85.
8. Harmon, S.A., et al., Artificial intelligence at the intersection of pathology and radiology in prostate cancer. Diagnostic and Interventional Radiology, 2019. 25(3): p. 183.
9. Ji, X., et al., Bi-parametric magnetic resonance imaging based radiomics for the identification of benign and malignant prostate lesions: cross-vendor validation. Physical and Engineering Sciences in Medicine, 2021: p. 1-10.
10. Woźnicki, P., et al., Multiparametric MRI for prostate cancer characterization: Combined use of radiomics model with PI-RADS and clinical parameters. Cancers, 2020. 12(7): p. 1767.
11. Monti, S., et al., Multiparametric MRI for prostate cancer detection: New insights into the combined use of a radiomic approach with advanced acquisition protocol. Cancers, 2020. 12(2): p. 390.
12. Min, X., et al., Multi-parametric MRI-based radiomics signature for discriminating between clinically significant and insignificant prostate cancer: Cross-validation of a machine learning method. European journal of radiology, 2019. 115: p. 16-21.
13. Holtz, J.N., et al., New prostate cancer prognostic grade group (PGG): Can multiparametric MRI (mpMRI) accurately separate patients with low-, intermediate-, and high-grade cancer? Abdominal Radiology, 2018. 43(3): p. 702-712.
14. Yuan, Y., et al., Prostate cancer classification with multiparametric MRI transfer learning model. Medical physics, 2019. 46(2): p. 756-765.
15. Liu, S., et al. Prostate cancer diagnosis using deep learning with 3D multiparametric MRI. in Medical imaging 2017: computer-aided diagnosis. 2017. International Society for Optics and Photonics.
Figures