3165
Automatic no-reference image quality rating metrics in DL-reconstructed image quality assessment and protocol optimization1GE Healthcare, Beijing, China
Synopsis
This study proposed an automatic no-reference image quality rating metrics (VSS score) based on SVR model, that not requiring clinical expert labeled data, simulating human visual sense and applicable to all anatomies and contrast. The feasibility of applying this rating metrics in DL-recon integrated rapid scan protocol automatic evaluation is demonstrated. The result shows VSS score is in good correlation with visual sense to image quality and outperformed BRISQUE and PIQUE rating algorithms.
Introduction
With the adoption of deep learning-based MR reconstruction algorithms, it enables a trend to define rapid protocol accordingly by adjusting scan parameters to get good image quality and keep scan time as short as possible.Theoretical model for predicting image quality improvement by DL-based reconstruction is not available, since this improvement is non-linear to DL enhancement level and depends on anatomy and site-specific protocol. Currently, a common practice is scanning clinical images of different acceleration parameters and invite human observer to select the most time-effective accelerated protocol that provide the good image quality. Human observers need to rate the images for each anatomy and protocol, which is time-consuming and subjective to individual’s opinion.
An ideal practice is optimizing DL-based reconstruction scan protocols automatically and objectively, without requiring clinical expert rating image. The state-of-art automatic image quality rating metrics have limitations including not correlated with human visual sense1-2, requiring expert labeling3, and restrict to specific anatomy and contrast4.
This study proposed an automatic no-reference image quality rating metrics, simulating human visual sense, and applying to all anatomies and contrasts MR images, to support the definition of rapid protocols in DL-based reconstruction.
Methods
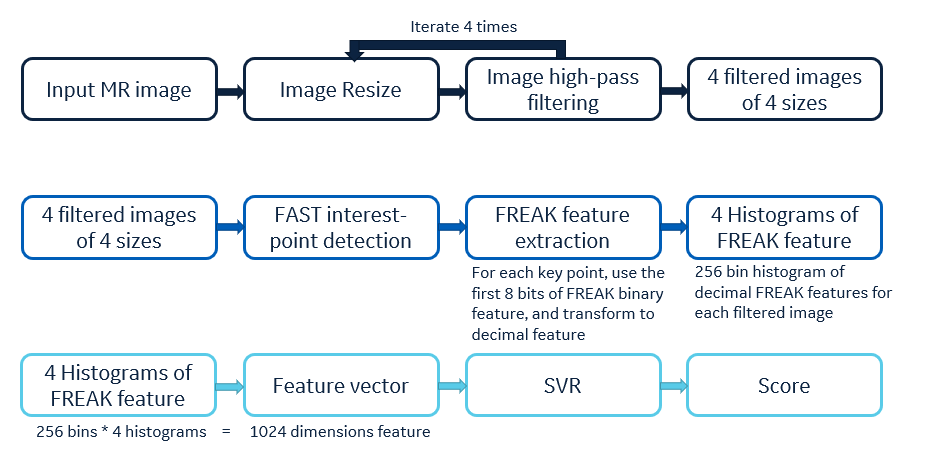
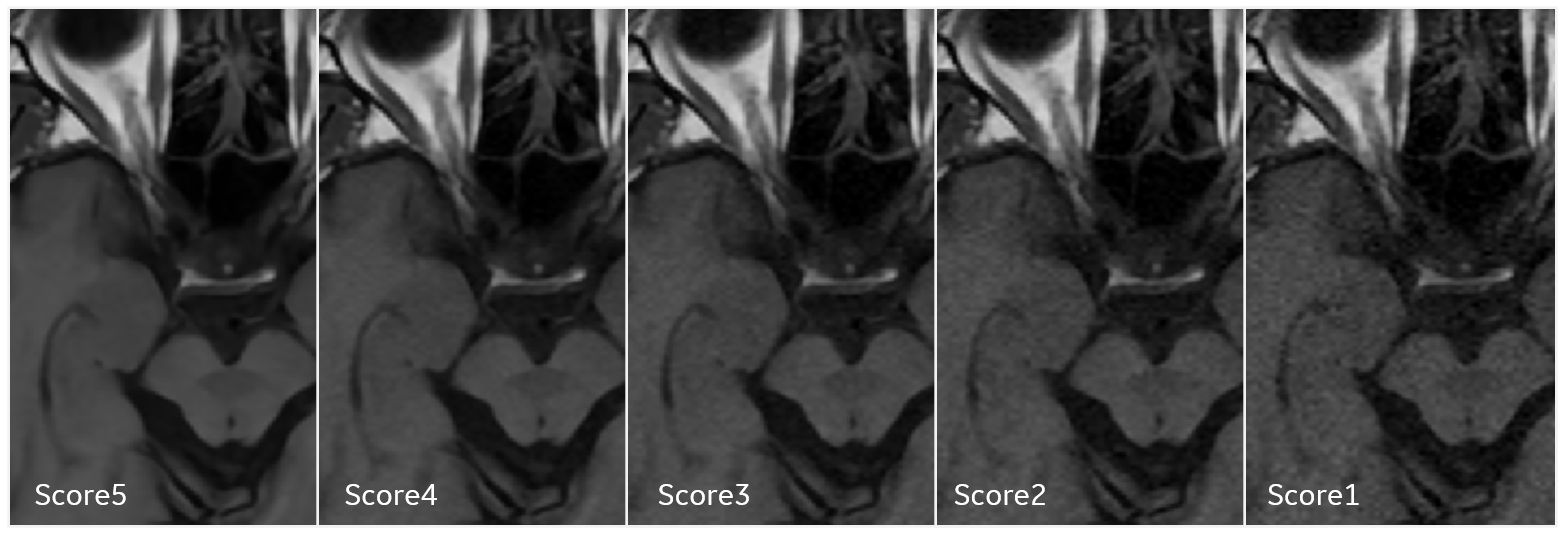
In this study, a Support Vector Regression (SVR) model-based no-reference image quality rating metrics, named as Visual Sense Score (VSS), was developed (Figure 1). The model collects normalized image data and rates image quality as a continuous float score range from 0 to 5, and higher scores indicate better image quality.The SVR metrics model was trained with a dataset of 4075 clinical images, 815 images of each score group (score 1 to score 5). Images were acquired on 1.5T MR scanner (Signa Artist, GE Healthcare) from 9 healthy volunteers (7 male, 2 female), covering all body regions’ routine scan protocols. All acquired data were reconstructed with DL reconstruction (high-level AIR Recon DL) algorithm and used as score 5 group training data. The images used for score 1 to 4 were simulated by adding different noise level on score 5 datasets. (Figure 2)
To validate the VSS metrics in image quality assessment and accelerated protocols selection, the protocol optimization workflow was conducted on 3 different pulse sequences at 3 body regions. Images were acquired on another 1.5T MR scanner (Signa Voyager, GE Healthcare). For single protocol, multiple series of images using varied acceleration method were collected, by adjusting the number of signal averages (NEX), the parallel imaging acceleration factor (Acc), or the receiver bandwidth (rBW). The images were reconstructed with DL-based algorithm.
For each image, the visual sense score (VSS), BRISQUE2, and PIQUE5 metrics were calculated. The image quality metrics of different accelerated protocols were compared on series level by conducting hypothesis test (T test). There are 2 typical types of protocol selection workflows. First, to find the series using the shortest scan time and its metric is not significant lower (P<0.05) than the metrics of longer scan time series. Second, to find the series has the best scores, comparing among similar scan time while different acceleration method protocols.
Results and Discussion
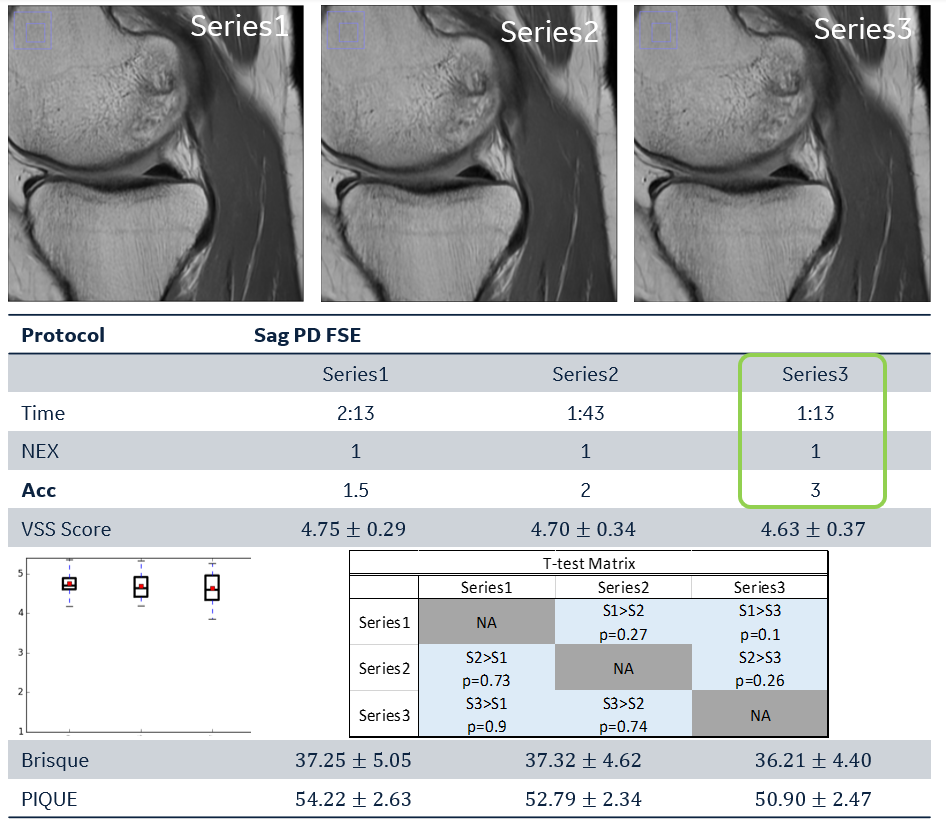
The SVR model was tested on an independent clinical image dataset, consisted with 8 series of images (79 slices), reconstructed with DL-based algorithm as score5 dataset. 4 levels noise are added to generate score 1-4 images. The VSS score has been calculated for each image and analyzed on series level. For each series, the mean VSS of score1 to score 5 shows a monotonically increasing trend. This result indicates the VSS rating has good sensitivity in identifying image quality variance of same anatomy contrast.Figure 3 and Figure 4 illustrates the first type of protocol optimization workflow. The scan time is reduced to half from Series1 to Series3, while the VSS of Series3 shows not significantly lower than Series1. Therefore, the protocols of shortest scan time are selected.
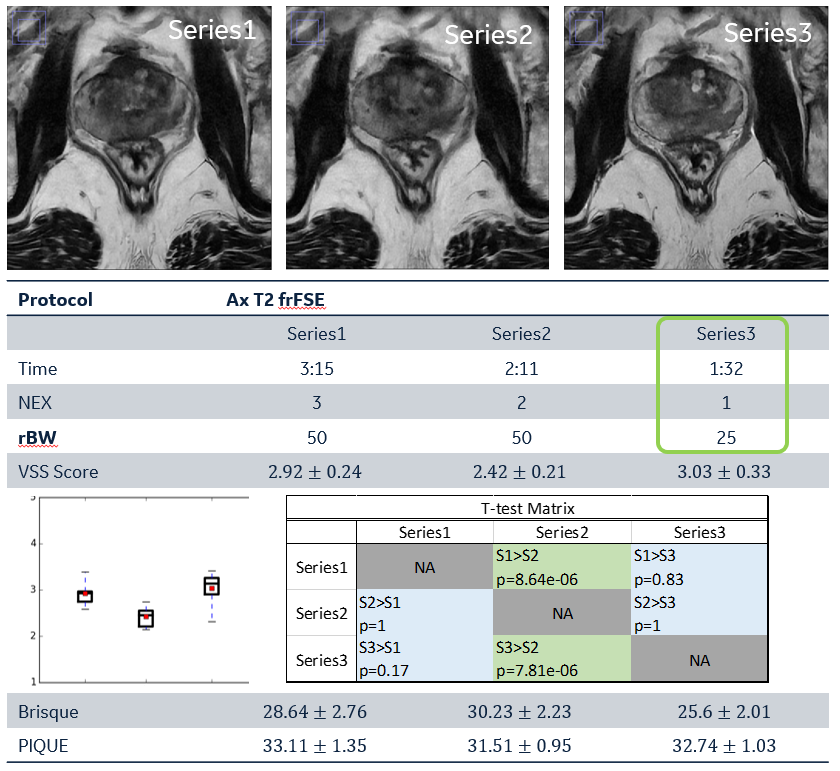
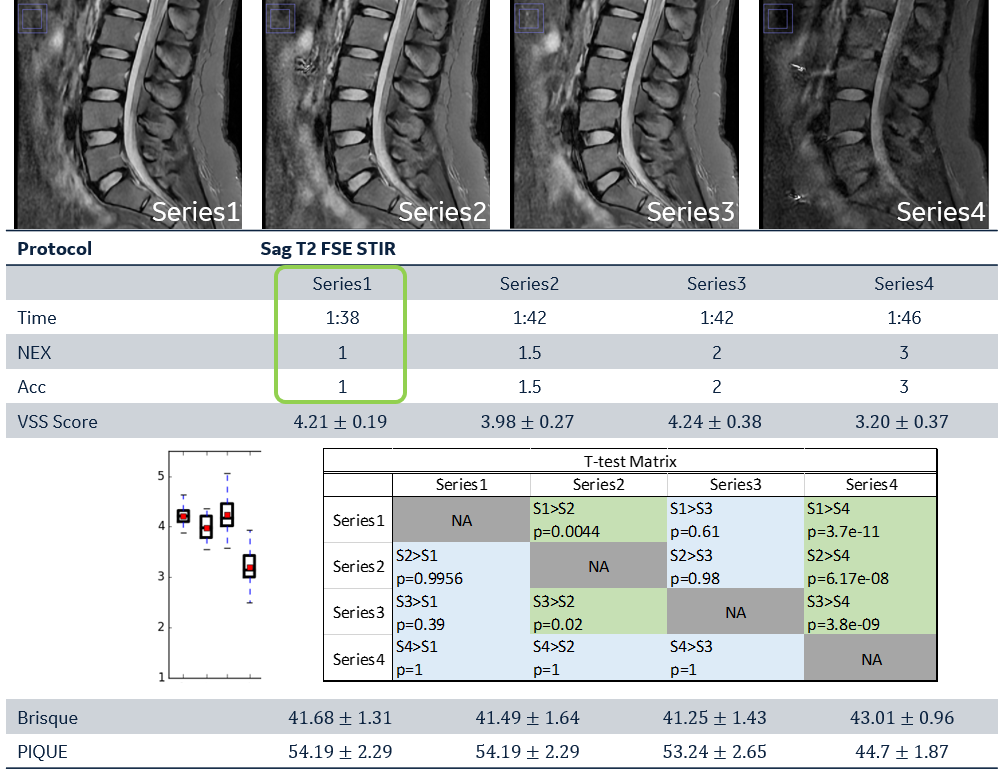
Figure 5 demonstrates second type workflow, that scan parameters adjust around an optimized scan time by changing NEX and Acc. The VSS of 2 protocols significantly outperformed than the others, and the protocol of shorter scan is selected.
Based on the result in Figure 3-5, the 3 metrics (VSS, BRISQUE, PIQUE) have different sensitivity and performance. The scores The VSS result shows good correlation with the image quality examined visually. The BRISQUE score shows the ability to identify obviously bad quality image, while it less sensitive to subtle image quality variance. The PIQUE score is insensitive to the image quality change due to protocol adjustment.
Conclusion
This study proposes an automatic no-reference image quality rating metrics based on a SVR model, the model does not require clinical expert labeled data for training, simulate visual sense and applicable to all anatomies and contrast. The feasibility of applying this rating metrics in DL-recon integrated rapid scan protocol evaluation is demonstrated. The result shows to be in good correlation with visual sense.The Visual Sense Score (VSS) could be further applied in MR scanner performance automatic supervision using daily scanned images and new post-processing algorithm benchmarking. This image quality rating algorithm is promising to alleviate clinical experts’ image rating workload.
Acknowledgements
No acknowledgement found.References
[1] Zhou, W., A. C. Bovik, H. R. Sheikh, and E. P. Simoncelli. Image Qualifty Assessment: From Error Visibility to Structural Similarity. IEEE Transactions on Image Processing. Vol. 13, Issue 4, April 2004, pp. 600–612.
[2] Mittal A, Moorthy AK, Bovik AC. No-reference image quality assessment in the spatial domain. IEEE Transactions on image processing. 2012 Aug 17;21(12):4695-708.
[3] Gatidis S., Liebgott A., Schwartz M., Martirosian P., Schick F., Nikolaou K., et al. Automated reference-free assessment of mr image quality using an active learning approach: comparison of support vector machine versus deep neural network classification. Int’l Soc Mag Reson Med (ISMRM) (2017)
[4] Oszust M, Piórkowski A, Obuchowicz R. No‐reference image quality assessment of magnetic resonance images with high‐boost filtering and local features. Magnetic resonance in medicine. 2020 Sep;84(3):1648-60.
[5] Venkatanath N, Praneeth D, Bh MC, Channappayya SS, Medasani SS. Blind image quality evaluation using perception based features. In2015 Twenty First National Conference on Communications (NCC) 2015 Feb 27 (pp. 1-6). IEEE.
Figures