3164
Robust MR image quality assessment algorithm irrespective of the quality of reference images1Department of Radiological Science, Faculty of Health Sciences, Junshin Gakuen University, Fukuoka, Japan, 2Department of Health Sciences, Graduate School of Medical Sciences, Kyushu University, Fukuoka, Japan, 3Division of Radiology, Department of Medical Technology, Osaka University Hospital, Suita, Japan, 4Department of Health Sciences, Faculty of Medical Sciences, Kyushu University, Fukuoka, Japan
Synopsis
The QEMDIM, a no-reference image quality assessment (IQA) algorithm, calculates the quality scores based on the quality difference between an image and reference images. Therefore, scores can be affected by the quality of the reference images. We modified the QEMDIM by changing the scoring method to compensate for this drawback. Brain MR images of various qualities were scored by subjective IQA (our gold standard), QEMDIM, and the modified algorithm. Modified scores showed a higher correlation with subjective IQA scores than the QEMDIM scores, using reference images of varied qualities. Our modified algorithm would be more clinically advantageous than the QEMDIM.
Introduction
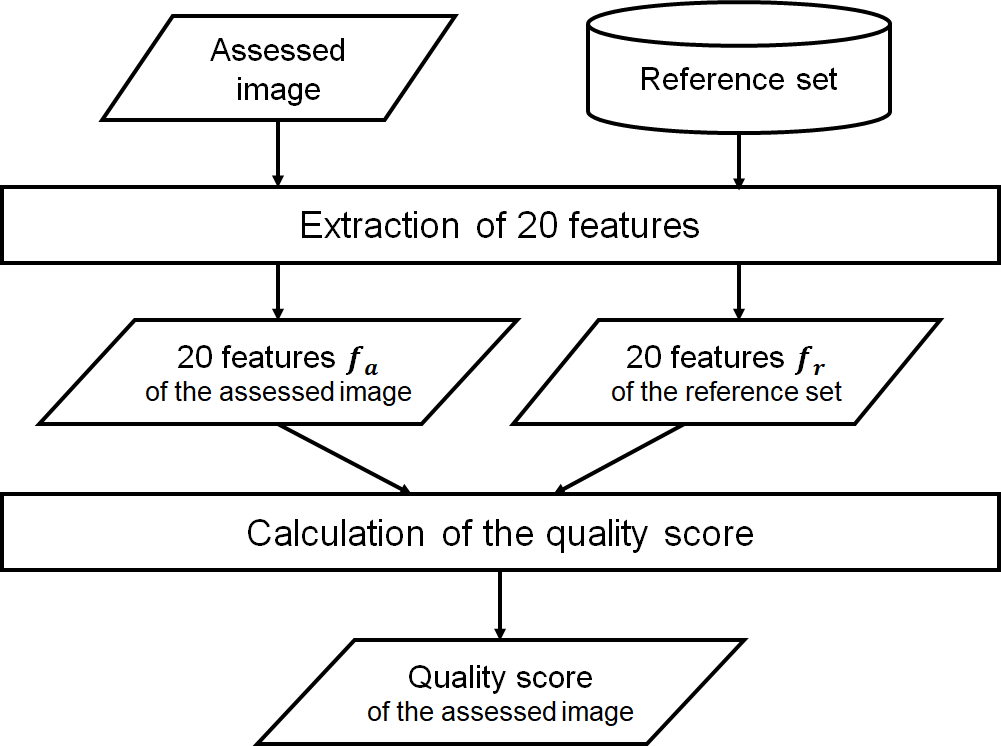
The Quality Evaluation using Multi-Directional Filters for MRI (QEMDIM) has been proposed as a no-reference image quality assessment (IQA) algorithm.1 The algorithm (Fig. 1) requires a pair of input, including an image to be assessed (assessed image) and a set of reference images (reference set). The quality of the reference set may affect the quality scores of the QEMDIM algorithm. This study aimed to investigate the effect of the quality of the reference set on QEMDIM scores. Further, we proposed a modified algorithm to compensate for such a drawback of the QEMDIM algorithm.Theory
The QEMDIM score (SQ) is calculated based on the Euclidean distance between two feature vectors each with 20 elements:$$S_Q=\|\boldsymbol{f_r-f_a}\|\qquad(1)$$where $$$\boldsymbol{f_r}$$$ and $$$\boldsymbol{f_a}$$$ are the column feature vectors of the reference set and assessed image, respectively (Fig. 1). The QEMDIM score is a non-negative number with high values indicating large differences in quality between the assessed image and the reference set.Our proposed algorithm is the same as QEMDIM (Fig. 1), except for the calculation of the quality score. The score in our algorithm (modified score, Smod) can be obtained using the following equation:$$S_{mod}=\frac{\boldsymbol{f_r}\cdot(\boldsymbol{f_r-f_a})}{\|\boldsymbol{f_r}\|}\qquad(2)$$where “$$$\cdot$$$” is the inner product operator. A highly positive (low negative) value of the modified score is expected to indicate that the assessed image has a higher or lower quality than the reference set and a value of zero indicates that the assessed image has the same quality as the reference set.
Methods
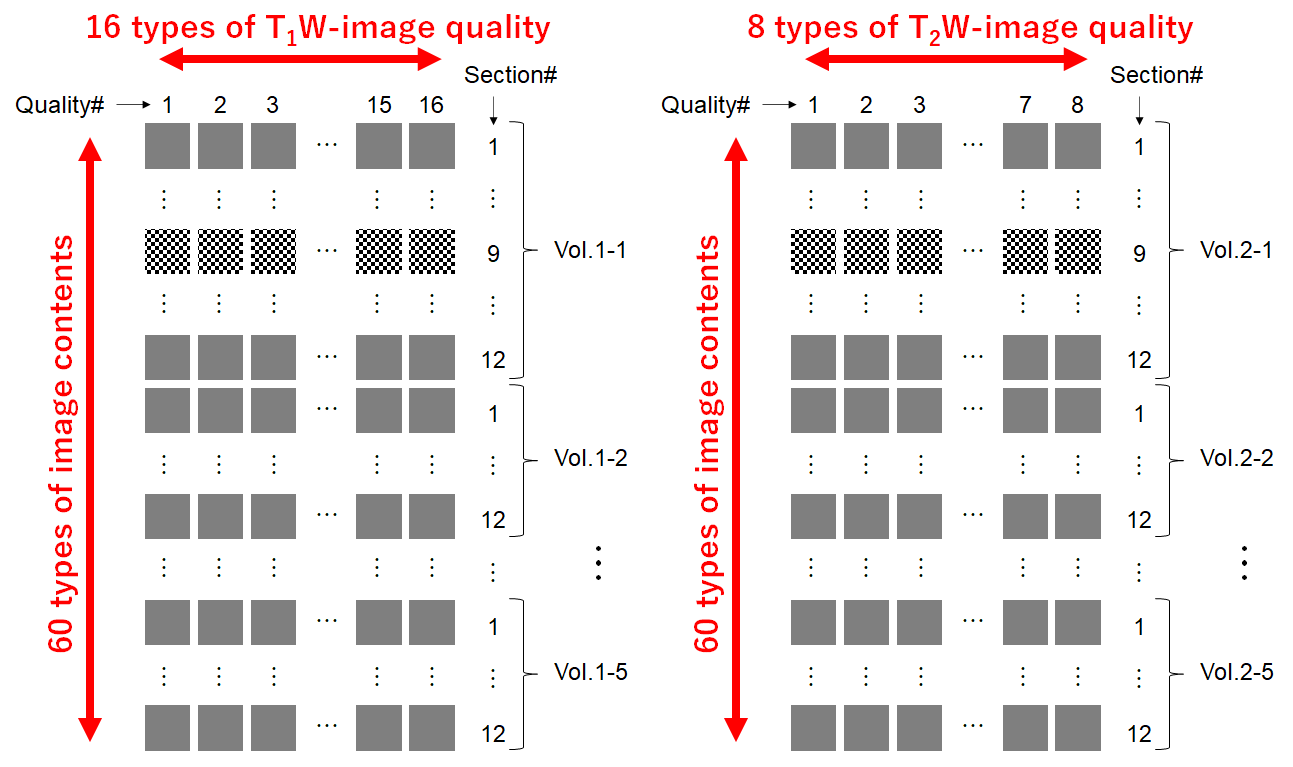
Five T1-weighted (T1W) and five T2-weighted (T2W) spin-echo scan data of brain axial planes were acquired for healthy volunteers using a 3.0-T MR scanner (SIGNA Architect, GE Healthcare) and a 48-channel head coil. The scan parameters that differed between T1W and T2W imaging were the repetition time (TR), echo time (TE), and number of excitations (NEX): TR[ms]/TE[ms]/NEX = 545/12/8 for T1W imaging, and 3500/80/2 for T2W imaging. Other parameters were as follows: Cartesian trajectory, field-of-view = 22 cm, slice thickness = 2 mm, spacing = 2 mm, number of slices = 12, and acquisition matrix = 256×256. Each of the acquired scan data was used to reconstruct 16 T1W and 8 T2W image series with various image qualities (four levels of NEX × 4 levels of the number of phase-encoding steps (Ny) for T1W images and 2 NEX’s × 4 Ny’s for T2W images). A total of 960 T1W and 480 T2W images were obtained (Fig. 2).Sixteen T1W and eight T2W images, of different qualities though showing the same contents (Fig. 2), were used as samples in our observation experiment. The observation consisted of the T1W and T2W sessions, and ten radiological technologists participated in each session. Two images were simultaneously displayed on a monitor, and the observers were asked to evaluate the relative and comprehensive image quality on a 3-point scale (left one is better, they are similar, or right one is better). The 3-point-scale evaluations were repeated for 240 image pairs ($$${}_{16}\mathrm{P}_2$$$) in the T1W session and 56 image pairs ($$${}_{8}\mathrm{P}_2$$$) in the T2W session. The paired comparison (Schéffe method 2) was used to calculate the average degree of preference (subjective score, Ssubj) for each image. Ssubj can range between $$$[-1, 1]$$$ and indicates a high value when the image has high quality.
We prepared 16 T1W and 8 T2W reference sets, each consisting of all the reconstructed images with consistent quality (NEX and Ny) (Fig. 2). SQ and Smod were computed for all T1W or T2W pairs of a reconstructed image and a reference set.
The reconstructed images were divided into the 60 image-content subsets, each consisting of 16 T1W and 8 T2W images with different qualities and the same contents (Fig. 2). Under the assumption that the variation in the quality (Ssubj) among images belonging to each image-content subset is the same, the Pearson linear correlation coefficients between Ssubjs and SQs (CCQ,subj) and between Ssubjs and Smods (CCmod,subj) were calculated for each image-content subset. The Kruskal-Wallis test was used to analyze the effect of the quality of the reference set on CCQ,subj and CCmod,subj.
Results
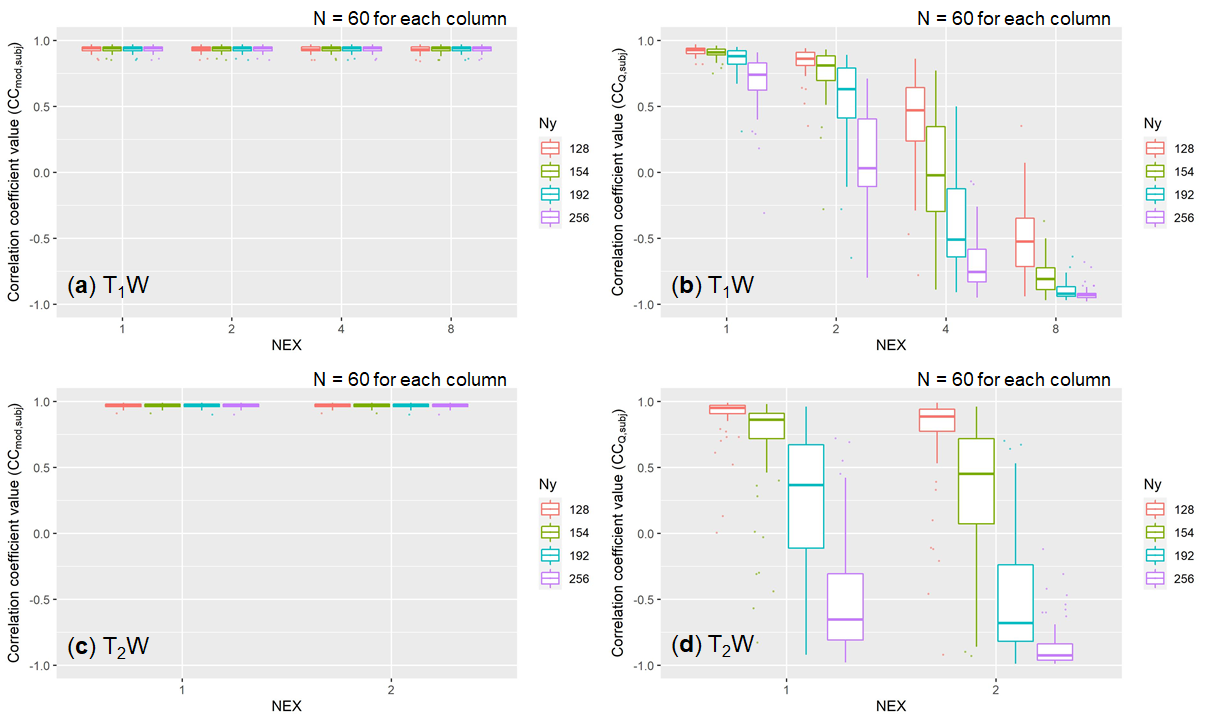
The distribution of CCQ,subj varied significantly with the quality of the reference set (Fig. 3b and d). There was no significant variation in the CCmod,subj distributions (Fig. 3a and c). The CCmod,subj showed consistently high positive values (mean ± SD: 0.93 ± 0.023 for T1W images; and 0.97 ± 0.016 for T2W images) irrespective of the quality of reference set.Discussion and Conclusion
Subjective image quality is the gold standard in clinical practice. Smod showed a high correlation with Ssubj, irrespective of the quality of the reference set, while SQ did not. Therefore, the QEMDIM algorithm might not be able to accurately evaluate the MR image as it may be influenced by the quality of the reference set. Our modified IQA algorithm could be more useful and robust in clinical practice than the QEMDIM algorithm and has the potential to be an alternative to subjective IQA.Acknowledgements
The authors thank the radiological technologists at Osaka University Hospital and Junshin Gakuen University for participating in our observation experiment and volunteers for participating in our scanning experiment. This work was supported by JSPS KAKENHI (Grant Number JP19K17249).
References
1. Jang J, Bang K, Jang H, et al. Quality Evaluation of No-Reference MR Images Using Multidirectional Filters and Image Statistics. Magn Reson Med. 2018;80(3):914–924.
2. Nagasawa S. Improvement of the Schéffe’s method for paired comparisons. Kansei Eng Int. 2002;3(3):47–56.
Figures