3163
Correlations between functional connectivity and glucose uptake in white matter1Image Processing Center, School of Astronautics, Beihang University, Beijing, China, 2Vanderbilt University Institute of Imaging Science, Nashville, TN, United States, 3Department of Radiology and Radiological Sciences, Vanderbilt University Medical Center, Nashville, TN, United States, 4Department of Electrical Engineering and Computer Science, Vanderbilt University, Nashville, TN, United States, 5Department of Biomedical Engineering, Vanderbilt University, Nashville, TN, United States
Synopsis
Blood oxygenation-level dependent (BOLD) MRI signals have been reliably detected in white matter (WM) in both task and resting states in numerous studies. However, the relationship between WM BOLD signals and regional metabolism remains to be elucidated. In the present study, we investigated the relationship between resting state functional connectivity and glucose uptake in WM using simultaneous MRI and PET studies of human subjects. We find a significant correlation between these two measurements, suggesting that functional involvement of WM in neural activities was accompanied by an increase in glucose metabolism.
Purpose
Over the past several years a large number of studies have reported resting state functional connectivity within gray matter (GM) based on the correlations of spontaneous low frequency fluctuations in blood oxygenation-level dependent (BOLD) signals [1]. Recently [2][3] similar BOLD signals and correlations have been detected in WM. The underlying biophysical processes that may explain the origins of BOLD effects in WM remain unclear. In GM the neurovascular coupling incorporates interactions between blood flow, oxygen use and metabolism, while baseline metabolism is dominated by uptake of glucose. The purpose of this study was to explore the potential relationships between functional connectivity and BOLD effects in WM with respect to regional glucose uptake in WM.Methods
Participants and ImagingA publicly available dataset, consisting of 25 right-handed healthy human adults (aged 18-23 yrs, 18 F and 7 M), was analyzed. Each participant underwent a 95-min simultaneous MRI-PET scan in a supine position in a Siemens (Erlangen) 3T Biograph molecular MR scanner (Syngo VB20 P). Infusions of [18F] fluorodeoxyglucose (36 mL/hr) were synchronized with the start of PET acquisitions. In an initial 30 minutes, while the PET signal rose to a detectable level, only non-functional MRI scans were acquired, including 3D T1 weighted anatomic images. This procedure was followed by six 10-min intervals of simultaneous continuous acquisitions of PET and resting-state fMRI, as described by Jamadar et al. [4].
Anatomical Atlases
For WM, images were analyzed by coregistration with the JHU-ICBM WM atlas wherein 48 WM bundles were defined. For GM, a conventional atlas that defined 82 Brodmann areas (BAs) was used to define regional parcellations.
Preprocessing of fMRI data
We followed pipeline [5] for fMRI preprocessing. First, fMRI images underwent slice timing and head motion correction. Second, T1 weighted images were segmented using SPM to acquire masks of GM, WM, and cerebrospinal fluid (CSF). These masks, along with the anatomical atlases, were registered into the individual space of each participant. Third, the average signal from CSF was regressed out as a nuisance covariate from each fMRI time series. Fourth, the fMRI images and T1-weighted masks were normalized into the Montreal Neurological Institute (MNI) space. Fifth, linear trends from the BOLD images were removed to correct for signal drift. Finally, each BOLD image time series was temporally band-pass (0.01~0.1Hz) filtered.
Preprocessing of PET data
The dynamic PET images consisted of 225 volumes, each of which was a binning of counts acquired in 16 seconds. Motions were corrected using the realign module in SPM, wherein the first volume was regarded as a reference. Each of the realigned images was then coregistered to the T1 weighted image of the same individual. Summing over these coregistered volumes produced an average PET image, from which fluorodeoxyglucose (FDG) uptakes were extracted.
Functional connectivity matrix analysis of white and gray matter
Functional connectivity (FC) analyses were performed by correlating the preprocessed time series of 48 WM bundles and 82 BAs, yielding a FC matrix of size 48*82. For each WM bundle, its average FC value was computed with respect to the 82 BAs. The vector, consisting of the 48 average FC values from the WM bundles, was termed bFC (bundle-wise average FC values), and was regarded as a metric of the functional engagement of all the WM bundles in each individual.
Metabolic indications of white matter
For each WM bundle in individual space, we computed the average uptake of FDG in the average PET image. The vector, consisting of the 48 average uptake values of FDG, was termed bFDG (bundle-wise average FDG uptake), and regarded as the metabolic indication of a WM bundle in each individual.
Pooled correlation analysis
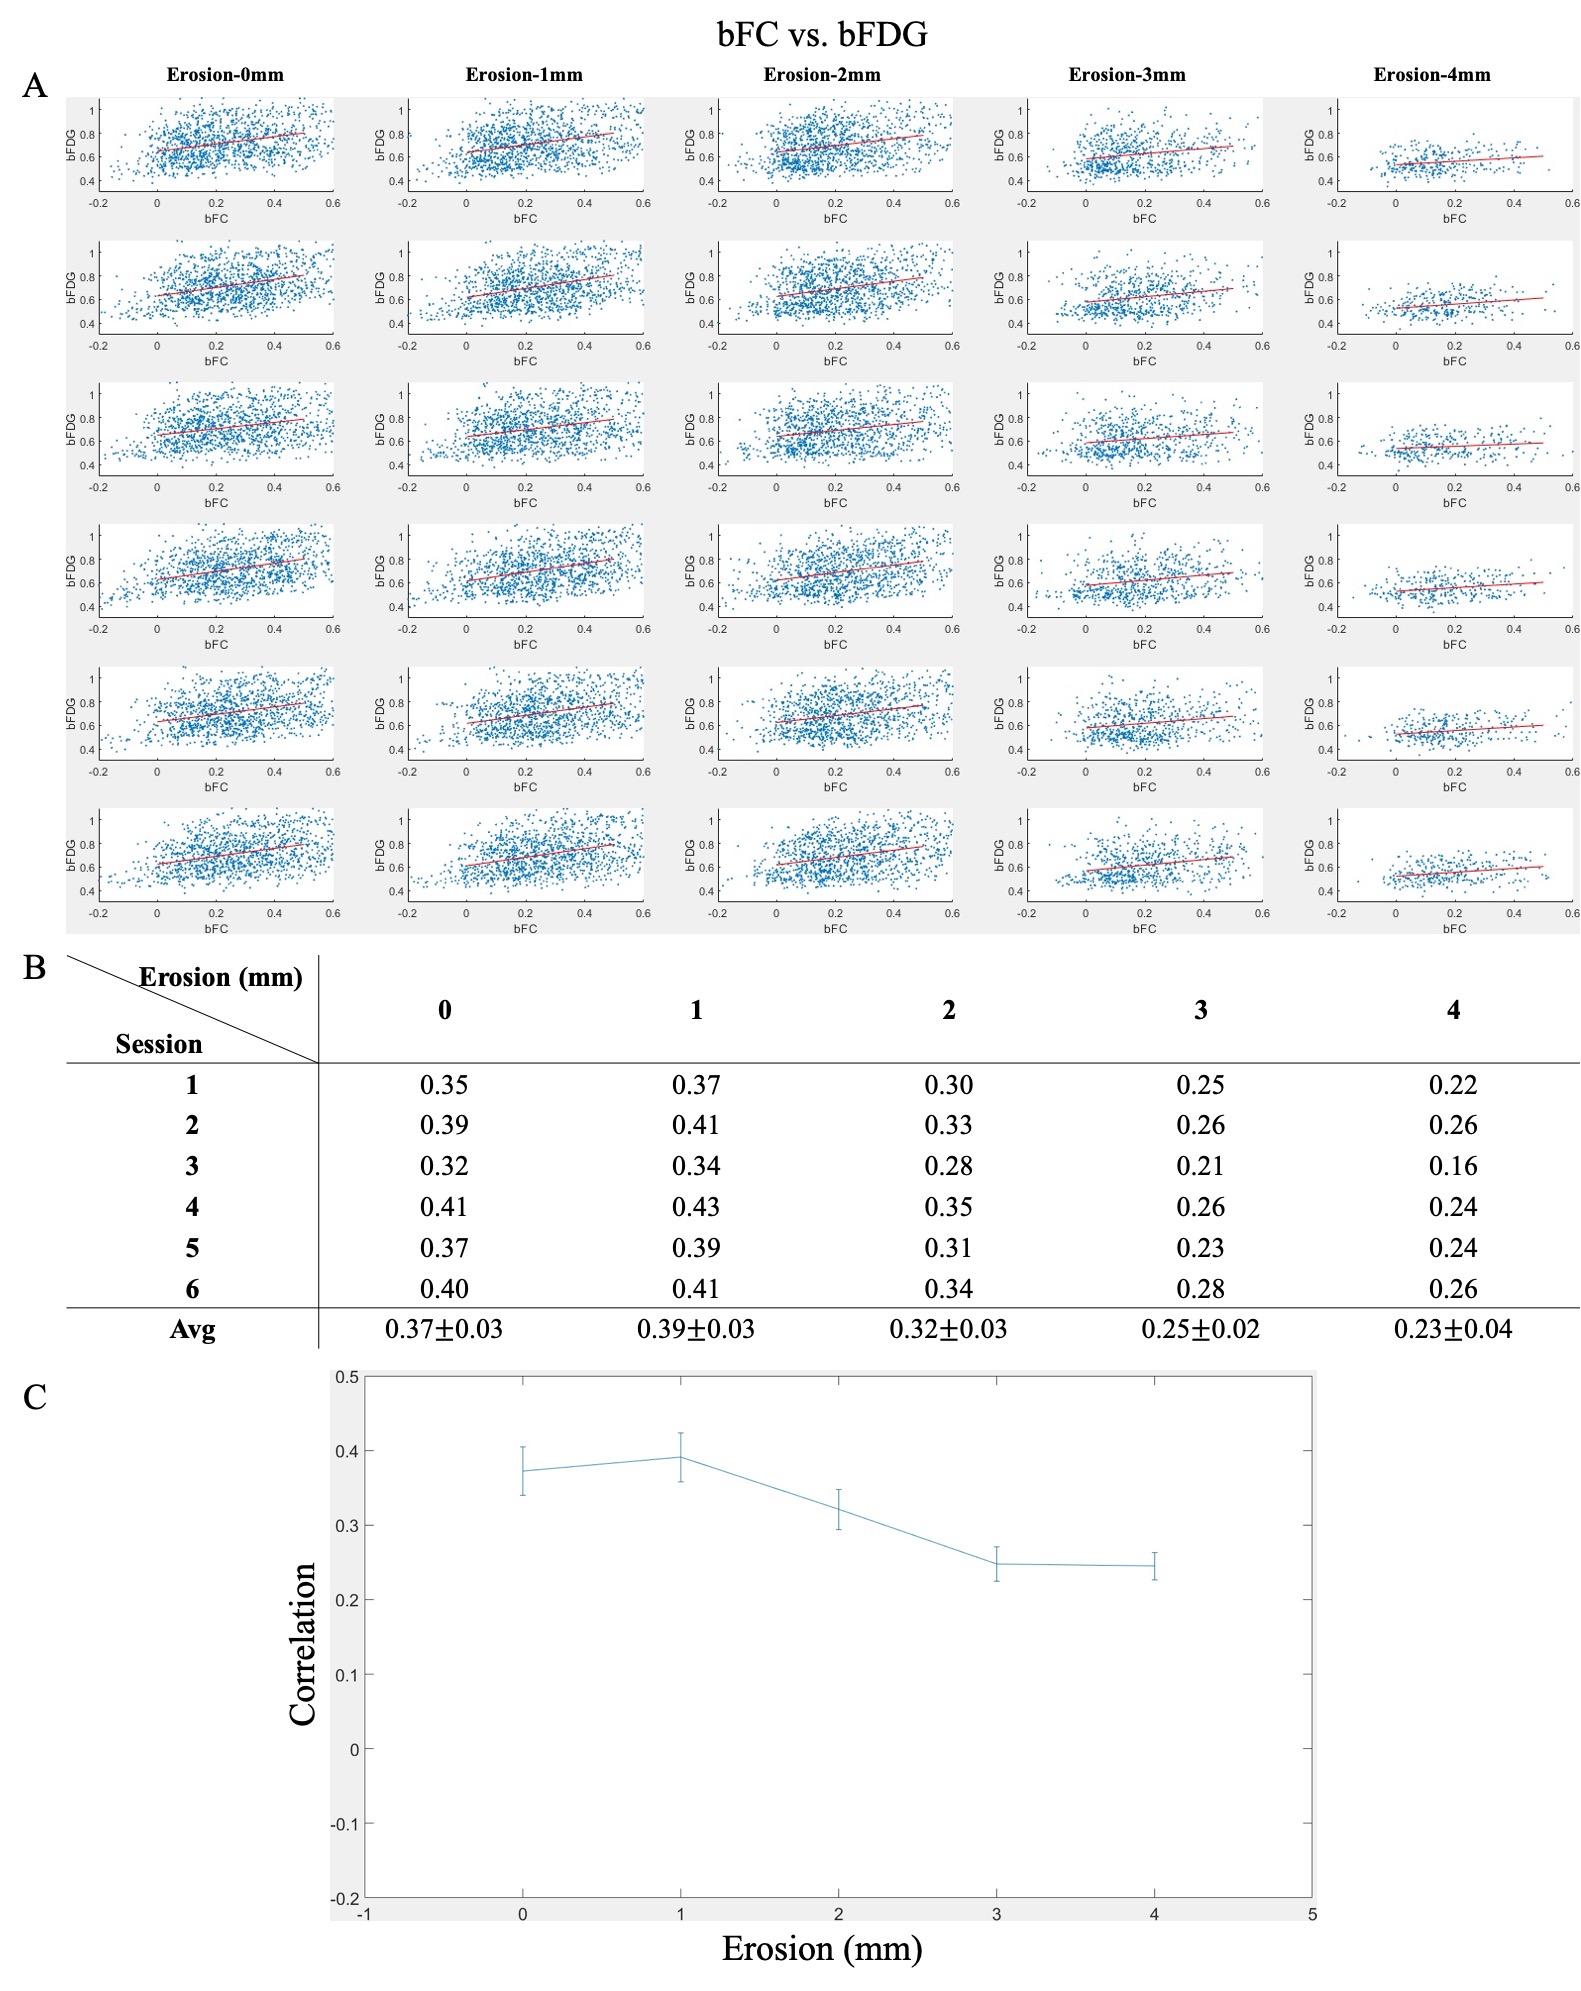
A global Pearson’s correlation coefficient was calculated for the linear regression wherein each element in bFC and the corresponding element in bFDG were compared across all the bundles and all the subjects together (maximum 48 bundles x 25 subjects =1200 data points for each session) for each of 6 sessions.
Influence of partial volume effect
To evaluate the influence of partial volume effects, the WM masks were first eroded in steps of 2 for 1~4 mm before bFDG values were computed. The correlation analysis described above was repeated for each of the four levels of erosions.
Results
Scatter plots of pooled bFC and bFDG are shown in Figure 1A. Rows and columns indicate measurements from different sessions and levels of erosions respectively. Larger values of erosions yield fewer available bundles, leading to fewer points in the scatter plots. As shown in Figure 1B, bFC was significantly correlated with local bFDG uptake (r=0.37±0.03, at the erosion level of 0 mm, p<0.001 was observed for all the entries in Figure 1B). As displayed in Figure 1C, the varying correlation level with the changed level of erosion suffered a dip within the erosion levels from 1~3 mm and further exhibited tendency to be stable between the erosion levels of 3mm and 4mm, suggesting small influence (if any) of residual partial volume.Conclusion
This study reveals a correlation between functional and metabolic measurements in WM, which suggests functional involvement of WM in neural activities was accompanied by an increased demand for metabolic energy.Acknowledgements
No acknowledgement found.References
[1] Biswal, B., Zerrin Yetkin, F., Haughton, V. M., & Hyde, J. S. Functional connectivity in the motor cortex of resting human brain using echo-planar MRI. Magnetic Resonance in Medicine. 1995, 34(4), 537-541
[2] Gore J C, Li M, Gao Y, et al. Functional MRI and resting state connectivity in white matter-a mini-review. Magnetic resonance imaging. 2019, 63, 1-11.
[3] Gawryluk, J. R., Mazerolle, E. L., D'Arcy, R. C. Does functional MRI detect activation in white matter? A review of emerging evidence, issues, and future directions. Frontiers in neuroscience. 2014, 8, 239.
[4] Jamadar S D, Ward P G D, Close T G, et al. Simultaneous BOLD-fMRI and constant infusion FDG-PET data of the resting human brain. Scientific Data. 2020, 7, 363.
[5] Ding, Z., Huang, Y., Bailey, S. K., et al. Detection of synchronous brain activity in white matter tracts at rest and under functional loading. Proceedings of the National Academy of Sciences. 2018, 115(3): 595-600
Figures