3152
Amide proton transfer and diffusion kurtosis imaging technology in differentiation stage Ia endometrial carcinoma and endometrial polyp1the First Affiliated Hospital of Dalian Medical University, Dalian, China, 2Dalian Medical Imaging artificial intelligence engineering technology research center, Dalian, China, 3Philips Healthcare, Beijing, China
Synopsis
Endometrial polyps (EP) is a common disease of uterine body, with a prevalence rate of about 8~25% in female population. Its clinical symptoms can be like those of endometrial carcinoma (EC), with vaginal bleeding, but there are obvious differences in prognosis and treatment between them. The purpose of this study is to investigate the value of differential diagnosis for staging Ia EC and EP by using amide proton transfer (APT) and diffusion kurtosis imaging (DKI). It shows that APT and DKI can be used to distinguish between stage Ia EC and EP. effectively and quantitatively
INTRODUCTION
Endometrial polyps (EP) is a common disease of uterine body, with a prevalence rate of about 8~25% in female population. Its clinical symptoms can be like those of endometrial carcinoma (EC), with vaginal bleeding1-2. Although pathological biopsy is the gold standard of preoperative diagnosis in EC and EP at present, it is invasive and not suitable for patients with cervical or vaginal stenosis, and the limited amount of tissue samples often affects the accurate qualitative analysis3. Amide proton transfer (APT) imaging is a molecular level MR functional imaging technology, which is essentially a derivative technology of chemical exchange saturation transfer imaging. APT values can quantitatively reflect the information of mobile proteins and polypeptides in living tissues4. Diffusion kurtosis imaging (DKI) quantifies the deviation of water molecules due to non-Gaussian distribution diffusion with multiple parameters, and has the advantage of more accurately reflecting the changes of microenvironment in tissues5-6. Both are non-enhanced MR biomarker, which can avoid the potential side effects of contrast agent (such as renal systemic fibrosis). The purpose of this study was to explore the performance of APT and DKI in diagnosis of differential diagnosis for staging Ia EC and EP.METHODS
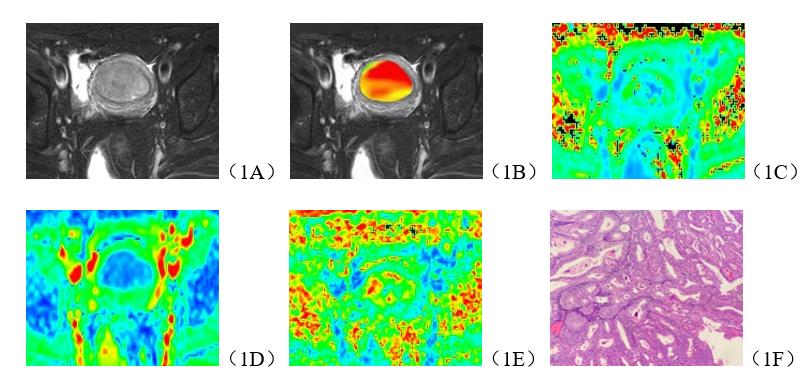
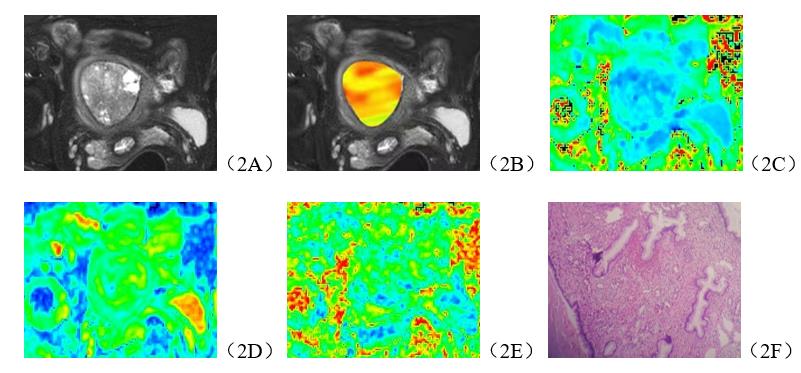
32 patients with stage Ia EC and 17 patients with EP confirmed by operation and pathology were retrospectively analyzed. All patients underwent APT and DKI scans on a 3.0T MR scanner before surgery. The APT, mean kurtosis (MK), mean diffusivity (MD) and fractional anisotropy (FA) maps of APT and DKI sequences were obtained by post-processing. The APT, MK, MD and FA values of both two groups were measured by two observers. The intra-class correlation coefficients (ICC) was used to test the measurement consistency between the two observers. The independent-samples t-test or Mann-Whitney U test were performed to analyze the differences of each parameter values between the two groups. Receiver operator characteristic (ROC) curves were used to evaluate the differential diagnosis efficiency.Results
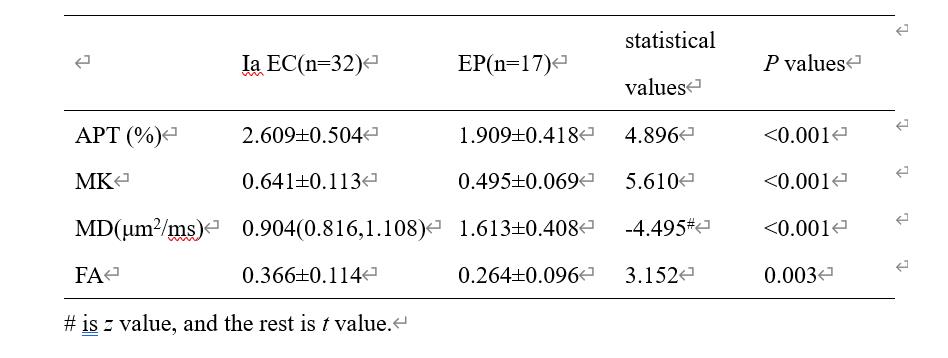
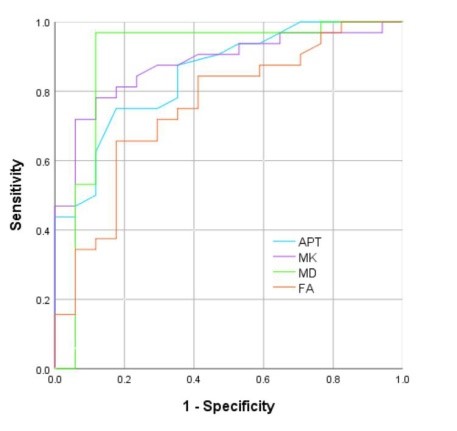
The consistency of data measured by the two observers were good (ICC>0.75). The APT, MK, FA values of stage Ia EC group were significantly higher than those in EP group, and the MD value was lower than EP group (P<0.05). (Table 1, Figure 1, Figure 2). The area under curve (AUC) of APT, MK, MD and FA values in distinguishing stage Ia EC and EP were 0.850, 0.879, 0.893 and 0.755, respectively (Figure 3).DISCUSSION AND CONCLUSIONS
The results show that the APT value of Ia EC is higher than that of EP. Analyzing the reasons, the APT value increases with the increase of mobile protein and polypeptide content in tumor tissue7. Because EC is a malignant tumor, the cell proliferation is vigorous, the metabolism is active, and a relatively large amount of protein, polypeptide and other substances are produced, which leads to the increase of APT value. In addition, EC has more neovascularization than EP8, and the immature capillary network generated by the increase of microvessel density in tumor and the consequent increase of blood perfusion may also be the reason for the increase of APT value [9]. In addition, the fiber component in tumor tissue may be a factor that causes the APT value to decrease [10], and the EP tissue component contains dense fibers [11], so the APT value decreases.MK, MD and FA in DKI sequence can quantify the deviation of water molecules caused by non-Gaussian distribution diffusion[12,13,14], EC tumor cells proliferate actively, tumors grow vigorously and new blood vessels are abundant. These factors all increase the diffusion of water molecules, and the complexity of microenvironment. These factors increase the complexity of water molecules diffusion microenvironment, leading to the different diffusion of water molecules between EC and EP.APT and DKI technology can effectively and quantitatively distinguish between stage Ia EC and EP.Acknowledgements
No acknowledgement.References
[1] Perri T, Rahimi K, Ramanakumar AV, et al. Are endometrial polyps true cancer precursors? Am J Obstet Gynecol, 2010, 203(3):232.e1-232.e6.
[2] Shor S, Pansky M, Maymon R, et al. Prediction of Premalignant and Malignant Endometrial Polyps by Clinical and Hysteroscopic Features. J Minim Invasive Gynecol, 2019, 26(7):1311-1315.
[3] Zhu Y, Liu Z, Du M, et al. Macrophages in patients with recurrent endometrial polyps could exacerbate Th17 responses. Clin Exp Pharmacol Physiol, 2018, 45(11):1128-1134.
[4] Kamimura K, Nakajo M, Yoneyama T, et al. Amide proton transfer imaging of tumors: theory, clinical applications, pitfalls, and future directions. Jpn J Radiol, 2019, 37(2):109-116.
[5] Goryawala MZ, Heros DO, Komotar RJ, et al. Value of diffusion kurtosis imaging in assessing low-grade gliomas. J Magn Reson Imaging, 2018, 48(6):1551-1558.
[6] Li Z, Li X, Peng C, et al. The Diagnostic Performance of Diffusion Kurtosis Imaging in the Characterization of Breast Tumors: A Meta-Analysis. Front Oncol, 2020, 10:575272.
[7] Meng N, Wang X, Sun J, et al. Application of the amide proton transfer-weighted imaging and diffusion kurtosis imaging in the study of cervical cancer. Eur Radiol, 2020, 30(10):5758-5767.
[8] Giordano G, Gnetti L, Merisio C, et al. To evaluate immunoreactivity of cyclooxygenase-2 in cases of endometrial carcinoma and correlate it with expression of p53 and vascular endothelial growth factor. J Cancer Res Ther, 2018, 14(6):1366-1372.
[9] Li B, Sun H, Zhang S, et al. Amide proton transfer imaging to evaluate the grading of squamous cell carcinoma of the cervix: A comparative study using 18 F FDG PET. J Magn Reson Imaging, 2019, 50(1):261-268.
[10] Li B, Sun H, Zhang S, et al. The utility of APT and IVIM in the diagnosis and differentiation of squamous cell carcinoma of the cervix: A pilot study. Magn Reson Imaging, 2019, 63:105-113.
[11] Hase S, Mitsumori A, Inai R, et al. Endometrial polyps: MR imaging features. Acta Med Okayama, 2012, 66(6):475-485.
[12] Thaler C, Kyselyova AA, Faizy TD, et al. Heterogeneity of multiple sclerosis lesions in fast diffusional kurtosis imaging[J]. PLoS One, 2021, 16(2):e0245844.
[13] Granata V, Fusco R, Risi C, et al. Diffusion-Weighted MRI and Diffusion Kurtosis Imaging to Detect RAS Mutation in Colorectal Liver Metastasis[J]. Cancers (Basel), 2020, 12(9):2420.
[14] Di Trani MG, Nezzo M, Caporale AS, et al. Performance of Diffusion Kurtosis Imaging Versus Diffusion Tensor Imaging in Discriminating Between Benign Tissue, Low and High Gleason Grade Prostate Cancer[J]. Acad Radiol, 2019, 26(10):1328-1337.
Figures