3151
Multi-Parametric MRI in Diagnosing Ovarian Endometrioma: a Feasibility Study
Fang Wang1, Dawei Ding2, Weiqiang Dou3, Dmytro Pylypenko3, Qing Wang1, and Dexin Yu1
1Department of Radiology, Qilu Hospital of Shandong University, Jinan, China, 2Department of Radiology, Qilu Hospital, Cheeloo College of Medicine, Shandong University, Jinan, China, 3GE Healthcare, Beijing, China
1Department of Radiology, Qilu Hospital of Shandong University, Jinan, China, 2Department of Radiology, Qilu Hospital, Cheeloo College of Medicine, Shandong University, Jinan, China, 3GE Healthcare, Beijing, China
Synopsis
This study aims to investigate the feasibility of multi-parametric MRI in distinguishing endometrioma from other ovarian cystic lesions. A total of 50 patients with clinically suspected endometriosis were recruited in the study. Quantitative MRI, including T1, T2 mapping, T2* mapping and CEST, was used. A positive correlation was found between R2* and iron levels in fluid of endometrioma. The AUC of R2*, T1, T2 and MTR_asym were 0.941, 0.996, 0.980 and 0.806, respectively. Therefore, multi-parametric quantitative MRI can be considered an effective method in differentiating endometriomas from various ovarian cystic lesions.
Introduction
Ovarian endometrioma is the most common form of endometriosis which is a common gynecological disease of women at reproductive age[1]. The cyst fluid of ovarian endometrioma contains non-resorbed blood derived from repeated hemorrhages, and the included iron content can affect the surrounding healthy tissues resulting in carcinogenesis and infertility[2]. Therefore, early detection of ovarian endometrioma is crucial to improve prognosis and preserve fertility.Multi-parametric MRI has been extensively applied in clinical practice to diagnose tumors from different dimensions. Quantitative MRI, including T1 and T2 mapping, have been used for body imaging, and T2* mapping was proposed to measure iron content quantitatively in the liver[3]. Meanwhile, chemical exchange saturation transfer (CEST), like amide proton transfer weighted (APTw) imaging has been extensively applied to tumor differentiation and grading by quantitatively assessing exchange between amide protons and bulk water[4]. With these advantages, we assumed that combined quantitative MRI and APTw imaging might have the potential to diagnose ovarian endometrioma effectively.
Therefore, this study aimed to investigate the feasibility of multi-parametric MRI in distinguishing endometrioma from various ovarian cystic lesions by measuring relaxation properties, iron content, and CEST effect.
Materials and Methods
SubjectsA total of 50 patients (mean age 34 years ranging from 19-50 years) with clinically suspected endometriosis were recruited in the study. According to the postoperative pathological results, the lesions were divided into group A (endometriomas, n=37), and group B (non-endometriotic ovarian cysts, n=23). The fluid in the cystic cavity of endometrioma was collected during operation, and the corresponding fluid iron content was determined by inductively coupled plasma mass spectrometry.
MRI Imaging
A 3.0-T MR scanner (GE Medical Systems, DISCOVERY MR750W) with a 16-channel phased-array body coil was used for all subjects. 3D fast-spoiled-gradient-echo sequence with 4 flips angles of 3,6,9,12 was applied for T1 mapping measurement. Other scan parameters were presented in Table 1.
Data analysis
All MRI data were post-processed using vendor-provided software on GE ADW4.7 workstation. The corresponding T1, T2, and T2* mapping, as well as MTRasym at 3.5ppm for APTw imaging, were obtained accordingly for each patient. Two radiologists were employed to manually draw three regions of interest (ROI)s with the size of 100 mm2 in the center of cyst cavity at the level of maximal cyst cavity area based on T1WI or T2WI images and then copied on R2*, T1, T2, and APTw image. The mean level of each metric was obtained for further analysis.
Statistical analysis
SPSS 25.0 statistic software was used. Intra-class correlation coefficients analysis was applied to assess the inter-observer agreement of parameter measurement over two radiologists. Correlation analysis between iron content of cyst cavity and R2* was performed with Pearson correlation in group A. R2*, T1, T2, and MTRasym were compared with independent sample t-test between group A and group B. Receiver operating characteristic curve (ROC) with the area under the curve (AUC) was used to evaluate the diagnostic efficacy of each quantitative parameters in endometrioma diagnosis. Logistic regression was further applied to predict the efficacy of combined quantitative parameters of R2*, T1, T2, and MTRasym in the diagnosis of endometrioma. P<0.05 was considered statistically significant.
Results
Excellent inter-observer agreement of each parameter measurement was confirmed by high ICC (with r>0.97 for each parameter). A positive correlation was found between R2* and iron levels in the fluid of endometrioma (r=0.419, P<0.05) (Figure 1).R2* in group A showed a significantly higher value than in group B (A: 38.6±29.07Hz, B: 11.2±10.9Hz; P<0.001). T1, T2 and MTR_asym in group A showed significantly lower value than in group B (T1: 126.7±71.3ms vs 1271.6±652.5ms, P<0.001; T2: 93.6±36.8ms vs 324.9±219.1ms, P =0.002;MTR_asym: 1.92% vs 3.86% ; P=0.029) (Figure 2).
Using ROC analysis, the AUC of R2*, T1, T2, and MTR_asym were 0.941, 0.996, 0.980, and 0.806, respectively (P<0.01) (Figure 3). The corresponding diagnostic cut-off, sensitivity and specificity of R2* were 14.83Hz, 94.5%, 92.6%; for T1 were 511.63ms, 100%, 94.1%; for T2 were 133.58ms, 83.7%%, 100%; for MTR_asym were 1.832%, 79.4%, 80%, respectively. The AUC of the combined R2*, T1, T2 and MTR_asym was 1.0. Figure 4 shows multi-parametric MRI of EMS and NEOS, including T1WI(a,g), T2WI(b,h), fusion of T2WI and T1 map(c,I), fusion of T2WI and T2 map(d,j), fusion of T2WI and R2* map(e,k) and APTw(c,i).
Discussion and Conclusions
In this study, the relaxation properties, iron concentration as well as CEST effect of endometrioma are significantly different from various ovarian cystic lesions, suggesting that multi-parametric quantitative MRI can provide robust performance in endometriomas diagnosis.In conclusion, multi-parametric quantitative MRI can be considered an effective method in differentiating endometriomas from diverse ovarian cystic lesions in clinical practice.
Acknowledgements
No acknowledgement found.References
- Eskenazi B, Warner ML. Epidemiology of endometriosis. ObstetGynecol Clin North Am. 1997;24:235-58.
- Benaglia L, Bermejo A, Somigliana E, Faulisi S, Ragni G, Fedele L, Garcia-Velasco JA. In vitro fertilization outcome in women with unoperated bilateral endometriomas. Fertil Steril 2013;99:1714-1719.
- Suraj D. Serai. Basics of magnetic resonance imaging and quantitative parameters T1, T2, T2*, T1rho, and diffusion-weighted imaging. Pediatric Radiology.https://doi.org/10.1007/s00247-021-05042-7.
- Keisuke Ishimatsu , Akihiro Nishie, Yukihisa Takayama, et al. Amide proton transfer imaging for differentiating benign ovarian cystic lesions: Potential of first time right. European Journal of Radiology. 2019,120,108656.
Figures
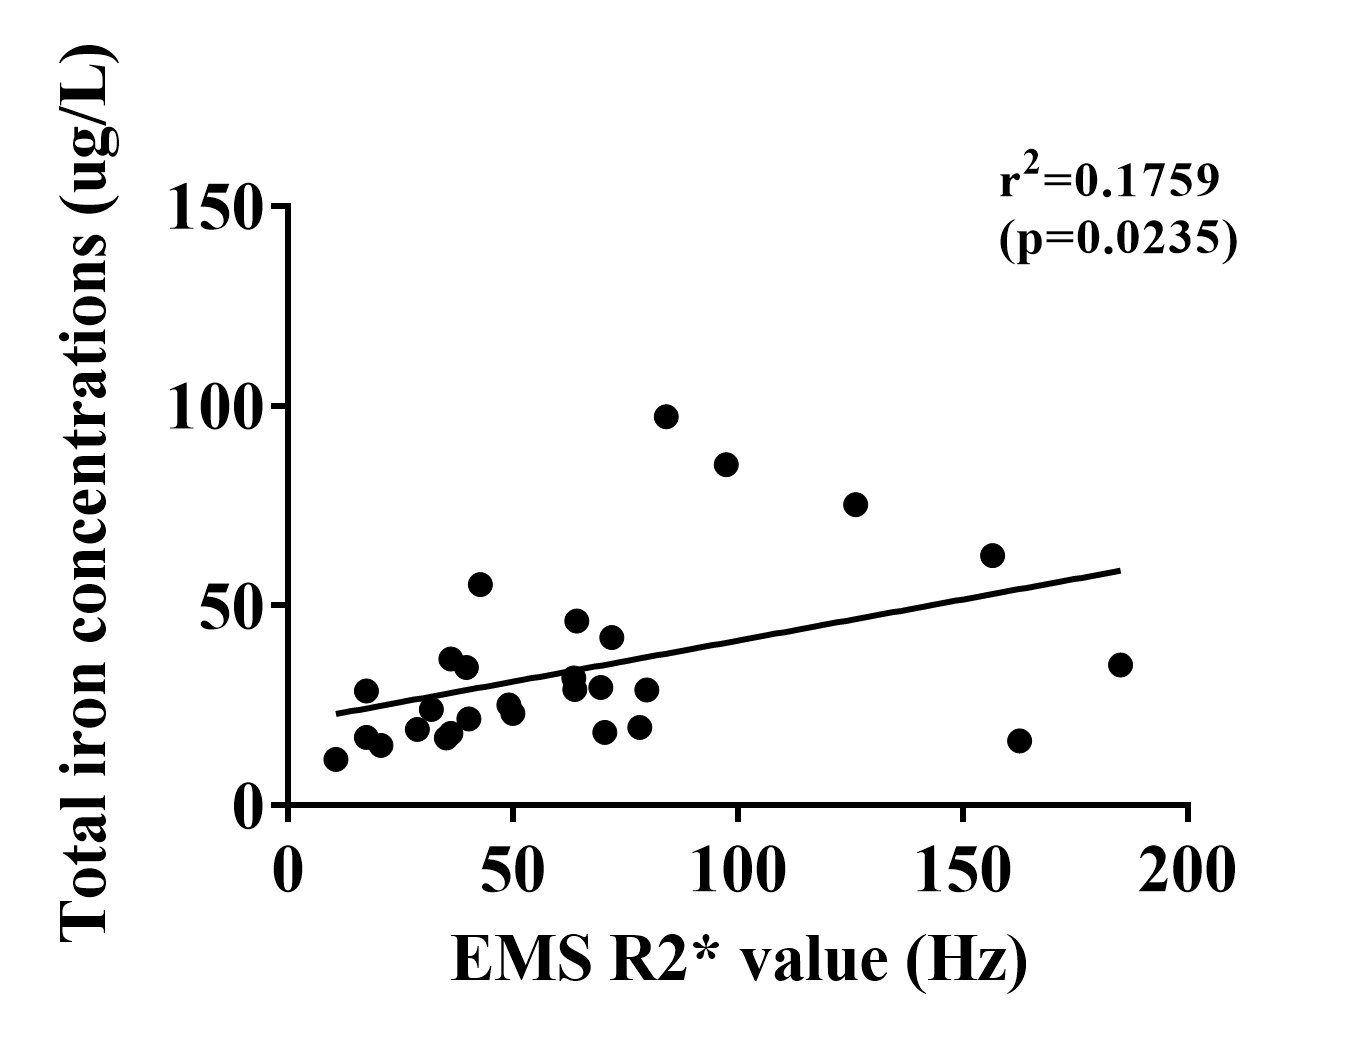
Figure 1: The correlation between cyst fluid total iron concentrations and EMS R2* value. EMS R2* value showed weak correlation with the cyst fluid total iron concentration ([total iron] = 0.2056 × [EMS R2* value] + 20.74, r = 0.419).
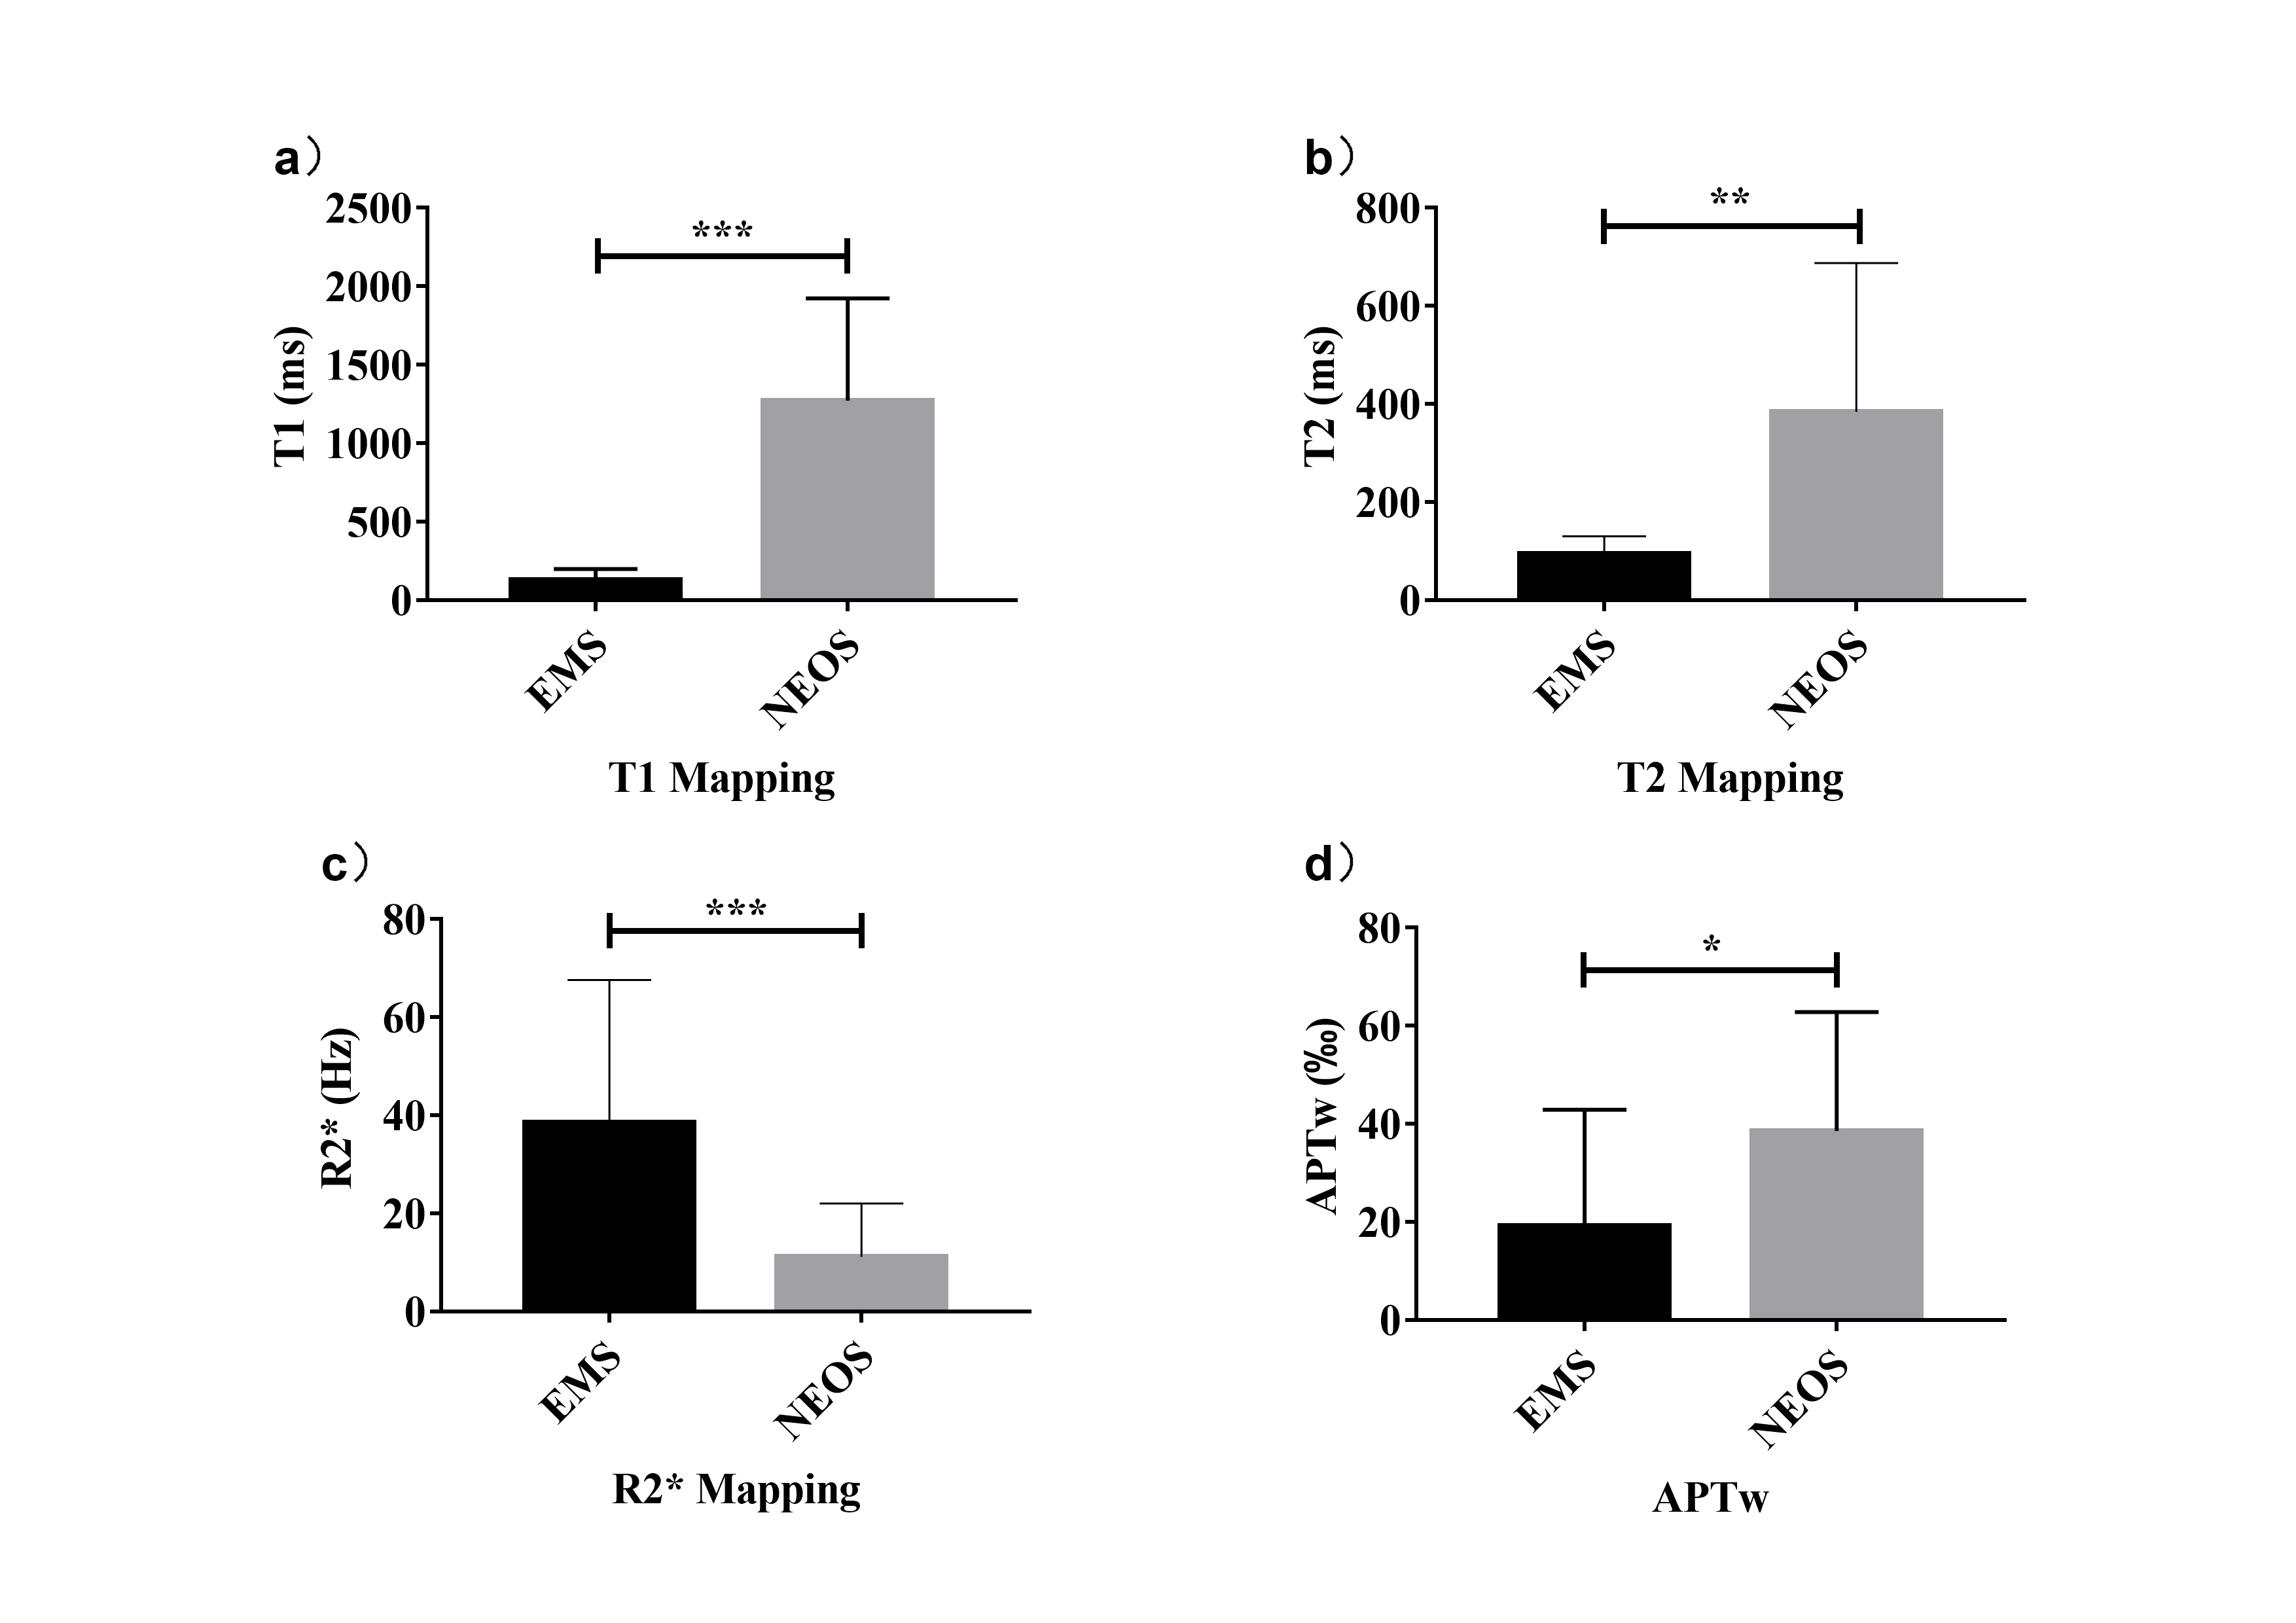
Figure 2: The distribution of cyst fluid T1(a), T2(b), R2*(c), and APTw(d) values with EMS and NEOS. Data are presented as mean ± SD and tested by independent sample t-test,*P < .05, **P < .01, ***P <0.001.
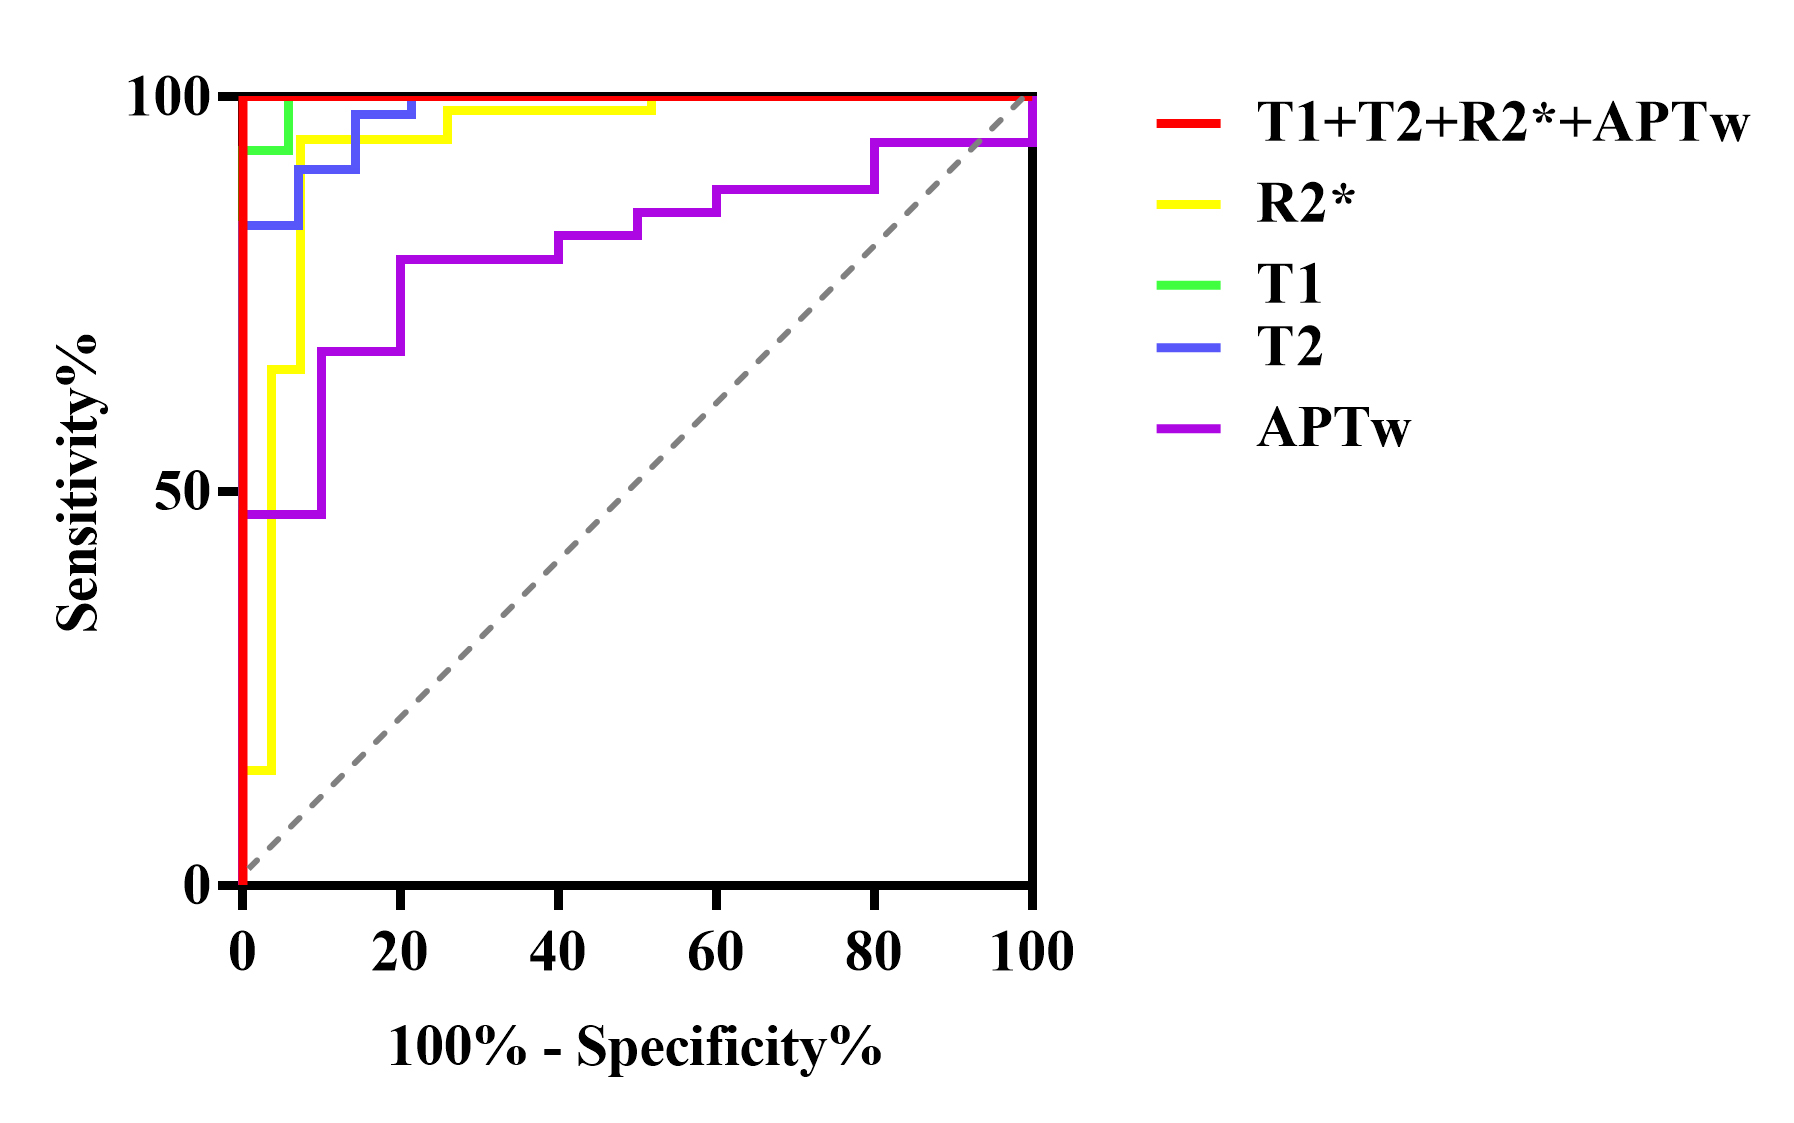
Figure 3: Receiver operating characteristic curves (ROC) of ovrian cyst fluid T1, T2, R2* and APTw value in patients with EMS and NEOS.
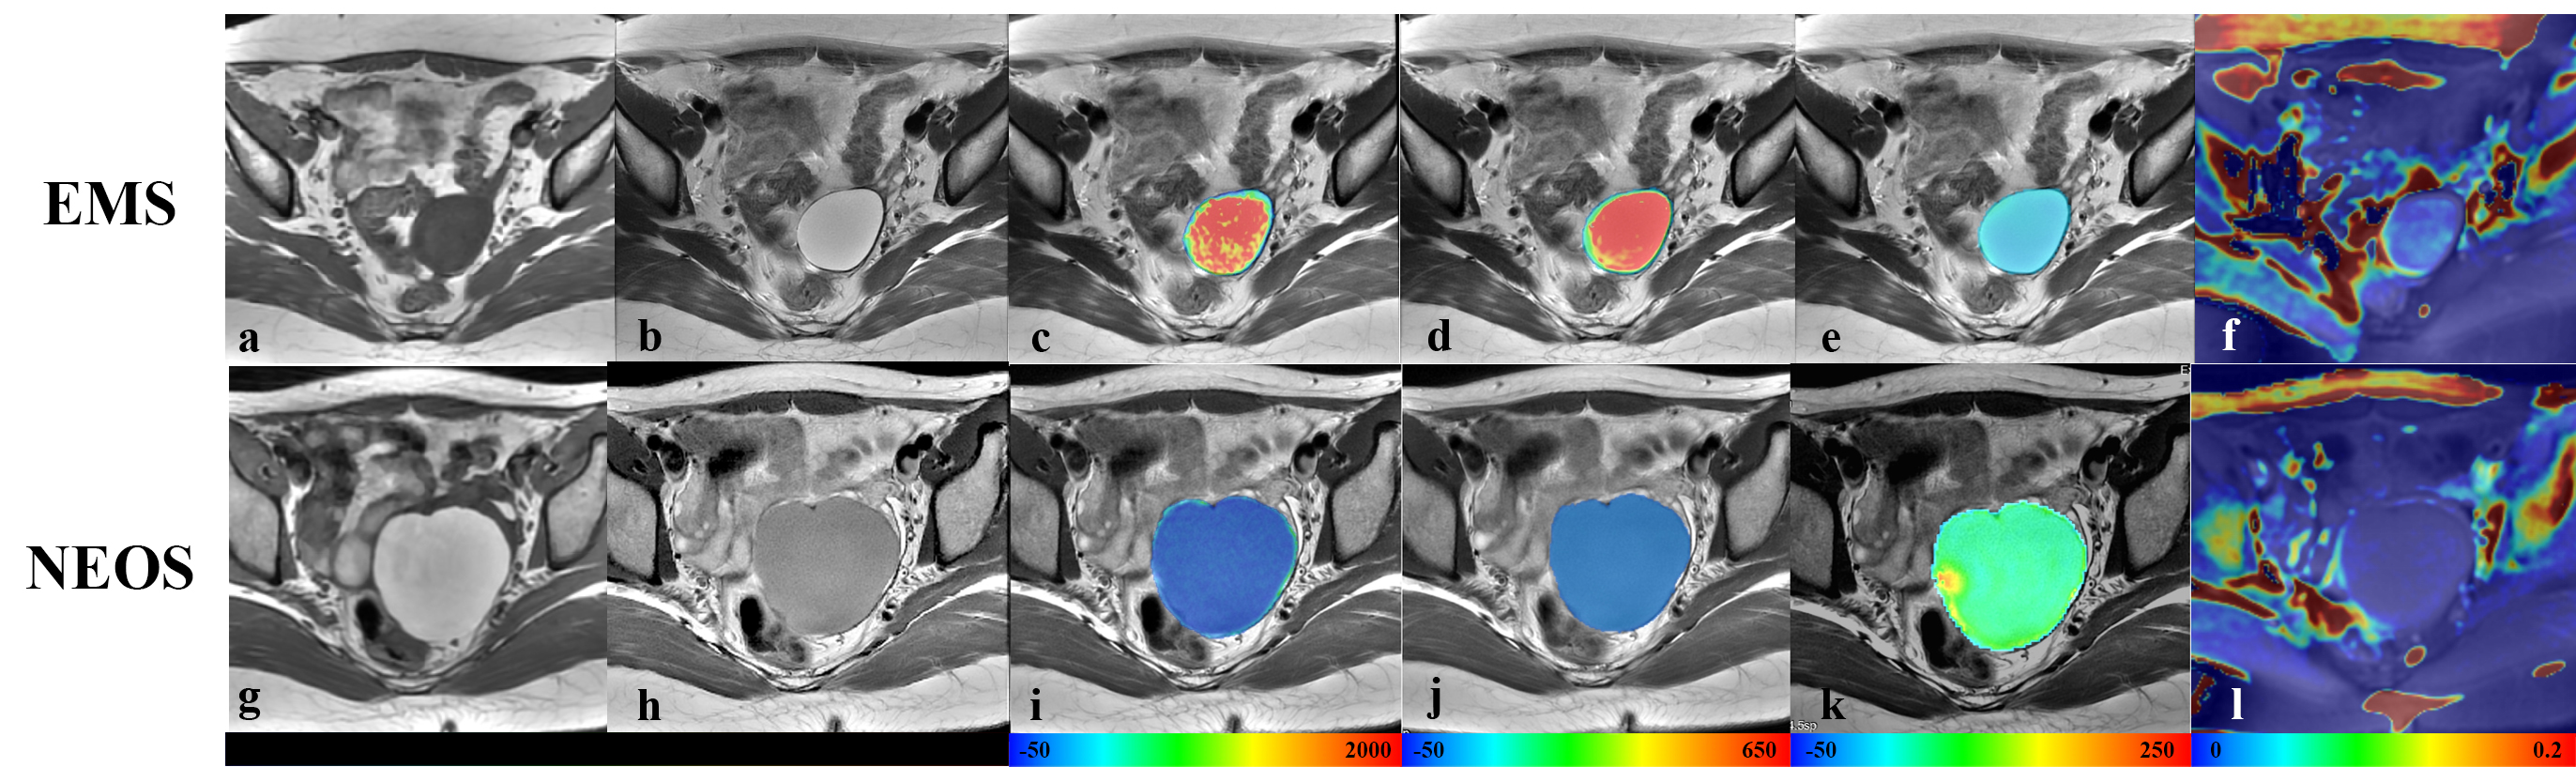
Figure 4: Multi-parametric MRI of EMS and NEOS, including T1WI(a,g),T2WI(b,h), fusion of T2WI and T1 map(c,i),fusion of T2WI and T2 map(d,j),fusion of T2WI and R2* map(e,k) and APTw(c,i).
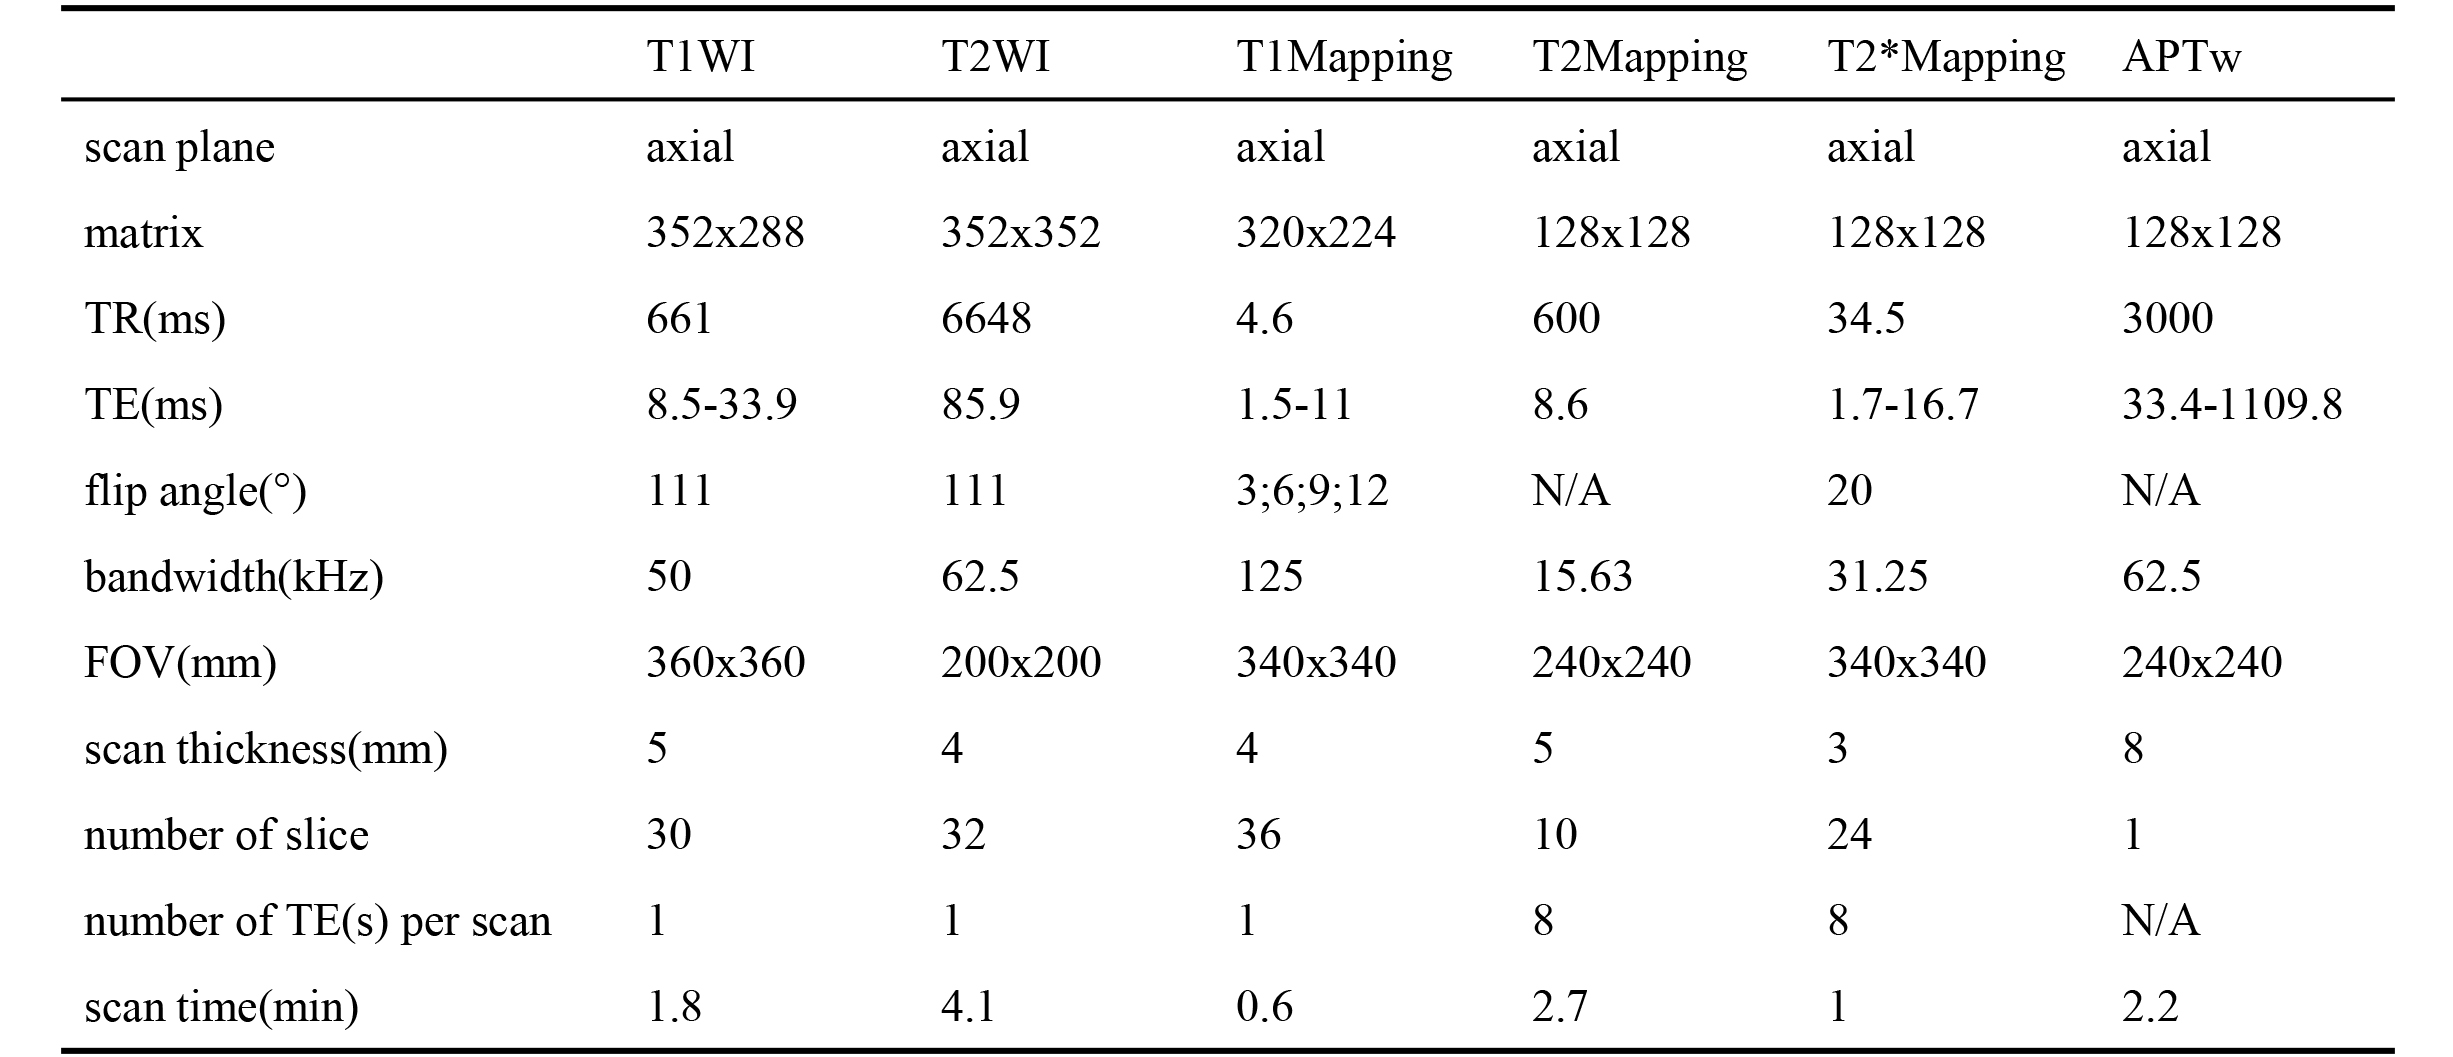
Table 1: Scan parameters used in the study.
DOI: https://doi.org/10.58530/2022/3151