3150
The Effect of Implant for Lumbar Assessment in Simultaneous TOF PET/MR: A Preliminary Report
Wei-Min Hung1, Ching-Wei Gu1, Guo-Shu Huang1, Charng-Chyi Shieh2, Chia-Wei Li2, Yen-Chang Chen2, and Yi-Chih Hsu1
1Department of Radiology, Tri-Service General Hospital, National Defense Medical Center, Taipei, Taiwan, 2GE Healthcare, Taipei, Taiwan
1Department of Radiology, Tri-Service General Hospital, National Defense Medical Center, Taipei, Taiwan, 2GE Healthcare, Taipei, Taiwan
Synopsis
This study focused on the accuracy of standardized uptake value (SUV) reconstructed using the corrected MR attenuation correction (MRAC) images with time-of-flight (TOF) information by PET in patients with metallic implants. We compared the SUV of both paraspinal and psoas muscles in patients with and without implant for TOF reconstructed PET images. In the result, there was no significance in the SUV measurements obtained from MRAC between no-implant and with-implant patients. And therefore, our study demonstrated that SUVs measured from TOF PET/MR of lumbar implant indicated good reliability and robust of MRAC.
PURPOSE
Sciatica is pain radiating from lumbar spine or the buttock downward along the sciatic nerve into one leg or, less frequently, both legs. The simultaneous TOF 18F-FDG PET/MRI is an innovational diagnostic approach for chronic sciatica [1], especially for lumbar spinal implant patients. The high sensitivity of 18F-FDG PET is helpful to detect an abnormal increase in metabolism caused by painful inflammation while the MRI can offer the subtle structural abnormalities. However, metallic implants would result in the signal loss in the MRAC images, and it makes the large artifacts of metallic implants on 3D T1-weighted LAVA-Flex images, which is usually used for MRAC images. The inaccurate MRAC images would lead to inaccuracy SUV data of patients with metallic implants. To eliminate the influence of metallic implants in MRAC images, previous literatures mentioned that the TOF information might reduce the effect of the incorrect AC map on the PET image [2,3]. Yet no literatures demonstrated the improvement of MRAC with TOF in lumbar assessment, and therefore, this study aimed to compare mean standardized uptake value (SUVmean) of both side paraspinal and psoas muscles in patients with and without implant for TOF reconstructed PET images.METHODS
A total of 6 patients (3 without and 3 with implant) who underwent an 18F FDG PET/MR of lumbar spine and lower extremity with chronic sciatica symptoms from June to October 2021 were collected retrospectively. Exclusion criteria were the abnormal uptake of lumbar paraspinal muscle due to lesions or adverse local tissue reactions (Fig. 1). One hour after a standard dose injection of 370.0 MBq 18F-FDG, patients underwent PET/MRI in a GE scanner (SIGNA TOF PET/MR; GE Healthcare). They were scanned from lower thoracic spine to the feet in 5 or 6 bed positions for around 1 hour, depending on the height of the patient. The rainbow color scale ranging from 0 to 3 for SUV value was used to render the PET images reconstructed with product MR based attenuation correction techniques (Fig. 2). The following MRI sequences were performed simultaneously with PET scans for each bed: 3-dimensional coronal LAVA Flex (repetition time (TR), 9.2 ms; echo time (TE), 1.9 ms; resolution, 1x1x1 mm; flip angle, 12), and 2-dimensional axial T2-weighted Flex (TR, 8600 ms; TE, 90 ms; resolution, 1.25x2x4 mm; echo train length, 15) with an integrated spine coil, and two 32-channel body phase-array coils were used. All images were reviewed by using Advantage Workstation 4.7 (GE Healthcare). ROIs were drawn over six normal both side paraspinal and psoas muscles (at the level of L4) in patients with and without implant to estimate SUVmean. Statistical analyses were performed using MATLAB R2017b. The paired t-tests were performed to compare SUVs obtained from MR attenuation correction.RESULTS and DISCUSSION
The overall scanning time for PET/MRI was 56.6±4.2 minutes. The mean time interval between FDG injection and PET/MR image acquisition was 62.3±3.5 minutes. The data of both side paraspinal and psoas muscles were divided into two groups. The average SUV of right Multifidus, left Multifidus, right Psoas Major, left Psoas Major were 0.58±0.03, 0.61±0.03, 0.59±0.03, and 0.62±0.03, respectively, for no-implant group; the average SUV were 0.56±0.05, 0.6±0.03, 0.63±0.08, and 0.63±0.09, respectively, for with-implant group (Fig. 3a). The SUVmean of normal psoas muscles using MR attenuation-corrected is 0.63± 0.16 [4], and our results were agreed with the values illustrated in the previous literatures. Using paired t-test, no significant differences in the average SUV among the no-implant and with-implant groups (p > 0.44). Further, the average SUV ratio (SUVR) of Multifidus normalized to Psoas was used to compare regional differences in lumbar metabolism pattern between no-implant and with-implant patients. No significance was found in the SUVR between no-implant and with-implant groups (p > 0.1) (Fig. 3b).CONCLUSION
This study showed overall no significance in the SUV measurements obtained from MRAC between no-implant and with-implant patients. SUVs measured from TOF PET/MR of lumbar implant indicated good reliability and robust of MRAC.Acknowledgements
No acknowledgement found.References
- Cipriano PW, Yoon D, Gandhi H, et al., “18F-FDG PET/MRI in Chronic Sciatica: Early Results Revealing Spinal and Nonspinal Abnormalities.,” J Nucl Med., Jun;59(6):967-972, 2018.2.
- Davison H, ter Voert EE, de Galiza Barbosa F, et al., “Incorporation of Time-of-Flight Information Reduces Metal Artifacts in Simultaneous Positron Emission Tomography/Magnetic Resonance Imaging: A Simulation Study.,” Invest Radiol., Jul;50(7):423-9, 2015.3.
- Conti M., “Why is TOF PET reconstruction a more robust method in the presence of inconsistent data?,” Phys Med Biol., 56:168, 2011.4.
- Lyons K, Seghers V, Sorensen JI, Zhang W, et al., “Comparison of Standardized Uptake Values in Normal Structures Between PET/CT and PET/MRI in a Tertiary Pediatric Hospital: A Prospective Study.,” AJR Am J Roentgenol Nov;205(5):1094-101, 2015.
Figures

Fig. 1. ROIs were drawn over both side paraspinal and psoas muscles at the level of L4 and exclusion criteria for abnormal uptake.
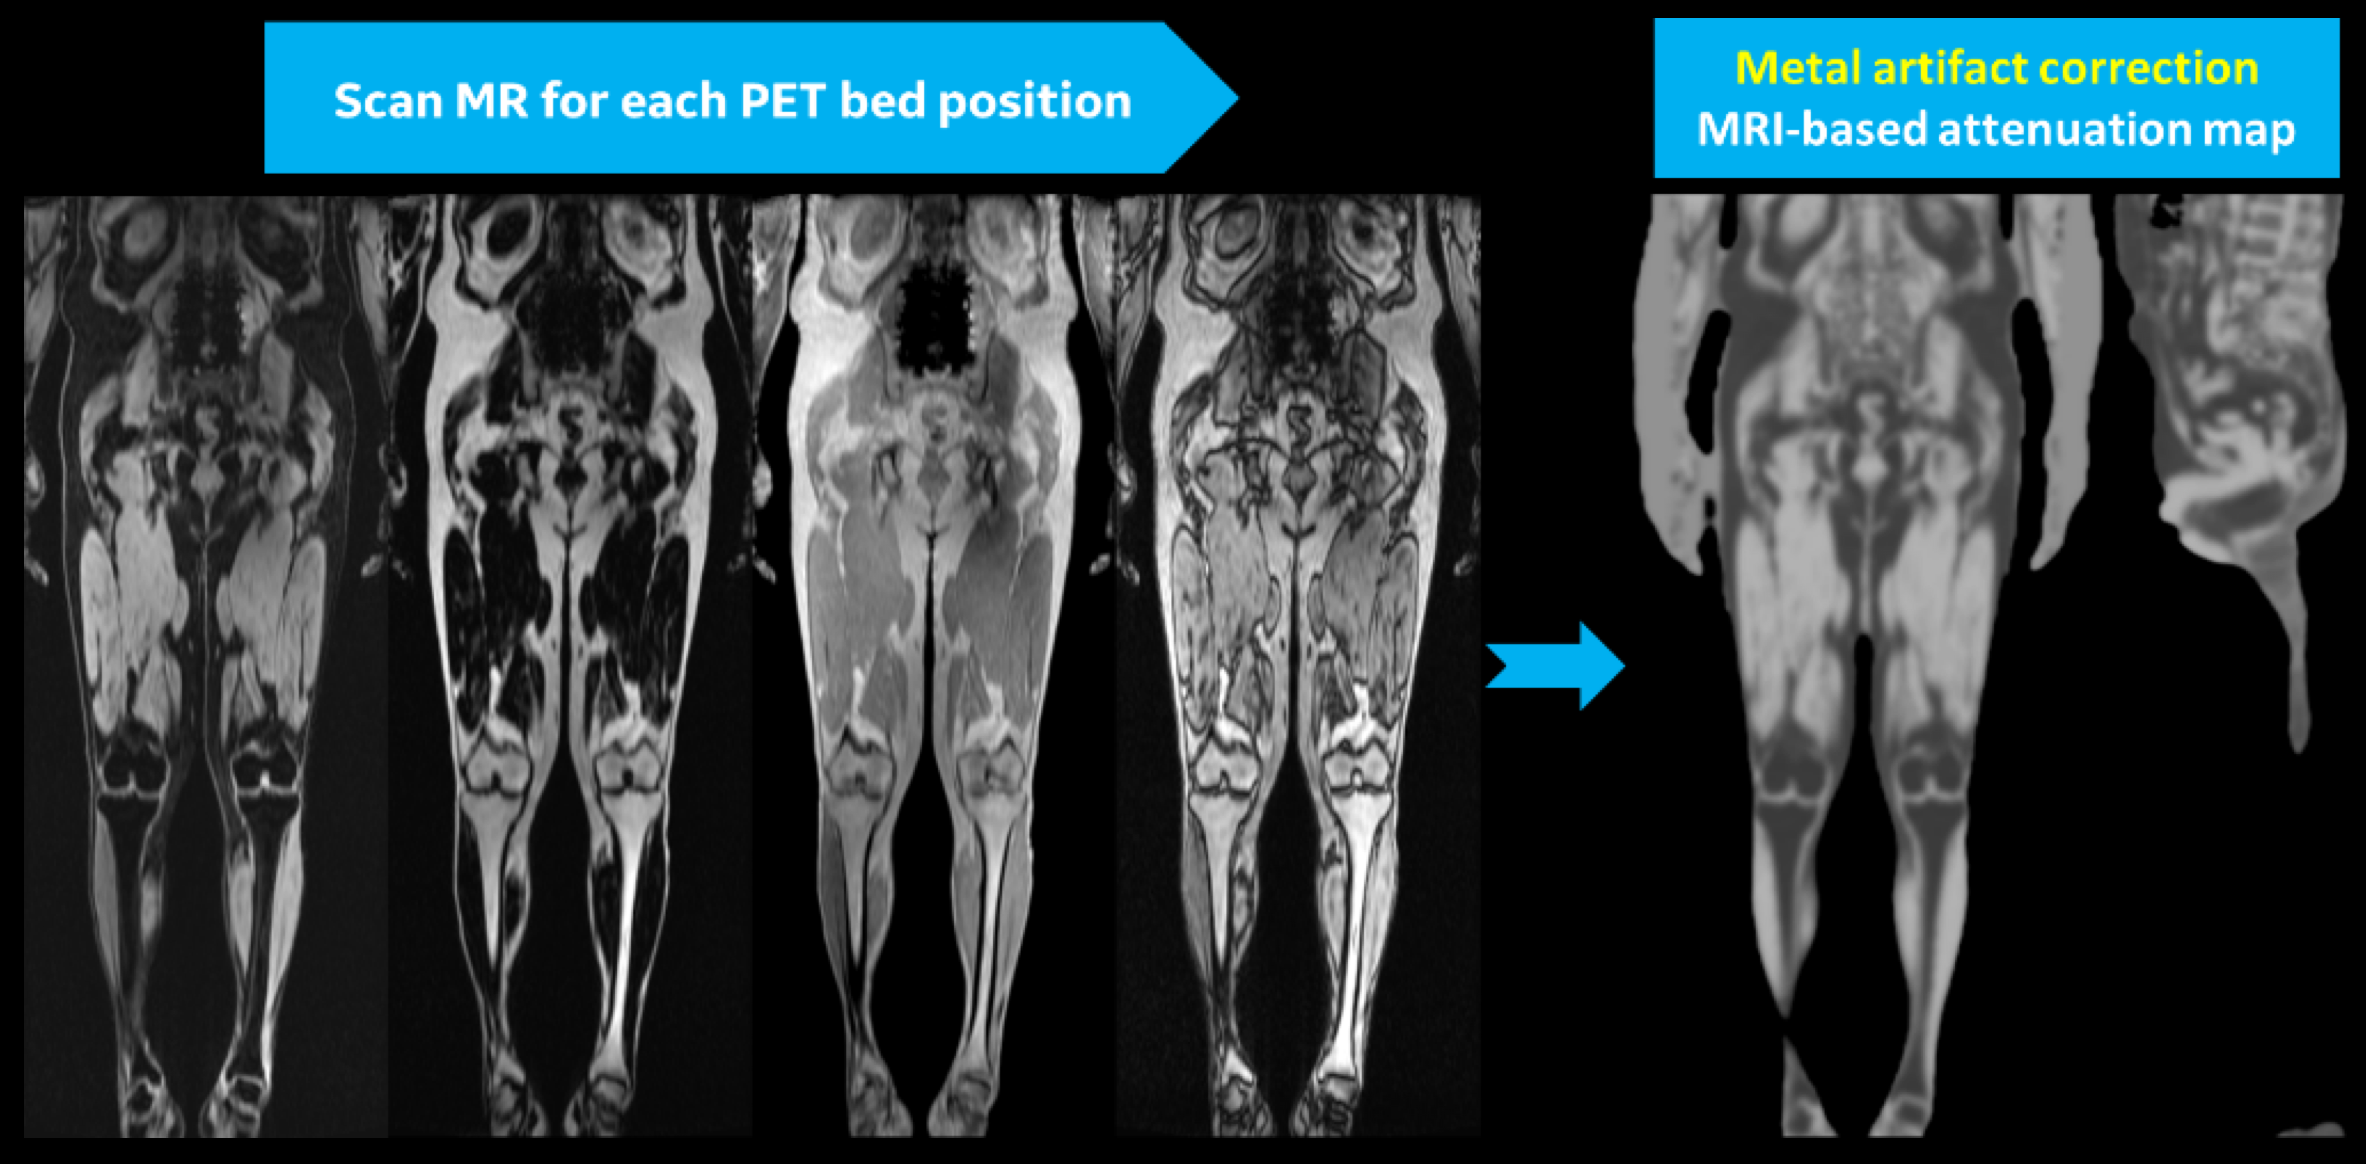
Fig. 2. Original scan of LAVA Flex(Water, fat, InPhase, and OutPhase) and MR attenuation correction Map.

Fig. 3. Box plot of SUVmean estimations for paraspinal and psoas muscles(a) and SUVR(b) with and without implant in both side.
DOI: https://doi.org/10.58530/2022/3150