3149
Assessment of lumbra osteoporosis using MRI fat content quantitative technology:comparison with QCT
Chumin Huang1, Zisan Zeng1, and Huiting Zhang2
1Radiology, The First Affiliated Hospital of Guangxi Medical University, Nanning, China, 2MR Scientific Marketing, Siemens Healthnieers, Hubei, China
1Radiology, The First Affiliated Hospital of Guangxi Medical University, Nanning, China, 2MR Scientific Marketing, Siemens Healthnieers, Hubei, China
Synopsis
The purpose of this study is to explore the feasibility of magnetic resonance imaging (MRI) 3D multi-echo-Dixon (ME-Dixon) and T2-corrected multi-echo single-voxel (HISTO) spectroscopy sequences to evaluate osteoporosis by comparison with quantitative computed tomography (QCT). The results show that the proton density fat fraction (PDFF) values of bone marrow measured by these two MRI methods have high and significantly negative correlation with bone mineral density (BMD) values measured by QCT at lumbar.
Introduction
Previous studies have shown that the development of age-related osteoporosis is related to the decrease of bone formation and the increase of bone marrow fat accumulation. During the development of osteoporosis, the differentiation of bone marrow mesenchymal stem cells into adipocytes rather than osteoblasts partially contributes to osteoporosis [1]. The diagnosis of osteoporosis centers on assessment of BMD, QCT is one of the standard procedures in bone densitometry[2]. Bone marrow adiposity, which may play a significant role in affecting bone size and density, has recently gained increasing attention as a potential biomarker for bone quantity and quality. ME-Dixon and HISTO were both considered highly reliable and repeatable method for quantitatively and noninvasively evaluating fat contents in vertebral bone marrow [3-5]. The purpose of this study was to prospectively evaluate ME-Dixon and HISTO sequences for the assessment of osteoporosis of lumbar by comparison with QCT in a clinical setting.Methods
A total of 138 people participated in this prospective study, including 75 women, (age range 41–70 years; mean age 55.5±7.2 years), 63 men (age range 41-70 years, mean age 55.7±7.4 years). The inclusion criteria participants were: the age range 41-70 years, had not received osteoporosis treatment before and could cooperate with QCT and MRI examinations. The exclusion criteria included participants with hyperparathyroidism, hyperthyroidism, renal bone disease, hematological diseases, vertebral deformities, lumbar spine surgery, and taking drugs that affect bone metabolism. Asynchronous QCT were performed on a 256 slices high speed spiral CT (Revolution, GE Healthcare, Milwaukee, WI, USA). Scan parameters were 120kVp, 100mAs, 2.5-mm slice thickness, and 50cm field of view (FOV). MRI examinations were performed on a 3T system (MAGNETOM Prisma, Siemens Healthcare, Erlangen, Germany) on the same day. In addition to routine imaging sequences, ME-Dixon and T2-corrected multi-echo single-voxel (HISTO) spectroscopy sequences were performed on lumbar, the scanning parameters are shown in Table 1. After the scan, the QCT images were transmitted to the QCT PRO PC workstation (Mindways Software Inc., Austin, TX, USA), regions of interests (ROIs) were placed semi-automatically within the first to the fourth lumbar vertebra body(L1-L4) for the measurement of BMD values. The ME-Dixon fat fraction values (ME-Dixon_PDFF) were obtained by manually drawing ROIs the on L1-L4 in fat fraction map. The HISTO fat fraction values (HISTO_PDFF) were calculated inline by positing spectroscopy voxel on L1-L4 respectively. The ROI locations for CT and MRI are shown in Figure 1. The values of each vertebral body was recorded and their average values were calculated for statistical analysis. Statistical analysis was performed using SPSS (version 21, Chicago, IL, USA). The average values of ME-Dixon_PDFF, HISTO_PDFF and BMD of each participant 's L1-L4 are calculated, and each average value obeys a normal distribution, the correlation between BMD and ME-dixon_PDFF, BMD and HISTO_PDFF were evaluated using Pearson’s correlation analysis.Results
Strong and significantly negative correlation were found respectively between ME-Dixon_PDFF and BMD of QCT(r= -0.680, p<0.01), and between ME-Dixon_PDFF and BMD of QCT (r=-0.557, p<0.01) . The statistical analysis results are shown in Figure 2.Discussion and Conclusion
The diagnosis of osteoporosis centers on the assessment of bone mineral density (BMD). QCT was recommended by The International Society for Clinical Densitometry (ISCD) in 2007[2] and the American College of Radiology in 2008[6] as a reliable method to measure BMD, but the main disadvantages of computed tomography are high exposure to radiation, difficulties with quality control, and high cost. MRI fat content quantitative technology has the advantages of excellent reliability and repeatability, short scanning time and radiationless.In our study, two different MRI methods were compared with QCT in an osteoporotic group. The results showed that ME-Dixon_PDFF and HISTO_PDFF values which can assess bone marrow adiposity, had strong and significant negative correlation with the BMD values of QCT which can assess cancellous bone density, suggesting that increased bone marrow adiposity was associated with decreased bone mineral density (BMD) in patients with osteoporosis , MRI fat content quantitative technology can be a valuable tool for providing complementary information on bone quality.Acknowledgements
We sincerely thank the participants in this study.References
[1] Hu L, Yin C, Zhao F, Ali A, Ma J, Qian A. Mesenchymal Stem Cells: Cell Fate Decision to Osteoblast or Adipocyte and Application in Osteoporosis Treatment. Int J Mol Sci. 2018 Jan 25;19(2):360. doi: 10.3390/ijms19020360. PMID: 29370110; PMCID: PMC5855582. [2] Engelke K, Adams JE, Armbrecht G, Augat P, Bogado CE, Bouxsein ML, Felsenberg D, Ito M, Prevrhal S, Hans DB, Lewiecki EM. Clinical use of quantitative computed tomography and peripheral quantitative computed tomography in the management of osteoporosis in adults: the 2007 ISCD Official Positions. J Clin Densitom. 2008 Jan-Mar;11(1):123-62. doi: 10.1016/j.jocd.2007.12.010. PMID: 18442757. [3] Lee SH, Yoo HJ, Yu SM, Hong SH, Choi JY, Chae HD. Fat Quantification in the Vertebral Body: Comparison of Modified Dixon Technique with Single-Voxel Magnetic Resonance Spectroscopy. Korean J Radiol. 2019 Jan;20(1):126-133. doi: 10.3348/kjr.2018.0174. Epub 2018 Dec 27. PMID: 30627028; PMCID: PMC6315074. [4] Schmeel FC, Vomweg T, Träber F, Gerhards A, Enkirch SJ, Faron A, Sprinkart AM, Schmeel LC, Luetkens JA, Thomas D, Kukuk GM. Proton density fat fraction MRI of vertebral bone marrow: Accuracy, repeatability, and reproducibility among readers, field strengths, and imaging platforms. J Magn Reson Imaging. 2019 Dec;50(6):1762-1772. doi: 10.1002/jmri.26748. Epub 2019 Apr 13. PMID: 30980694. [5] Li X, Kuo D, Schafer AL, Porzig A, Link TM, Black D, Schwartz AV. Quantification of vertebral bone marrow fat content using 3 Tesla MR spectroscopy: reproducibility, vertebral variation, and applications in osteoporosis. J Magn Reson Imaging. 2011 Apr;33(4):974-9. doi: 10.1002/jmri.22489. PMID: 21448966; PMCID: PMC3072841. [6] American College of Radiology. ACR Practice Guideline for the Performance of Quantitative Computed Tomography (QCT) Bone Densitometry (Resolution 33). Reston, VA: ACR, 2008. Available at: http://www. acr.org//media/ACR/Documents/PGTS/guidelines/QCT. PdfFigures

Table1. Scan
Parameters

Figure
1. a) QCT
measured BMD (place the frame of interest in the center of the vertebral body,
avoiding the vertebral cortex and vertebral veins). b) The ME-dixon_PDFF value
is obtained by manually drawing the Lumbar Vertebrae body ROI on the sagittal
fat fraction map. c)HISTO voxel was positioned using three-plane localizers to
avoid vertebral cortices.
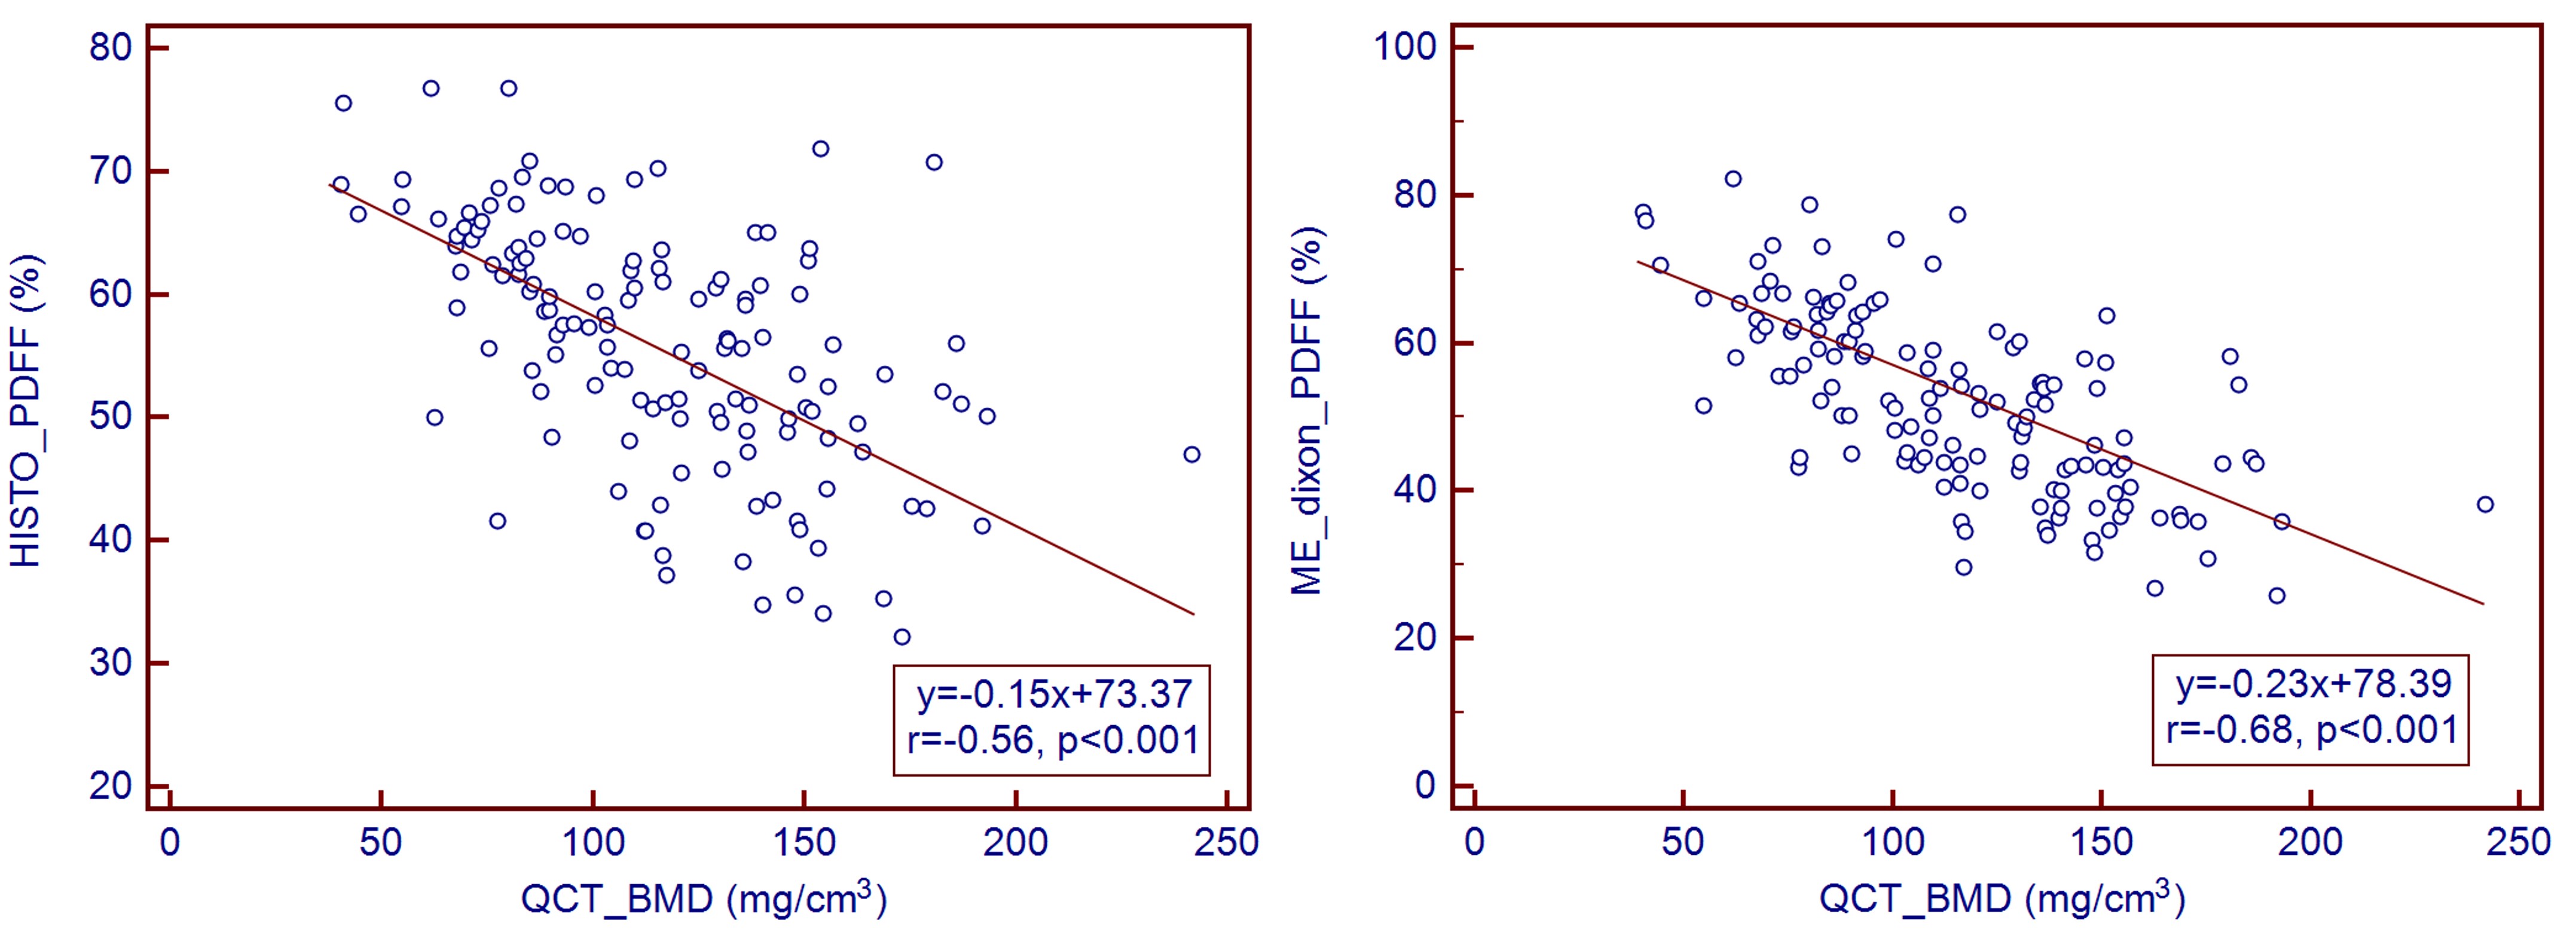
Figure
2. Scatterplot
showing negative correlation between ME-Dixon_PDFF and BMD of QCT , as well as
between ME-Dixon_PDFF and BMD of QCT (r= -0.680, p<0.01;r=-0.557,
p<0.01,respectively)
.
DOI: https://doi.org/10.58530/2022/3149