3146
Monitoring the response to induction therapy of multiple myeloma by diffusion weighted and mDIXON Quant whole body imaging
Mengtian Sun1, Jingliang Cheng1, Cuiping Ren1, Jie Ma2, and Liangjie Lin3
1MRI, the First Affiliated Hospital of Zhengzhou University, Zhengzhou, China, 2Hematology, the First Affiliated Hospital of Zhengzhou University, Zhengzhou, China, 3Philips Healthcare, Beijing, China
1MRI, the First Affiliated Hospital of Zhengzhou University, Zhengzhou, China, 2Hematology, the First Affiliated Hospital of Zhengzhou University, Zhengzhou, China, 3Philips Healthcare, Beijing, China
Synopsis
This study aims to investigate the value of whole-body DWIBS and mDIXON Quant imaging in monitoring the response to induction therapy of multiple myeloma focal lesions (FLs). Significant differences in the number of multiple myeloma focal lesions (FLs), the maximum diameter of FLs, ADC, FF, T2* values, ADC change rate, FF change rate and T2* change rate were observed between the deep remission group and the non-deep remission group. The FF change rate was the best discriminator of the deep remission.
Introduction
MRI has high sensitivity for the early detection of marrow infiltration by myeloma cells. However, due to the persistence of inactive lesions after treatment, assessment of focal lesions (FLs) with conventional MRI is not a reliable predictor of response to induction therapy[1]. Functional MRI technologies have been increasingly applied in clinical diagnosis and treatment of multiple myeloma. Therefore, this study investigates the value of DWIBS and mDIXON Quant in monitoring the response to induction therapy of multiple myeloma FLs.Methods
65 newly diagnosed myeloma patients in our hospital from January 2020 to June 2021 were prospectively collected. According to the effect of induction therapy, they were divided into deep remission group of 42 cases (as shown in Figure 1) and non-deep remission group of 23 cases (as shown in Figure 2). All patients underwent whole-body MRI before and after induction treatment. MRI images were acquired by using a 3.0T MR scanner (Ingenia, Philips Healthcare, Netherlands) with the following parameters. DWIBS: axial acquisition, TR = 9331 ms, TE = 63 ms, TI = 250 ms, FOV = 450 mm × 338 mm × 286 mm for each station, slice thickness = 5 mm, b value=0 and 800 s/mm2, scan time (each segment) =19 s; mDIXON Quant: coronal acquisition, six evenly‐spaced echoes (TE1 = 0.96 ms, ΔTE = 0.7 ms), TR = 5.6 ms, flip angle = 3°, FOV = 450 mm × 320 mm × 240 mm, slice thickness = 2.7 mm, scan time (each segment) = 168 s; STIR: coronal acquisition, TR = 7099 ms, TE = 70 ms, TI = 230ms, FOV = 450 mm × 320 mm × 251 mm for each station, slice thickness = 6 mm, scan time (each segment) = 28 s. Two radiologists analyzed the MR images of all patients before and after treatment. The number of FLs, maximum diameter of FLs, ADC, FF and T2* values were measured using Philips post-processing workstation (IntelliSpace Portal, Philips Healthcare). The anatomical areas of whole-body bone were divided into cervical spine, thoracic spine, lumbar spine, pelvis, long bones, skull, ribs or other[2], each part can measure up to 3 maximum FLs, and the measured lesion diameter was greater than 10 mm. two independent sample t-test or Mann Whitney test (there is a statistical difference when p<0.05) was performed to compare the parameters before and after treatment. ROC curve was used to analyze different MRI parameters to identify the diagnostic efficacy of induction treatment. All the statistical analysis was performed with SPSS statistical software (version 24.0; IBM Corp., Armonk, NY, USA).Results
The changes in each parameter for deep remission group and non-deep remission group were summarized in Table 1. Before treatment, the maximum diameter of FLs in the non-deep remission group was significantly larger than that in the deep remission group (P = 0.002). After treatment, there were significant differences in the number of FLs, the maximum diameter of FLs, ADC, FF, T2* values, ADC change rate, FF change rate and T2* change rate between the two groups (P < 0.001). The FF change rate showed the best diagnostic performance (area under the ROC curve: 0.989) for discrimination between before and after induction treatment (Table 2).Discussion
In this study, DWIBS and mDIXON Quant were used to monitor the response to induction therapy of multiple myeloma FLs. The FLs often present with active hyperplasia, reduced yellow bone marrow, and increased myeloma cells[3]. With the decreased cellularity and return of marrow fat, ADC and FF values increased significantly after the induction therapy, and the change rate of ADC and FF in deep remission group were significantly higher than that in non-deep remission group. The infiltration of myeloma cells caused bone destruction, reduced bone density, and widened space among trabeculae, thus weakening the local magnetic field inhomogeneity and extending T2*[4]. A decrease in T2* was indicative of a good response to induction therapy and there was a significant difference in the T2* change rate between the deep remission group and the non-deep remission group.Conclusion
DWIBS combined with mDIXON Quant with quantitative measurements of ADC, FF and T2* values can evaluate the remission depth of FLs induction therapy for myeloma, which is helpful to the implementation of individualized treatment for patients.Acknowledgements
This manuscript has not been published or presented elsewhere in part or in entirety and is not under consideration by another journal. The study design was approved by the appropriate ethics review board. We have read and understood ISMRM policies, and we believe that neither the manuscript nor the study violates any of these. There are no conflicts of interest to declare.References
[1]Karampinos DC, Ruschke S, Dieckmeyer M, et al. Quantitative MRI and spectroscopy of bone marrow. J Magn Reson Imaging, 2018, 47(2):332-353.[2]Messiou C, Hillengass J, Delorme S, et al. Guidelines for Acquisition, Interpretation, and Reporting of Whole-Body MRI in Myeloma: Myeloma Response Assessment and Diagnosis System (MY-RADS). Radiology, 2019, 291(1):5-13.
[3]Koutoulidis V, Fontara S, Terpos E, et al. Quantitative Diffusion-weighted Imaging of the Bone Marrow: An Adjunct Tool for the Diagnosis of a Diffuse MR Imaging Pattern in Patients with Multiple Myeloma. Radiology, 2017, 282(2):484-493.
[4]Tang MY, Chen TW, Zhang XM, et al. GRE T2∗-weighted MRI: principles and clinical applications. Biomed Res Int, 2014, 312142.
Figures
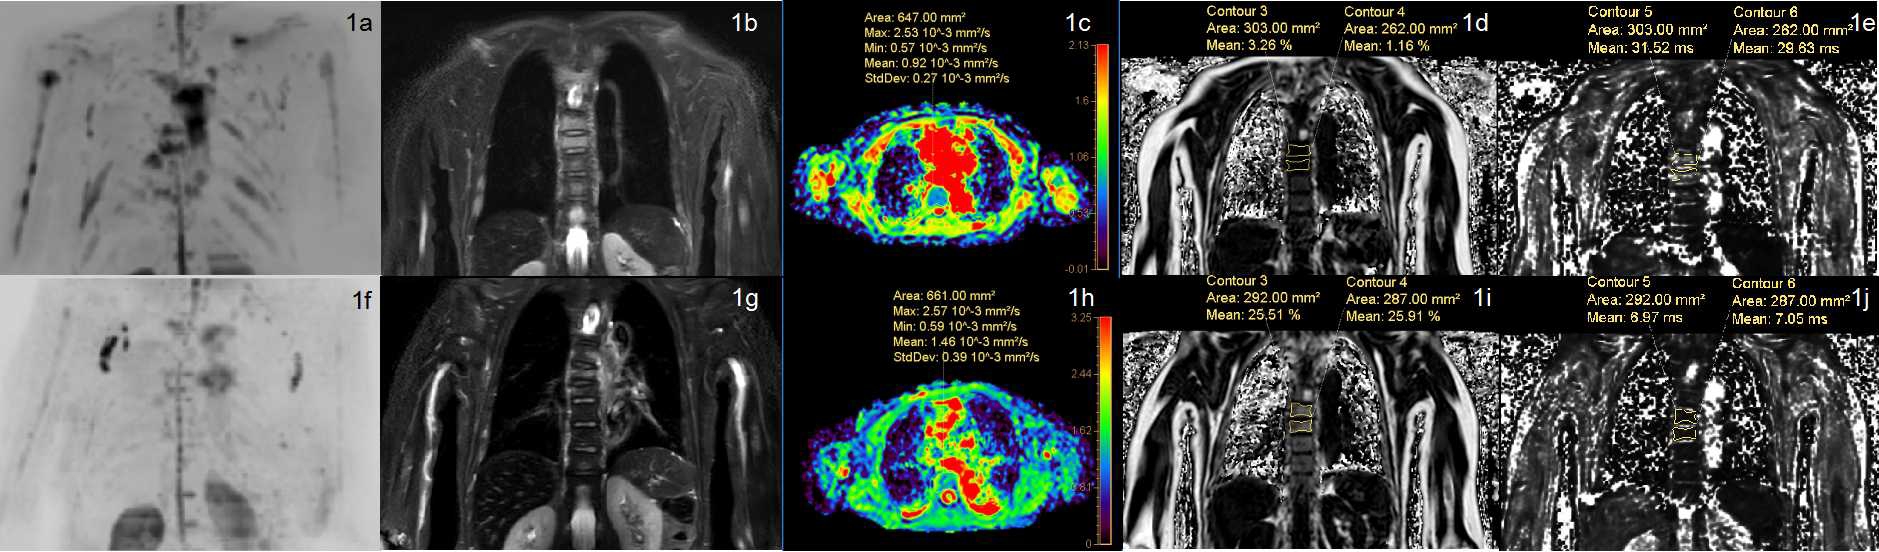
Figure 1. The whole-body MRI of a 67-year-old female multiple myeloma patient before (1a–1e) and after (1f–1j) the induction therapy. The clinical efficacy was evaluated as deep remission group. DWIBS (1a, 1f) showed that the number of focal lesions decreased significantly after treatment. STIR (1b, 1g) showed that the signal intensity of the thoracic 6 and 7 vertebral body lesions decreased. The ADC (1c,1h) and the FF (1d, 1i) of the lesion increased while the T2* (1e, 1j) decreased.
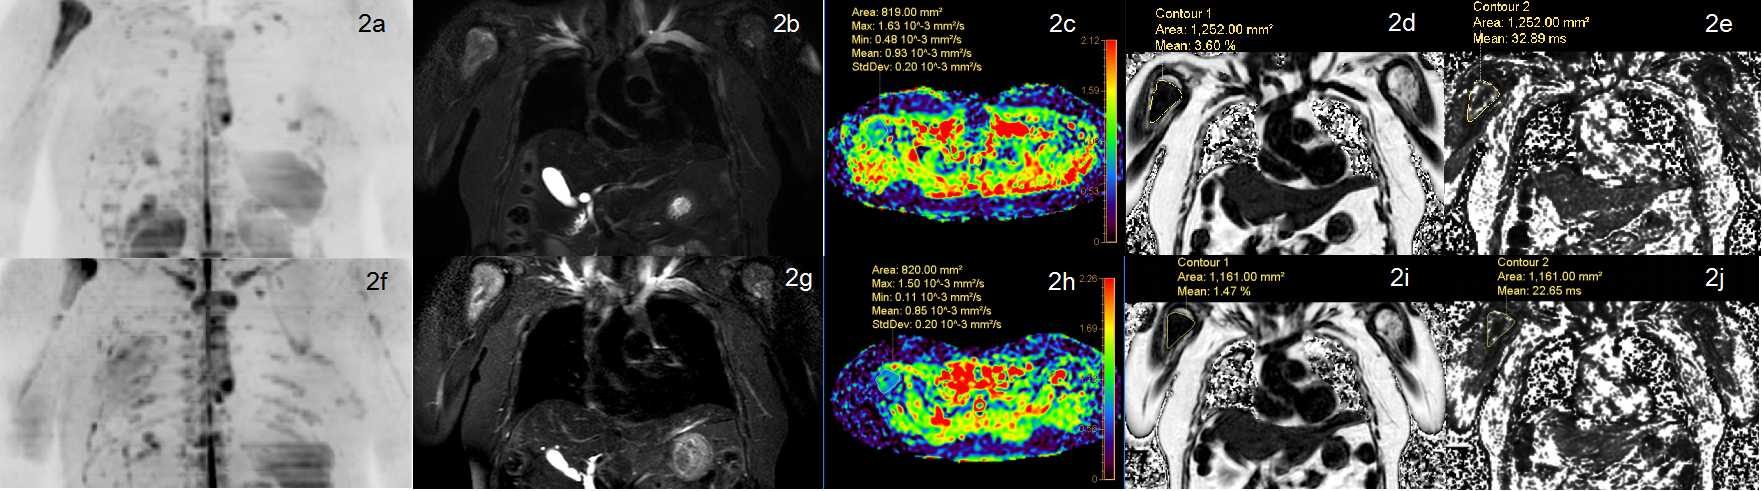
Figure 2. The whole-body MRI of a 54-year-old female multiple myeloma patient before (2a-2e) and after (2f-2j) the induction therapy. The clinical efficacy was evaluated as non-deep remission group. DWIBS (2a, 2f) showed that the number of focal lesions increased significantly after treatment. STIR (2b, 2g) showed that the signal intensity of the right humerus lesion increased. The ADC(2c ,2h), FF (2d, 2i) and T2*(2e,2j) values decreased.
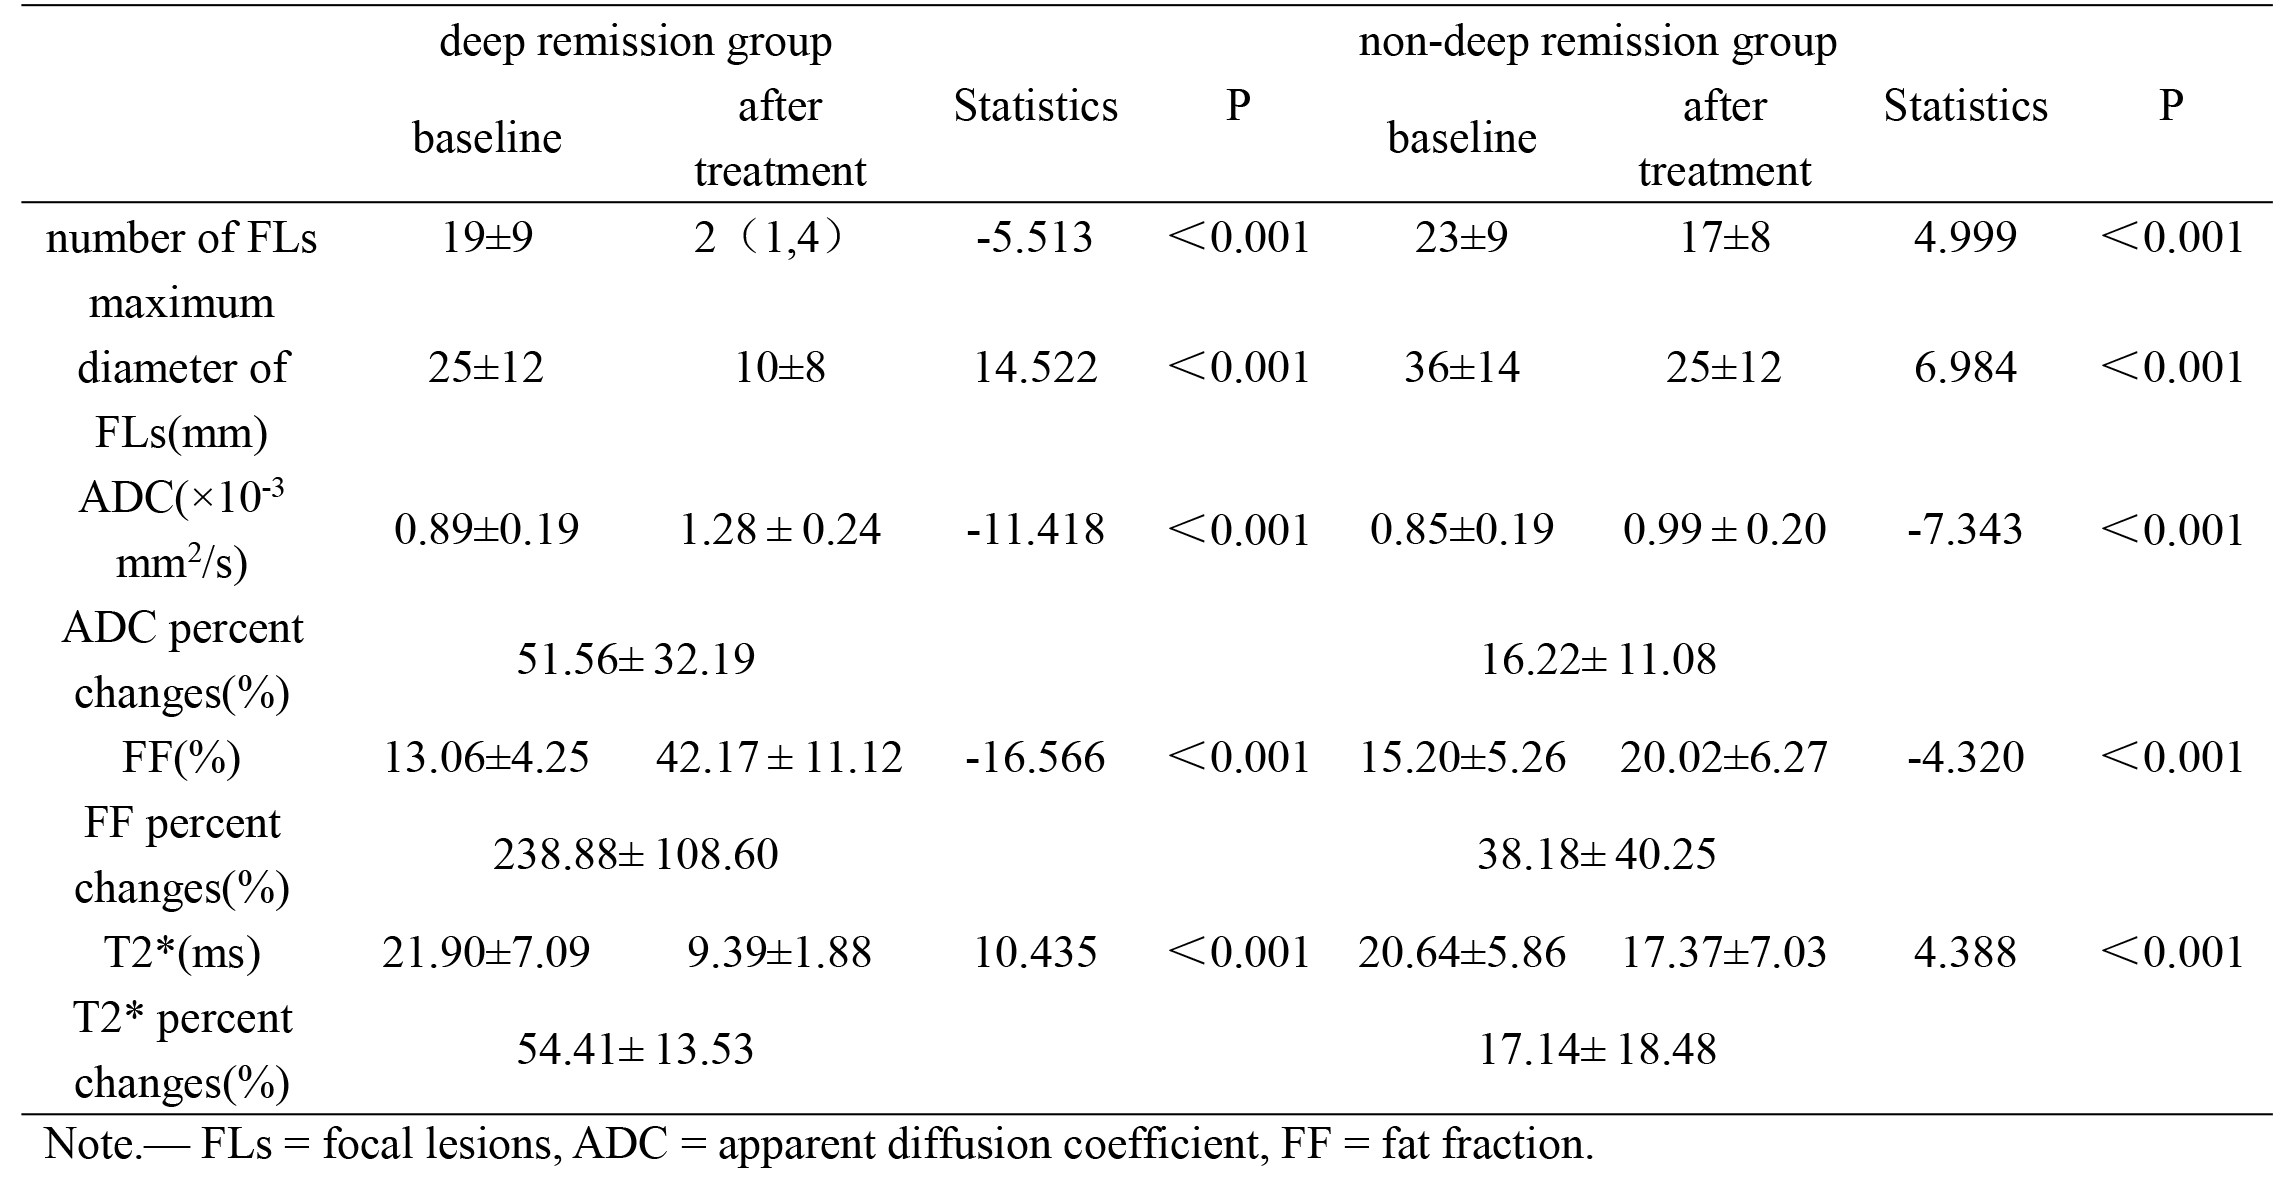
Table 1. Before and after treatment imaging parameters for deep remission group and non-deep remission group.
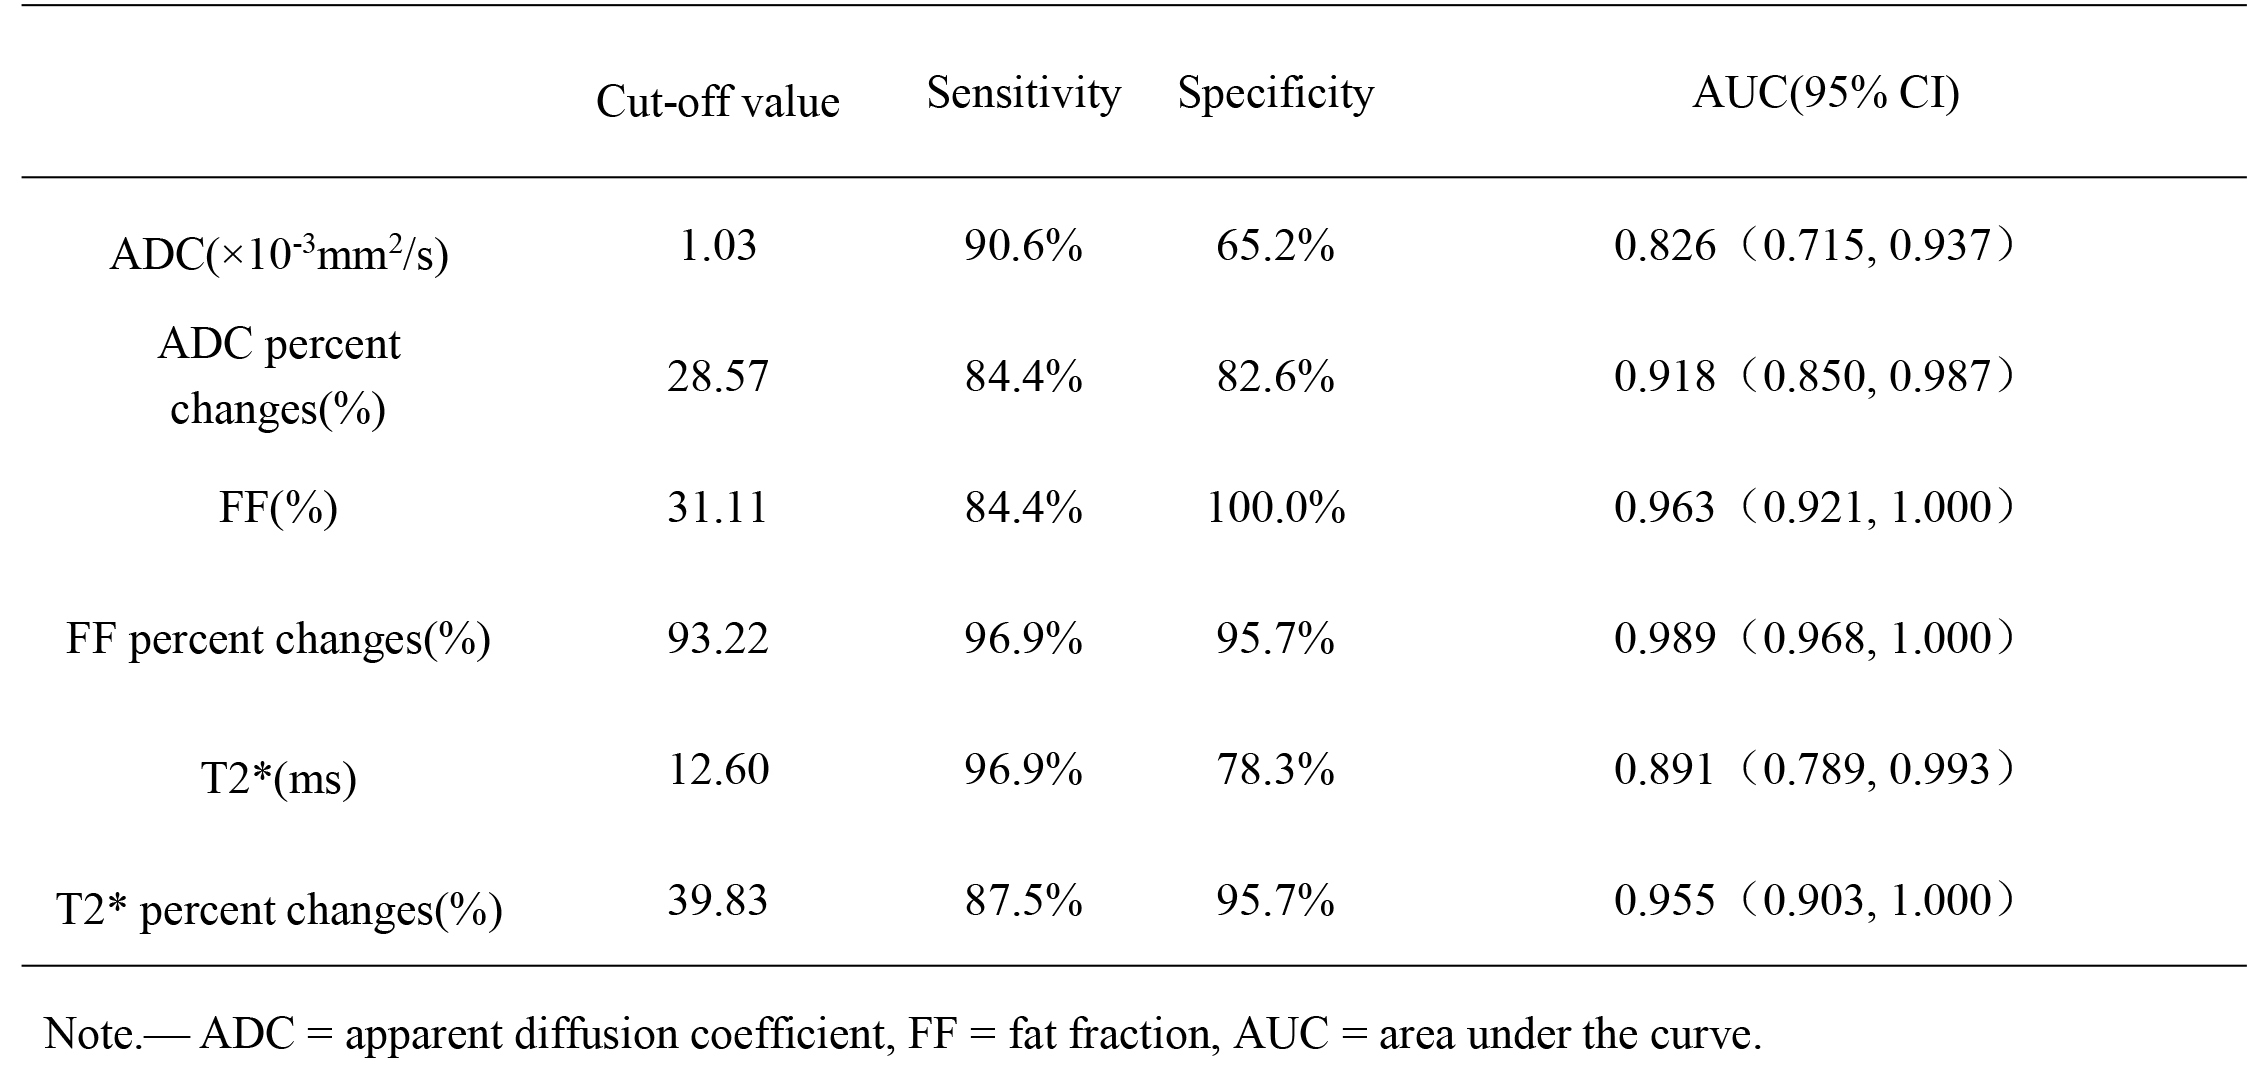
Table 2. Cut-off values of MRI parameters to monitor the response.
DOI: https://doi.org/10.58530/2022/3146