3145
Monoexponential, bi-exponential, and diffusion kurtosis MR imaging models in the diagnosis of placenta accreta spectrum disorders
Tao Lu1, Yishuang Wang1, and Shaoyu Wang2
1Sichuan Academy of Medical Sciences & Sichuan Provincial People’s Hospital, Chengdu, China, 2MR Scientific Marketing, Siemens Healthineers, shanghai, China
1Sichuan Academy of Medical Sciences & Sichuan Provincial People’s Hospital, Chengdu, China, 2MR Scientific Marketing, Siemens Healthineers, shanghai, China
Synopsis
This study investigated the diagnostic value of monoexponential, biexponential, and diffusion kurtosis MR imaging (MRI) in differentiating placenta accreta spectrum (PAS) disorders. The results showed that D mean and D max differed significantly among all the studied parameters for differentiating PAS disorders. A combined use of these two parameters yielded an AUC of 0.93 with sensitivity, specificity, and accuracy of 83.08%, 88.89%, and 83.70%, respectively. This suggested the quantitative evaluation of PAS disorders with different DWI models and PAS disorders can be differentiated effectively with the combined use of the different DWI parameters.
INTRODUCTION
Placenta accreta spectrum (PAS) disorders refer to an abnormal condition where the placental chorionic villi adhere to or invade the myometrium, entering into a place with deficient decidual formation1, 2. Although MRI has been increasingly a complementary modality for the prenatal diagnosis of PAS disorders in recent years,the discrimination of typical MRI features related to PAS disorders is proposed to require expertise and doctors’ experience. Quantification of placental function and identification of mothers at high risk are both important in today’s clinical practice. DWI, IVIM and DKI are non-invasive, in vivo techniques that can be used to quantitatively evaluate the heterogeneity, cellularity, and microvascular perfusion of the placentas. Therefore, this study primarily aimed to apply these promising advanced DWI models except the conventional DWI model to evaluate the placental function of patients with PAS disorders and, secondly, evaluate whether the diagnostic parameters derived from different DWI models could be served as quantitative biomarkers for diagnosing PAS disorders.METHODS
MRI examinations were performed on a 1.5T MR scanner(MAGNETOM Aera, Siemens Healthineers, Erlangen ,Germany) using a 16-channel body matrix coil. DWI was performed with 11 different b values ranging from 0 to 1600 s/mm2 (b = 0, 50, 100, 150, 200, 400, 600, 800, 1000, 1200, and 1600 s/mm2). ROI delineation and calculation of the DWI, DKI, IVIM parameters were performed using research software IMAgenGINE (Vusion Tech) 3. All patients’ whole placenta ROIs were drawn on each consecutive DWI with b=0 s/mm2 covering the whole placenta, referring to conventional T2WI. PAS-ROIs were drawn covering the accreta lesions (Fig. 1). The mean, minimum, and maximum ADC (ADC mean, ADC min, and ADC max), eADC (eADC mean, eADC min, and eADC max), MD (MD mean, MD min, and MD max), MK (MK mean, MK min, and MK max), D (D mean, D min, and D max), D* (D* mean, D* min, and D* max), and f (f mean, f min, and f max) values were automatically calculated, and the diffusion parameter maps were also automatically produced. All the parameters were corrected before statistical analysis to remove changes induced by gestational ageRESULTS
Sixty-five patients with PAS disorders and 27 patients with normal placentas remained in the analysis. comparisons between accreta lesions in patients with PAS (AP) and whole placentas in patients with normal placentas (WP-normal) using volumetric analysis were performed. It demonstrated that, MD mean, f mean, D mean, D* mean and D* min were significantly higher while ADC max, MK mean, MK max and D max were significantly lower in patients with PAS disorders (all p < 0.05) (Figs. 2 and 3). At multivariate analysis, D mean(OR:4.124, 95% CI, 1.854-9.176) and D max (OR:0.148, 95% CI, 0.065-0.338) were identified as independent risk factors for PAS disorders. For discriminating PAS disorders, the AUCs of the above 2 parameters were 0.73 and 0.85 respectively while the AUC yielded 0.93 with the combined use of the 2 significant parameters. Significant differences were found in the AUCs between the combined model and other parameters (all p < 0.05) (Fig. 4).DISCUSSION
Our study showed that D mean and D max were independent risk factor for PAS disorders from comparisons between accreta lesions in patients with PAS (AP) and whole placentas in patients with normal placentas. Capuani’s study identified that the normal placenta had higher cellularity and abundant cytoplasm, hindering water diffusion4. In this study, the D mean was significantly lower in normal placentas than in accreta lesions, supporting the previous hypothesis. D max was probably measured in areas with less water diffusion restriction. It had higher diagnostic accuracy than D mean in the accreta lesions, suggesting the noteworthy increased cellularity in certain areas in the accreta lesions. We further combined D mean and D max for predicting PAS disorders, the diagnostic performance improved significantly with higher sensitivity, specificity, and accuracy of 83.08%, 88.89%, and 93.39%, respectively. It suggested the feasible combined use of the 2 DWI parameters in the quantitative evaluation and prediction of PAS disorders.CONCLUSION
This study took the lead in combining two promising functional DWI models, DKI, and IVIM with conventional DWI models to characterize placental heterogeneity, cellularity, and microvascular perfusion at the same time and distinguishing PAS disorders. In this study, the accreta lesions were hyperperfused with increased blood movement in the IVS and the fetal capillaries but with deceased cellularity and heterogeneity compared with normal placentas. These changes were prominent enough to involve the whole placenta but were more profound in the accreta lesions. It is worthwhile and necessary to combine different DWI parameters in the comprehensive evaluation and accurate diagnosis of PAS disorders. Secondly, PAS disorders can be differentiated with the combined use of D mean and D max.Acknowledgements
N/AReferences
1 Jauniaux E, Ayres-de-Campos D. FIGO Placenta Accreta Diagnosis and Management Expert Consensus Panel.FIGO consensus guidelines on placenta accreta spectrum disorders: introduction [J] .Int J Gynaecol Obstet, 2018 ,140: 261-264 2 Jauniaux E, Chantraine F, Silver RM, et al.FIGO Placenta Accreta Diagnosis and Management Expert Consensus Panel.FIGO consensus guidelines on placenta accreta spectrum disorders : epidemiology [J] .Int J Gynaecol Obstet, 2018 ,140: 265-273 3 Yang M, Yan Y, Wang H. IMAge/enGINE: a freely available software for rapid computation of highdimensional quantification. Quant Imaging Med Surg 2018. doi: 10.21037/qims.2018.12.03 4 Capuani S, Guerreri M, Antonelli A, et al.Diffusion and perfusion quantified by Magnetic Resonance Imaging are markers of human placenta development in normal pregnancy. placenta.2017,58:33-39Figures
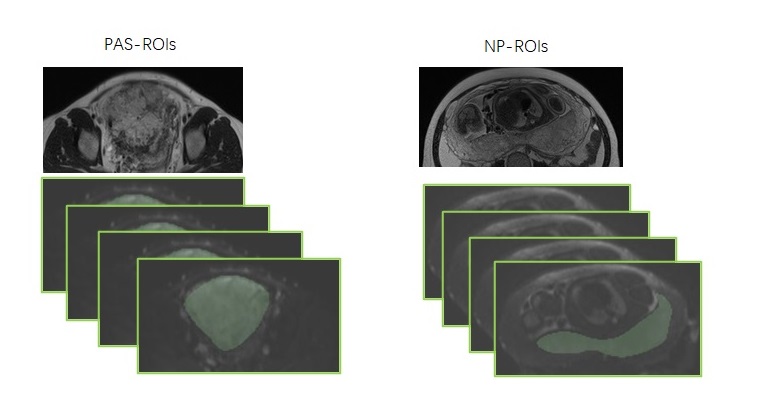
Figure 1 The schematic illustration of
PAS-ROIs and NP-ROIs
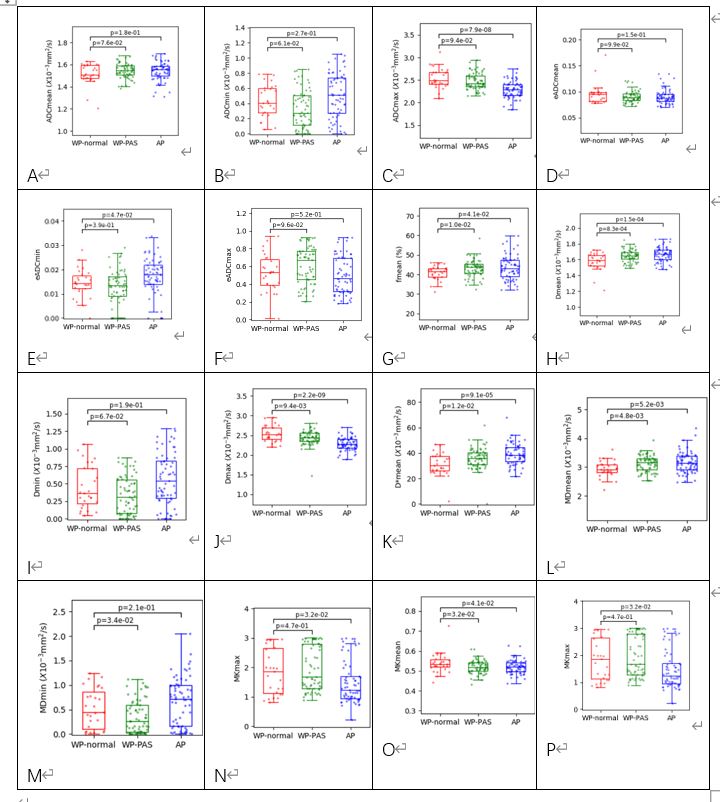
Figure 2 Box and whisker plots of ADC, eADC,
MD, MK, D, D* and f for patients with normal placentas (WP-normal), patients
with PAS disorders (WP-PAS) and accreta lesions in patients with PAS (AP)
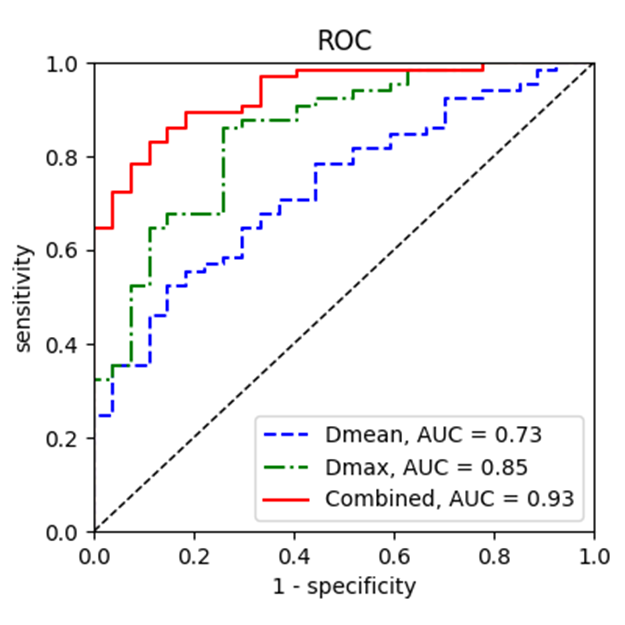
Figure 3 ROC curves for
predicting PAS disorders based on parameters from different DWI models.
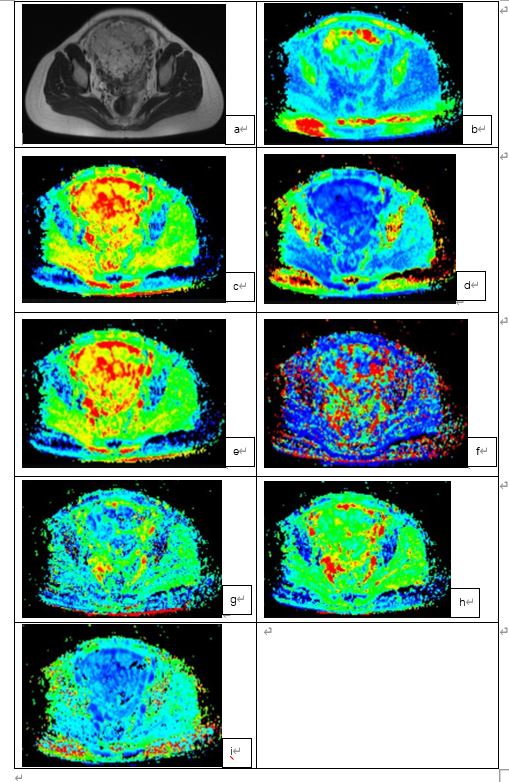
Figure 4 PAS disorders in a 33-year-old
woman with prior CD and placenta previa.
DOI: https://doi.org/10.58530/2022/3145