3143
Evaluation of Endostar and chemoradiotherapy combination efficacy on cervical cancer bydiffusion kurtosis imaging histogram analysis1First Affiliated Hospital of Guangxi Medical University, Nanning, China, 2MR Scientific Marketing, Siemens Healthcare Ltd, Nanning, China
Synopsis
This study explored the feasibility of whole tumor diffusion kurtosis imaging (DKI) histogram analysis (HA) to assess concurrent chemoradiotherapy (CCRT) combined with Endostar for locally advanced cervical cancer (LACC) before and during treatment. In terms of predicting efficacy, DKI whole tumor HA showed higher sensitivity and specificity, and higher the area under the ROC curve in the CCRT plus Endostar than in the CCRT group. During the treatment of LACC using Endostar, compared with the mean value of ADC, MD, MK and tumor diameter, DKI whole tumor HA showed excellent potential in monitoring treatment response and predicting early efficacy.
Introduction
The aim of this study was to verify the value of using diffusion kurtosis imaging (DKI) whole tumor histogram analysis (HA) to monitor a treatment response and predict the early efficacy of concurrent chemoradiotherapy (CCRT) combined with Endostar in locally advanced cervical cancer (LACC).Methods
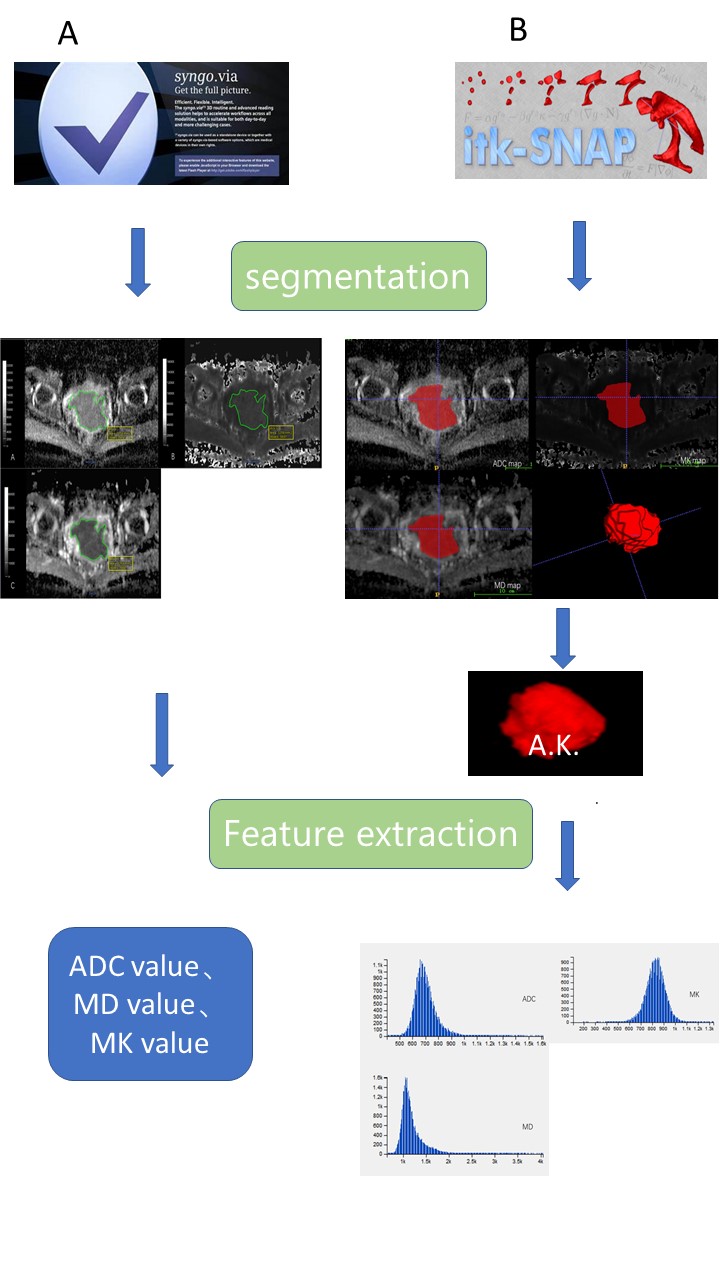
Nineteen LACC patients underwent conventional T1w, T2w magnetic resonance imaging (MRI) and DKI[1-3] before and at third and fifth weeks after CCRT plus Endostar combination therapy on the MAGNETOM Prisma 3T scanner (Siemens Healthcare, Erlangen, Germany). The diffusion sensitive gradients in three directions were selected in the DKI sequence, and the six b values were 0,500,1000, 1500, 2000 and 2500s/mm², and the acquisition time was 4min49s. Mean diffusivity (MD) and mean kurtosis (MK) maps from DKI were calculated, and apparent diffusion coefficient (ADC) was also calculated using b=0 and 1000 s/mm2. We evaluated the maximum cross-sectional diameter of the tumor on T2w image, and the mean value and the features of entire tumor histograms of ADC, MD and MK maps at these three time points after treatment. The image analysis process is shown in Figure 1. The early efficacy of LACC was evaluated using the solid tumor response assessment criteria (RECIST) version 1.1, which was divided into complete response (CR) and partial response (PR) group. Independent-samples t test, Fisher’s exact test and Mann-Whitney U test were used to assess the differences of CR and PR groups. Then, two-way repeated-measures ANOVA and post hoc test were used to compare the variances between CCRT group and CCRT plus Endostar group before treatment, third week and fifth week, as well as between CR group and PR group. The curative effect of LACC was predicted by the ROC curve of the three measurement methods above. Kendall's Tau-b correlation analysis was used to compare the correlation between treatment regimen and efficacy of LACC. p<0.05 was considered statistical significance.Results
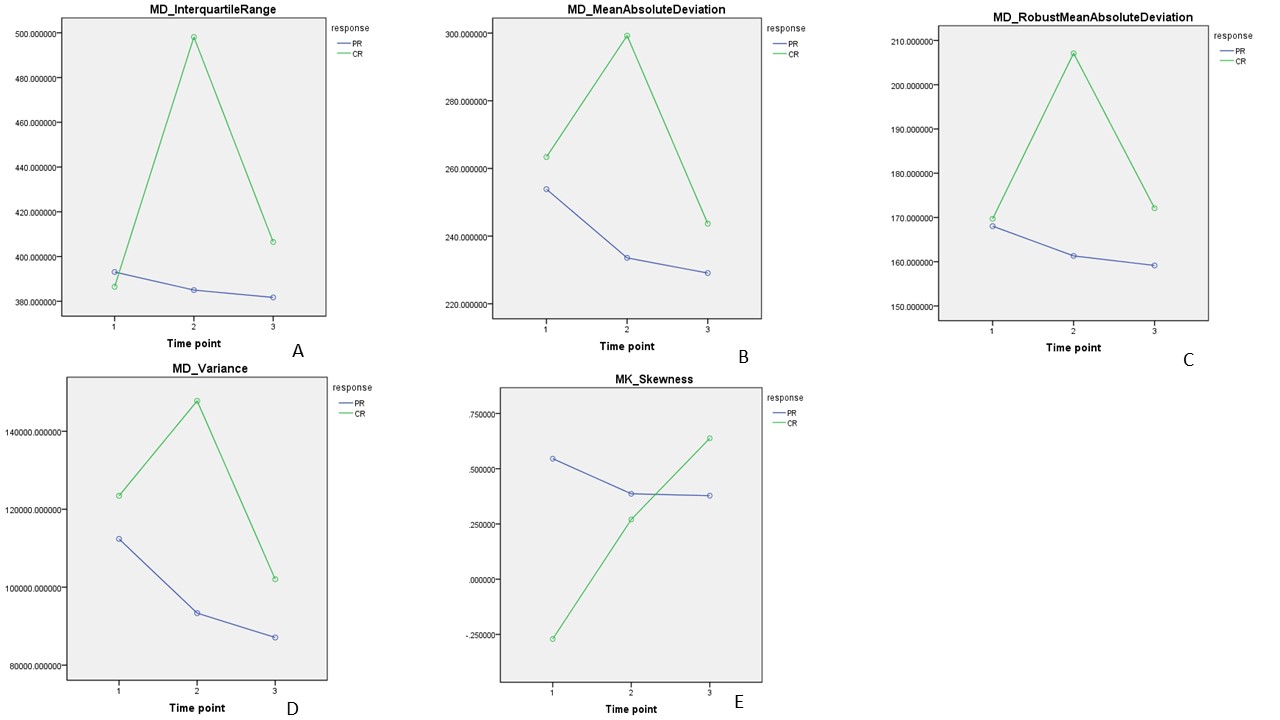
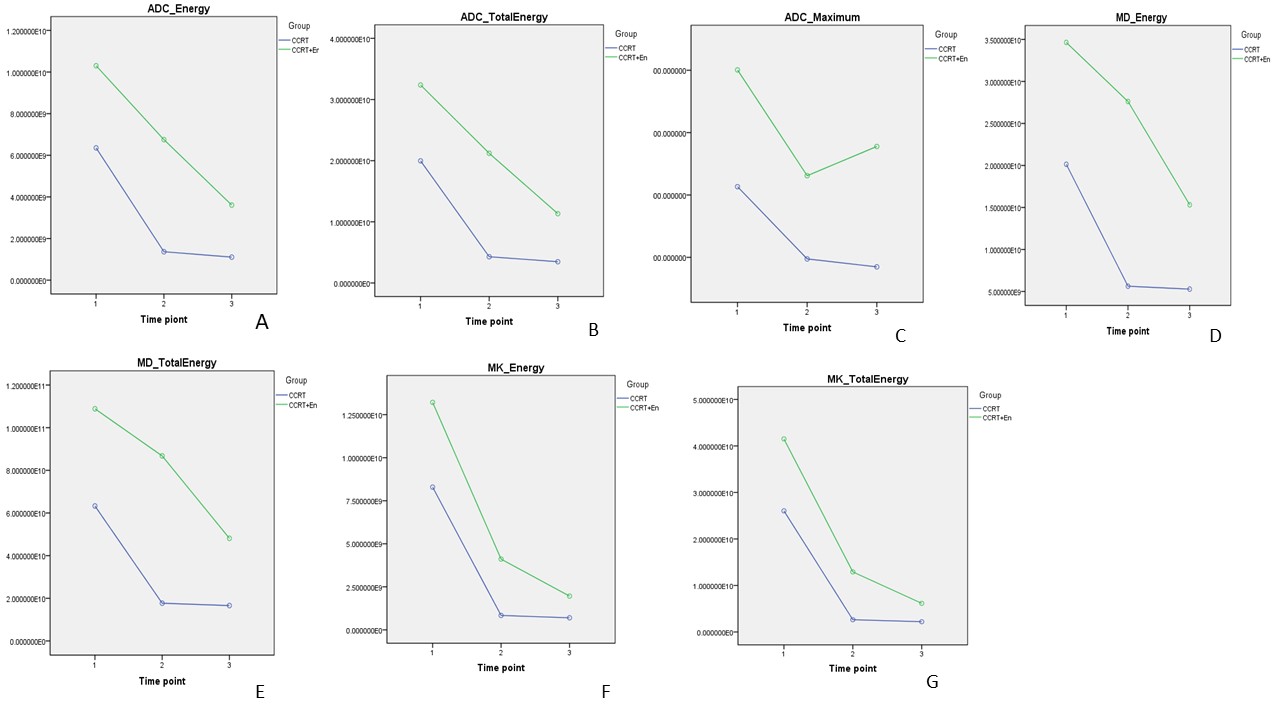
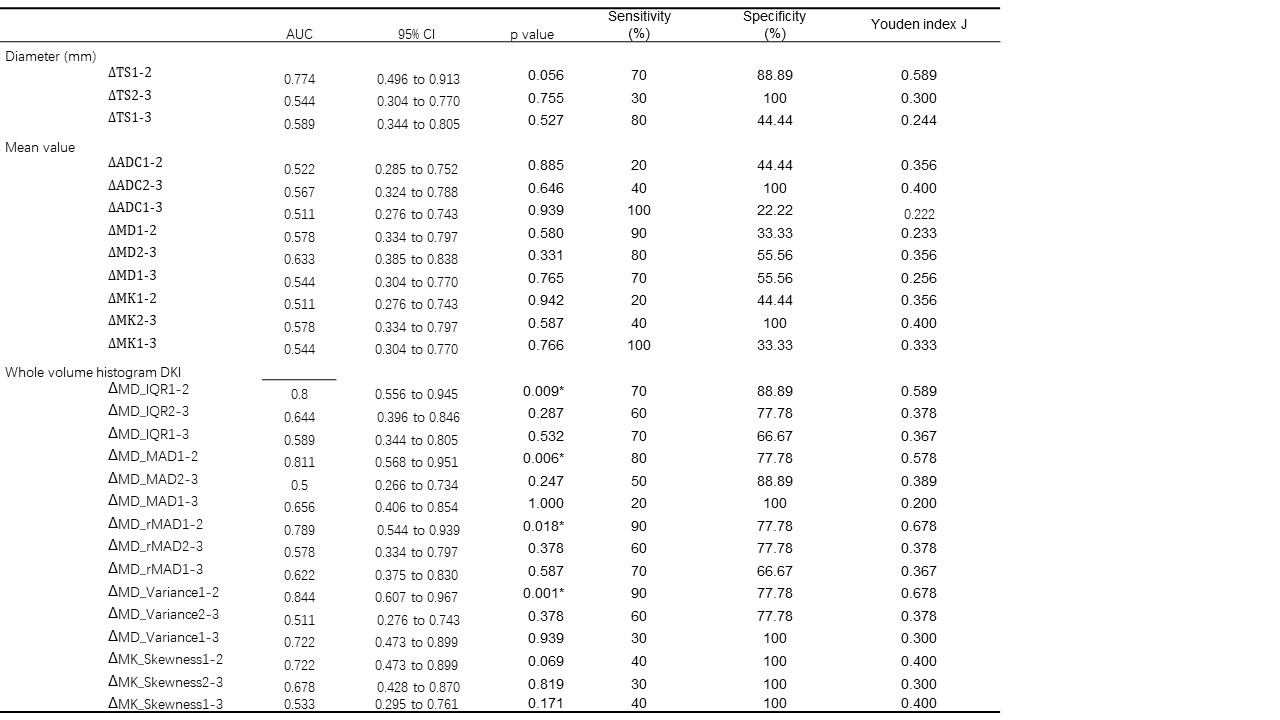
We observed significant differences of whole tumor DKI histogram analysis, tumor size, ADC, MD, and MK mean values before and at third and fifth weeks after LACC treatment (P < 0.05). However, only interquartile range (IQR), mean absolute deviation (MAD), robust mean absolute deviation (rMAD), and variance in MD maps from DKI simultaneously monitored LACC treatment response and predicted its curative effect (Figure 2). We found that the variance in MD maps had the highest area under the curve (0.844; 95% CI = 0.607 to 0.967), variance and rMAD in MD maps had higher sensitivity (both 90.00%), and the rMAD in MD maps had the highest specificity (88.89%), when CCRT combined with Endostar group compared with the CCRT group. We also observed that energy, total energy in ADC, MD, and MK map, and the maximum value in ADC map can reflect the differences between the CCRT group and the CCRT combined with Endostar group during treatment (Figure 3). Moreover, when the receiver operating characteristics curve was used to predict the changes of the above variables at every two-time points, the prediction effect of the change between the baseline and the third week was the highest (Table 1).Discussion & Conclusion
In this study, different evaluation methods (diameter, mean values, and whole tumor HA of parameter maps) were used to evaluate the efficacy of CCRT group and CCRT plus Endostar group (before treatment, third week, and fifth week during treatment), and were compared their predictive abilities. Our results showed that the treatment regimen with Endostar is more effective in patients with LACC. Our study confirmed that the whole tumor histogram analysis, that is, the IQR, MAD, rMAD, variance of the MD maps obtained from the DKI sequence, is helpful to evaluate the response to CCRT plus Endostar in the LACC. The histogram analysis of the whole tumor can not only reflect the biological heterogeneity of the whole tumor before and during treatment but also quantify the changes of tumor tissues. We showed that the whole tumor histogram parameters are of predictive significance in evaluating the CCRT plus Endostar response. Interestingly, our results showed that the most accurate time point for predicting efficacy is the third week during CCRT plus Endostar treatment when the tumor microenvironment changes most.During LACC treatment with CCRT plus Endostar, DKI whole tumor HA showed excellent potential in monitoring treatment response and predicting early efficacy, but the mean values of ADC, MD, MK, and tumor diameter had no significant predictive effect. The third week of treatment was the best time to predict the curative effect.
Acknowledgements
We sincerely thank the participants in this study.References
1. Enkhbaatar NE, Inoue S, Yamamuro H, Kawada S, Miyaoka M, Nakamura N, et al. MR Imaging with Apparent Diffusion Coefficient Histogram Analysis: Evaluation of Locally Advanced Rectal Cancer after Chemotherapy and Radiation Therapy. Radiology. 2018; 288: 129-37.
2. Tu N, Zhong Y, Wang X, Xing F, Chen L, Wu G. Treatment Response Prediction of Nasopharyngeal Carcinoma Based on Histogram Analysis of Diffusional Kurtosis Imaging. AJNR Am J Neuroradiol. 2019; 40: 326-33.
3. Zhao B, Cao K, Li XT, Zhu HT, Sun YS. Whole lesion histogram analysis of apparent diffusion coefficients on MRI predicts disease-free survival in locally advanced squamous cell cervical cancer after radical chemo-radiotherapy. BMC Cancer. 2019; 19: 1115.
Figures