3142
The value of Combining ADC value with Texture Analysis to Preoperatively Predict the Expression Levels of Ki-67 and p53 of Endometrial Carcinoma1Anhui Provincial Cancer Hospital, Hefei, Anhui, hefei, China
Synopsis
In conclusion, a combination of ADC values and TA based on three MRI sequences was developed to provide a noninvasive method for preoperatively predicting the expression levels of Ki-67 and p53 in EC. To some extent, this noninvasive imaging marker can compensate for the limitation of endometrium curettage biopsy and adverse impact of tumor heterogeneity, and it provide an objective imaging basis for clinical and accurate individualized treatment.
To evaluate the value of apparent diffusion coefficient (ADC) value combined with texture analysis (TA) in preoperatively predicting the expression levels of Ki-67 and p53 in endometrial carcinoma (EC) patients.
Introduction: Endometrial carcinoma (EC) is one of the most common malignancies of the female reproductive system wordwide1, and the morbidity and mortality of EC have been rising with a trend towards a younger age2. It has been suggested that the occurrence and development of EC are related not only to estrogen levels but also to the proliferation and apoptosis of tumor cells3. A necessary condition for normal functioning of the body is to maintain the dynamic balance between cell proliferation and apoptosis4-5. If this balance is broken, it will promote the occurrence of tumors. Ki-67 and p53 are closely related to the proliferation and apoptosis of tumor cells. Ki-67 is a marker of cell proliferation, is mainly expressed in the nucleus of proliferating cells, and is used to evaluate the proliferation state of tumor cells6. Higher values of Ki-67 indicate increased malignancy and invasiveness of tumours7. p53 is an important tumor suppressor gene that controls the initiation of the cell cycle, regulates cell division, inhibits cell growth, regulates transcription, and induces apoptosis8.DWI determines the cell density of tissues by detecting the diffusion of water molecules and quantifying it by using the ADC value9. It has been shown10 that the ADC mean value is related to the expression level of Ki-67 and p53 in esophageal squamous cell carcinoma, which can be used as a noninvasive biological indicator to predict the proliferation of esophageal squamous cell carcinoma cells and to determine the prognosis of patients. TA is a method to quantitatively measure the distribution and (or) relationship between histogram, pixel intensity or grey level of an image in the region of interest11-12. TA highlights subtle patterns of tissue distribution (texture features) that cannot be recognized by human eyes and extends the intrinsic value of images. Thus, in recent years, TA has been used with various cross-sectional imaging modalities and shows clinical applicability in the detection, diagnosis, prognosis, characterization and response evaluation of different cancers13-15. In the present study, five models were developed to preoperatively predict the expression levels of Ki-67 and p53 in EC. The purpose of this study was to noninvasively evaluate the expression levels of Ki-67 and p53 in EC and to provide imaging markers for the clinical diagnosis and treatment of EC.
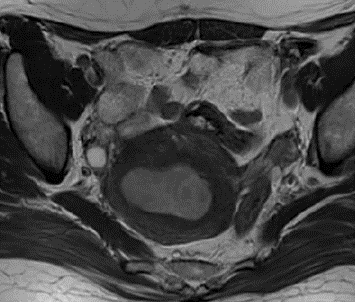
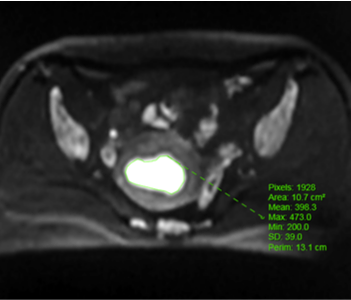
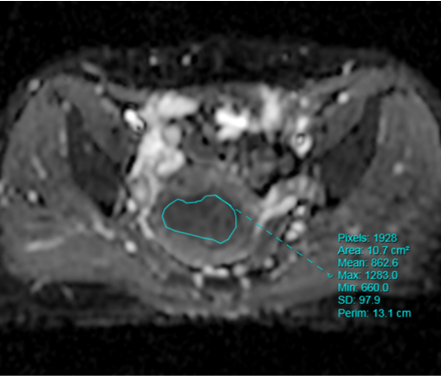
Methods: Clinical, pathological and MRI findings of 110 EC patients were analyzed retrospectively. The expression levels of Ki-67 and p53 in EC tissues was detected by immunohistochemistry. ADC value was calculated, and three-dimensional (3D) texture features were measured on T2-weighted images (T2WI), diffusion-weighted images (DWI), and contrast-enhanced T1-weighted images (CE-T1WI). The univariate and multivariate logistic regression and cross-validations were used for the selection of texture features. The receiver operating characteristic (ROC) curve was performed to estimate the diagnostic efficiency of prediction model by the area under the curve (AUC) in the training and validation cohorts.
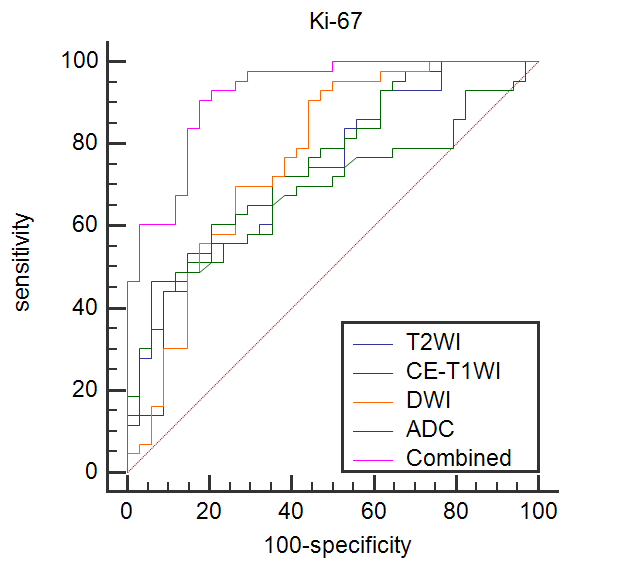
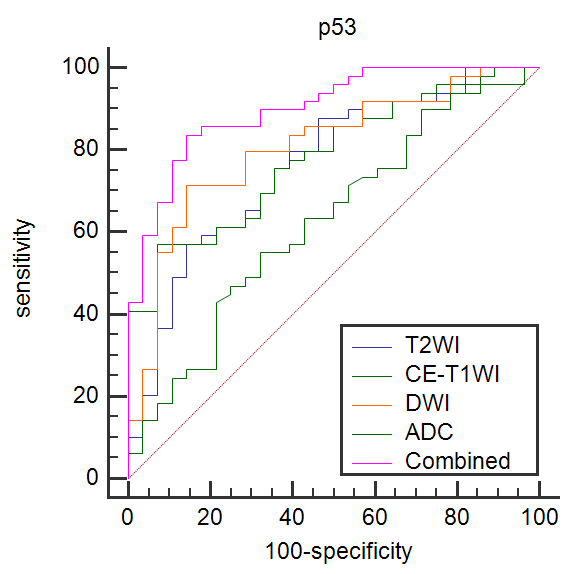
Results: Significant differences of the ADC values were found in predicting Ki-67 and p53 (P=0.039, P=0.007). The AUC of the ADC value in predicting the expression levels of Ki-67 and p53 were 0.698, 0.853 and 0.626, 0.702 in the training and validation cohorts. The AUC of the TA model based on T2WI, DWI, CE-T1WI, and ADC value combined with T2WI + DWI + CE-T1WI in the training and validation cohorts for predicting the expression of Ki-67 were 0.741, 0.765, 0.733, 0.922 and 0.688, 0.691, 0.651, 0.938, respectively, and for predicting the expression of p53 were 0.763, 0.805, 0.781, 0.901 and 0.796, 0.713, 0.657, 0.922, respectively.
Conclusion: ADC values combined with TA are beneficial for predicting the expression levels of Ki-67 and p53 in EC patients before surgery, and they provide higher auxiliary diagnostic values for clinical application.
Acknowledgements
We are grateful to the technical assistance provided by United Imaging Healthcare. We thank all patients who participated in this study and all staff involved in the working process of this study.References
1.Sung H, Ferlay J, Siegel RL, et al. Global Cancer Statistics 2020: GLOBOCAN Estimates of Incidence and Mortality Worldwide for 36 Cancers in 185 Countries. CA Cancer J Clin. 2021;71(3):209-249. doi:10.3322/caac.216602.
2.Henley SJ, Ward EM, Scott S, et al. Annual report to the nation on the status of cancer, part I: National cancer statistics. Cancer. 2020;126(10):2225-2249. doi:10.1002/cncr.328023.
3.Ito K, Sasano H, Yabuki N, et al. Immunohistochemical study of Ki-67 and DNA topoisomerase II in human endometrium. Mod Pathol. 1997;10(4):289-294.4.
4.Liu Y, Du FY, Chen W, et al. G15 sensitizes epithelial breast cancer cells to doxorubicin by preventing epithelial-mesenchymal transition through inhibition of GPR30. Am J Transl Res. 2015;7(5):967-975. Published 2015 May 15.5.
5.Koi C, Hachisuga T, Murakami M, et al. Overexpression of p53 in the endometrial gland in postmenopausal women. Menopause. 2015;22(1):104-107. doi:10.1097/GME.00000000000002656.
6.Li LT, Jiang G, Chen Q, et al. Ki67 is a promising molecular target in the diagnosis of cancer (review). Mol Med Rep. 2015;11(3):1566-1572. doi:10.3892/mmr.2014.29147.
7.Xu Q, Chen C, Liu B, et al. Association of iRhom1 and iRhom2 expression with prognosis in patients with cervical cancer and possible signaling pathways. Oncol Rep. 2020;43(1):41-54. doi:10.3892/or.2019.73898.
8.Awais R, Spiller DG, White MR, et al. p63 is required beside p53 for PERP-mediated apoptosis in uveal melanoma. Br J Cancer. 2016;115(8):983-992. doi:10.1038/bjc.2016.2699.
9.Koh DM, Collins DJ. Diffusion-weighted MRI in the body: applications and challenges in oncology. AJR Am J Roentgenol. 2007;188(6):1622-1635. doi:10.2214/AJR.06.140310.
10.Wang Y, Bai G, Zhang X, et al. Correlation analysis of apparent diffusion coefficient value and P53 and Ki-67 expression in esophageal squamous cell carcinoma. Magn Reson Imaging. 2020;68:183-189. doi:10.1016/j.mri.2020.01.01111.
11.Varghese BA, Cen SY, Hwang DH, et al. Texture Analysis of Imaging: What Radiologists Need to Know. AJR Am J Roentgenol. 2019;212(3):520-528. doi:10.2214/AJR.18.2062412.
12.Lubner MG, Smith AD, Sandrasegaran K, et al. CT Texture Analysis: Definitions, Applications, Biologic Correlates, and Challenges. Radiographics. 2017;37(5):1483-1503. doi:10.1148/rg.201717005613.
13.Davnall F, Yip CS, Ljungqvist G, et al. Assessment of tumor heterogeneity: an emerging imaging tool for clinical practice? Insights Imaging. 2012;3(6):573-589. doi:10.1007/s13244-012-0196-614.
14.De Cecco CN, Ganeshan B, Ciolina M, et al. Texture analysis as imaging biomarker of tumoral response to neoadjuvant chemoradiotherapy in rectal cancer patients studied with 3-T magnetic resonance. Invest Radiol. 2015;50(4):239-245. doi:10.1097/RLI.000000000000011615.
15.Choi MH, Lee YJ, Yoon SB, et al. MRI of pancreatic ductal adenocarcinoma: texture analysis of T2-weighted images for predicting long-term outcome. Abdom Radiol (NY). 2019;44(1):122-130. doi:10.1007/s00261-018-1681-2
Figures