3140
Predicting the risk grades of thymic epithelial tumors using magnetic resonance T1 mapping and diffusion weighted imaging: a pilot study1Tangdu Hospital, Air Force Medical University, Xi'an, China, 2Shaanxi University of Traditional Chinese Medicine, Xi'an, China, 3GE Healthcare, Beijing, China
Synopsis
The pathological staging system of Thymic epithelial tumors (TETs) which called Masaoka staging, is an important prognostic factor, and its impact on survival is much greater than that of WHO classification. However, as the Masaoka stage can only be established postoperatively, preoperative imaging has important implications concerning treatment strategy. This study analyzes the differences of T1 values and ADC values in different regions, different types and stages of TETs tumors, and establishes a reliable noninvasive imaging technology to distinguish the risk classification and stage of tumors.
Abstract
Target audience Radiologist: surgeon and clinicians interested in thymic tumor.Introduction Thymic epithelial tumors (TETs) include a heterogeneous group of tumors ranging from nearly benign thymomas to aggressive thymic carcinomas. The pathological staging system based on intraoperative findings, including the invasiveness of tumor capsule, invasion of surrounding tissues and organs, and distant metastasis, called Masaoka staging, is an important prognostic factor, and its impact on survival is much greater than that of WHO classification1,2. However, as the Masaoka stage can only be established postoperatively, preoperative imaging has important implications concerning treatment strategy. Preoperative imaging provides a comprehensive view of the entire tumor and its surroundings, and a greater degree of information may be derived by the employment of new diagnostic imaging tools for the assessment of the tumors. Recent studies have shown that collagen fibers play an important role in the development and progress of TETS, and different collagen fiber bands are closely related to the staging and prognosis of thymoma3. However, whether quantitative collagen fibers can accurately distinguish the risk classification and staging of TETS is unknown. T1 mapping is an emerging concept for quantitative tissue characterization, evaluating the longitudinal relaxation time (T1) in each image voxel and thus providing unique quantifiable and reproducible intrinsic tissue values4. In the kidney, T1 mapping can differentiate the cortex and medulla in the normal renal parenchyma, and the T1 relaxation time has been shown to be a reliable marker of injury and can potentially identify pathological changes, including edema, inflammation, and fibrosis5. This study analyzes the differences of T1 values and ADC values in different regions, different types and stages of TETs tumors, and establishes a reliable noninvasive imaging technology to distinguish the risk classification and stage of tumors, which is helpful to improve the diagnostic accuracy and provide the best individual treatment for patients.
Method This single-center retrospective study was approved by the Ethics Committee of Tangdu Hospital of the Fourth Military Medical University, and informed consent was waived. Forty-nine patients with TETs confirmed by the pathological analysis were included in this study. All preoperative MRI examinations were performed using a 3.0-T whole-body system (MR750, GE Healthcare, Milwaukee, WI) with a 40-mT/m maximum gradient capability and a standard 8-channel torso coil. The MR protocol included respiratory triggering T1-weighted spin-echo in the axial plane, T2-weighted fast spin echo in the axial and coronal planes, and axial fat-suppressed T2-weighted turbo spin-echo images (FS-T2WI). Subsequently, DWI sequences (b = 1000 s/mm2) were performed with a single-shot diffusion-weighted spin-echo echo-planar sequence. In addition, we received native and respiratory gated steady-state precession readout single-shot Modified Look-Locker Inversion Recovery (MOLLI) sequences in axial planes of the tumors. The native T1 and ADC values were compared for differences among low-risk thymomas (LRT), high-risk thymomas (HRT), and thymic carcinomas (TC) and for differences between early and advanced stage TETs based on one-way ANOVA and independent sample t-test, respectively. Receiver operating characteristic curve (ROC) analyses were performed to determine optimum thresholds for differentiating the defined subtypes or stages by native T1 and apparent diffusion coefficient (ADC) values, and also to calculate the sensitivity, specificity, and area under the curve (AUC).
Results According to the WHO pathological classification, 26 (53.1%) patients had LRT (4 had types A thymoma, 16 had types AB thymoma, and 6 had types B1 thymoma), 7 (14.3%) had HRT (6 had types B1 thymoma and 1 had types B3 thymoma) and 14 (28.6%) had TC. As shown in Table 1 and Figure 1, the native T1 and ADC values in thymoma were significantly higher than the values from TC (all P < 0.01), while there were no significant differences between the LRT and HRT (P﹥0.05). Also, in the early stage, values were significantly higher than ones in the advanced stage of TETs (P < 0.01). The correlation diagram between native T1 value and ADC values of TETs shows a positive correlation (Figure 2). Based on the ROC analyses, the native T1 value achieved the higher diagnostic efficacy in differentiating thymoma from TC, with an AUC of 0.831, the sensitivity and specificity were 53.3% and 100.0%, respectively. For differentiating early from advanced stages of TETs, ADC value achieved the higher diagnostic efficacy with an AUC of 0.829. Furthermore, a combination of native T1 and ADC achieved the higher differentiating ability for differentiating both the defined simplified subtype and stage of TETs (Figure 3).
Discussion In this study, we evaluated the significance of native T1 and apparent diffusion coefficient (ADC) values in differentiating the defined groups of thymic epithelial tumors (TETs) based on the WHO classification and Masaoka-Koga stage. Our study obtained a good performance in differentiating these groups. Conclusion Combination of native T1 and ADC values improved the differentiating ability of TET grades, which could potentially be useful in clinical practice regarding the TET evaluation before treatment.
Acknowledgements
We would like to thank Dr. Xiao-Cheng Wei in GE Healthcare China for providing technical support regarding the appropriate applied MRI sequence. This work was supported by the Science and Technology Innovation Development Foundation of Tangdu Hospital (No. 2017LCYJ004)
Our article didn't received funding for research from any of the following organizations: National Institutes of Health (NIH), Wellcome Trust, Howard Hughes Medical Institute (HHMI).
References
1. Thymic epithelial tumors: prognostic determinants among clinical, histopathologic, and computed tomography findings. 2. Ried M, Marx A, Götz A, Hamer O, Schalke B, Hofmann HS. State of the art: diagnostic tools and innovative therapies for treatment of advanced thymoma and tymic carcinoma. Eur J Cardiothorac Surg. 2016;49(6):1545-1552. 3. Minami K, Jimbo N, Tanaka Y, et al. Fibrous bands associated with higher Masaoka stage and poor recurrence-free survival in patients with thymoma. Thorac Cancer. 2021;12(3):349-356. 4. aylor AJ, Salerno M, Dharmakumar R, et al. T1 mapping: basic techniques and clinical applications. JACC Cardiovasc Imaging.2016;9:67–81. 5. Wang S, Li J, Zhu D, Hua T, Zhao B. Contrast-enhanced magnetic resonance (MR) T1 mapping with low-dose gadolinium-diethylenetriamine pentaacetic acid (Gd-DTPA) is promising in identifying clear cell renal cell carcinoma histopathological grade and differentiating fat-poor angiomyolipoma. Quant Imaging Med Surg 2020; 10:988-998.Figures

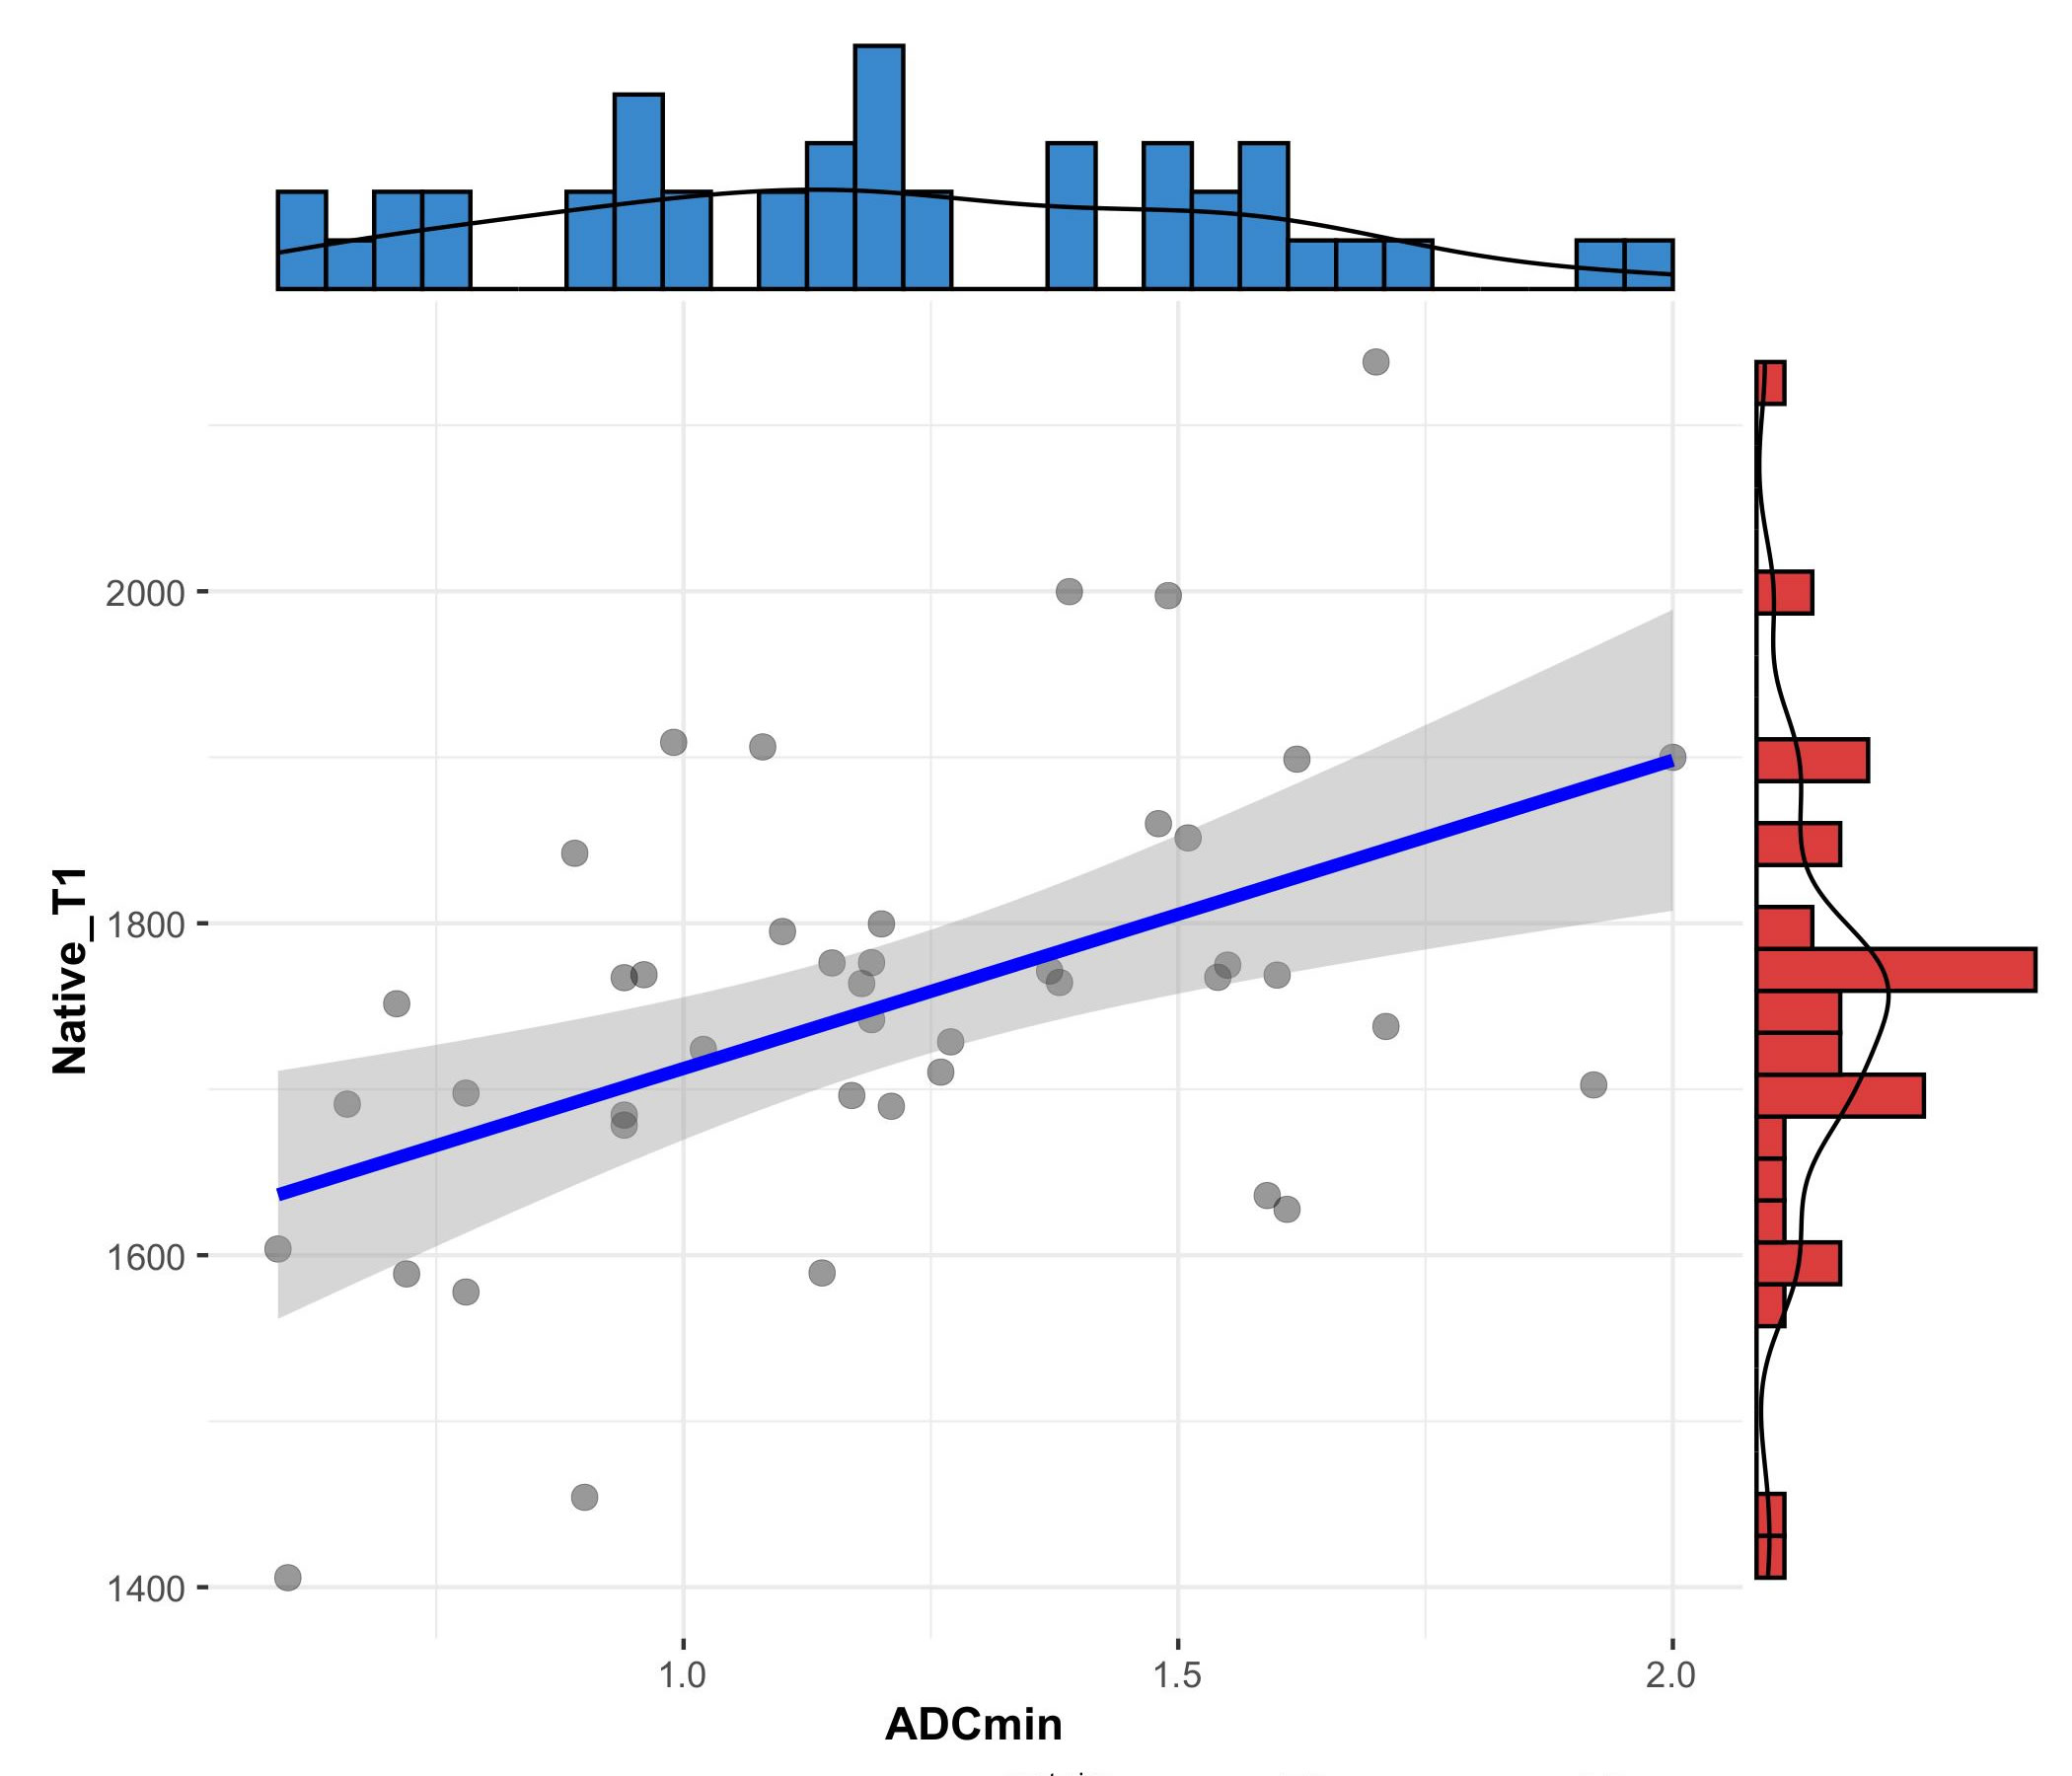
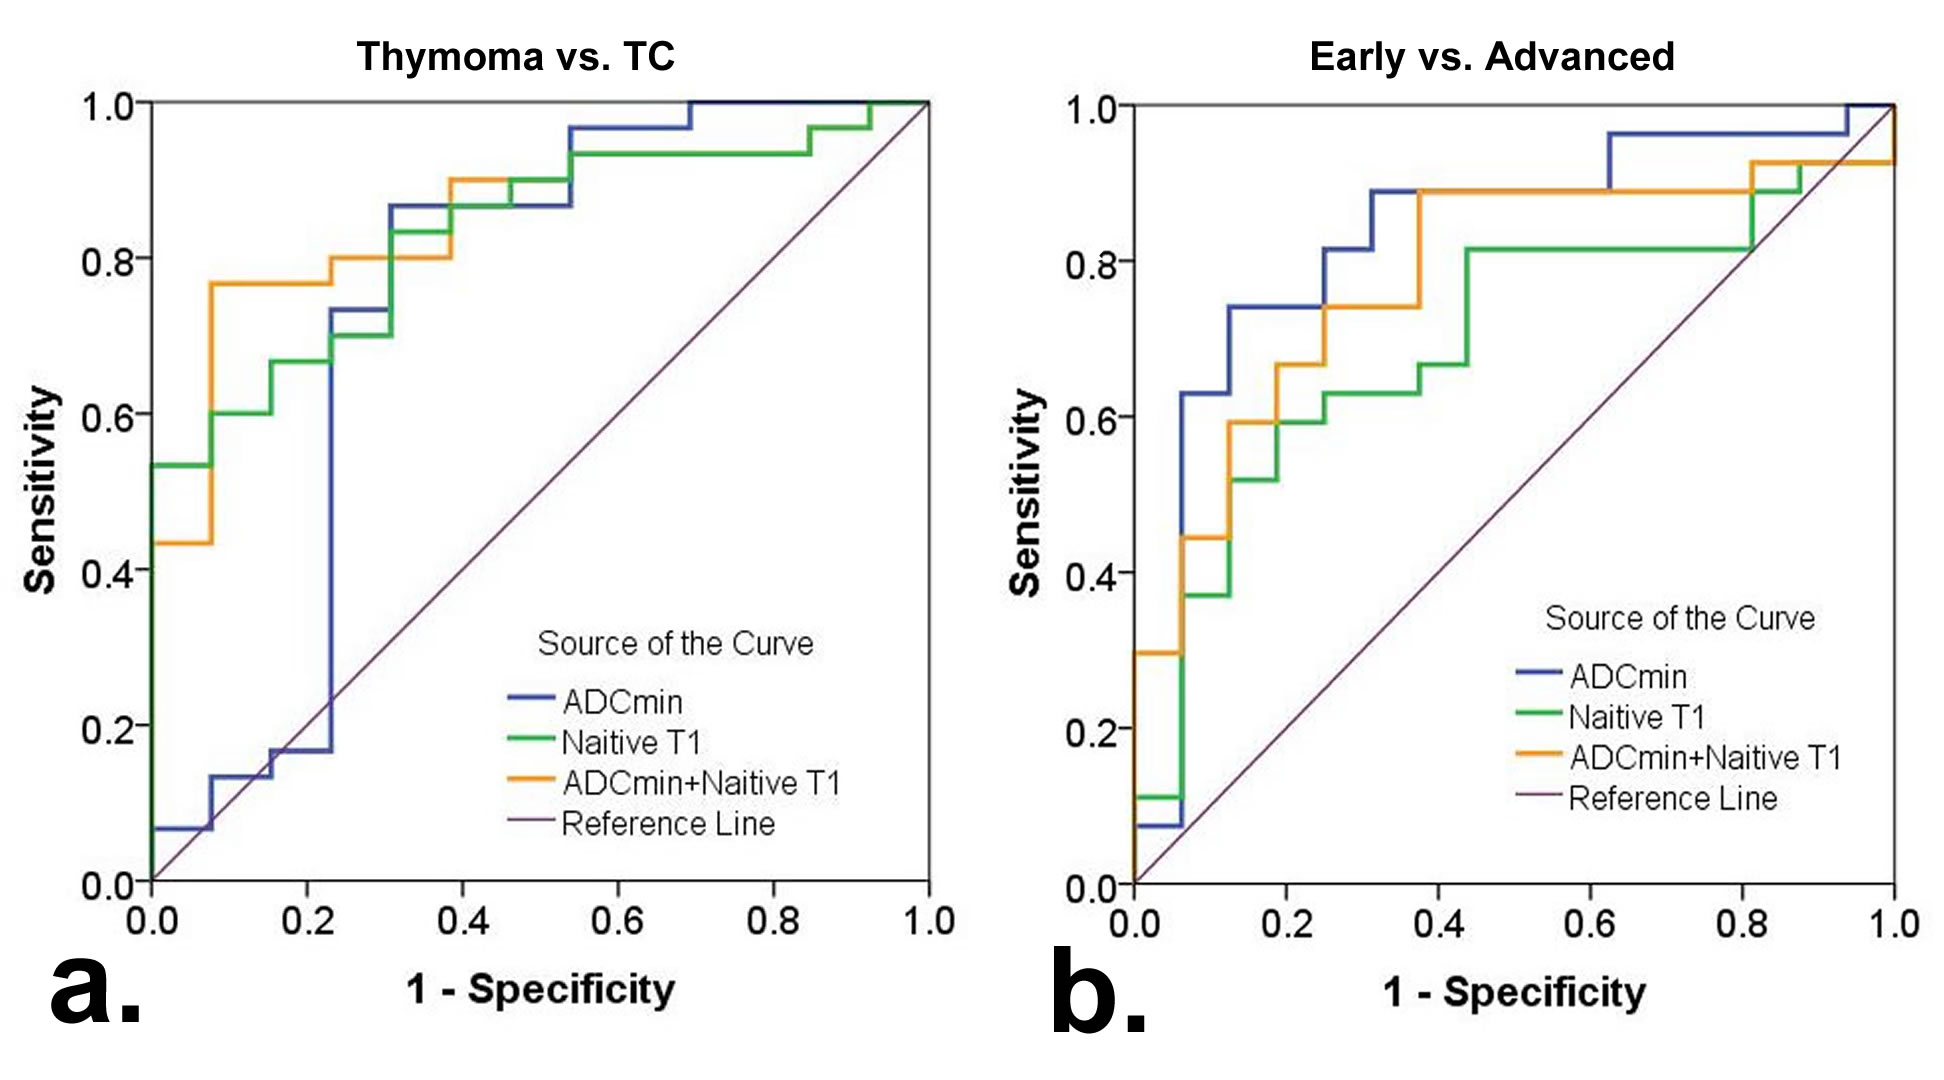
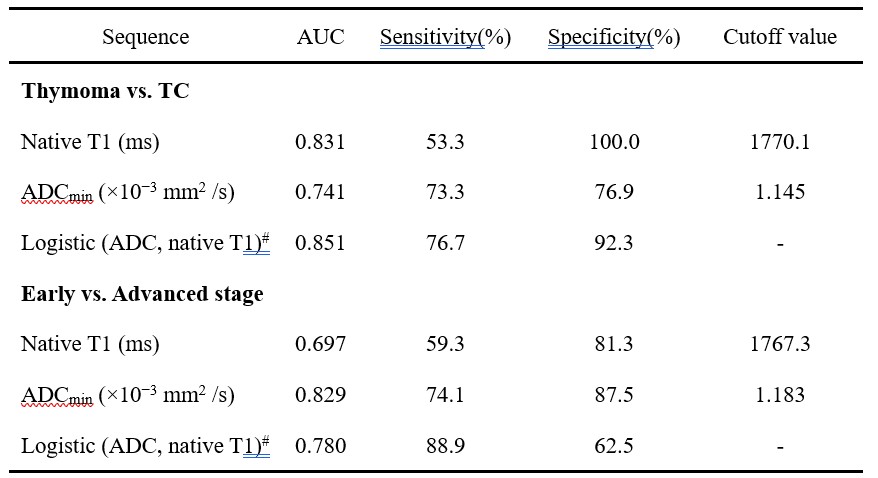
Table 1. Diagnostic efficacy comparisons of Native T1 and apparent diffusion coefficient (ADC) values in differentiating the defined groups of thymic epithelial tumors (TETs) based on the WHO classification and Masaoka-Koga stage
Note: #The result of Logistic(value 1, value 2) were acquired by using the group as dependent variable and using value 1 and value 2 as covariates to make a binary logistic regression and then acquired each patient's P value. This P value will be analyzed by ROC. AUC = area under curve; ADC = apparent diffusion coefficients