3139
Three-dimension Amide Proton Transfer Imaging for Predicting the Treatment Response of Nasopharyngeal Carcinoma1Department of Radiology, XiangYa Hospital, Central South University, Changsha, China, 2GE Healthcare, Beijing, China
Synopsis
To predict the treatment response for NPC patients is very important. This study aimed to explore the diagnostic performance of 3D APT imaging on predicting the treatment response of NPC patients. A total of 40 patients and 14 healthy volunteers were identified in this study. Result show that the APT and MT values have good and excellent intra- and inter-observer agreement. It is significant difference for MT values between residual and non-residual group. The result suggests that the pre-treatment MT values can be used to predict treatment response of NPC with chemoradiotherapy, and better than the APT and ADC value.
Introduction
The survival rate of patients with nasopharyngeal carcinoma (NPC) is improved for the widespread utilities of intensity-modulated radiotherapy and optimization of chemotherapy strategies [1]. However, locoregional recurrence and distant metastases respectively occurred in about 10-15% and 15-30% NPC patients [2, 3], which have negative effect on the survival rate and quality of life. An effective method to predict the treatment response for NPC patients is very essential for treatment decision-making. This study aimed to evaluate the reliability of a new three-dimensional (3D) Amide Proton Transfer (APT) technique, and further to explore the prediction performance on treatment response with chemoradiotherapy treatment (CRT) in NPC patients.Materials and methods
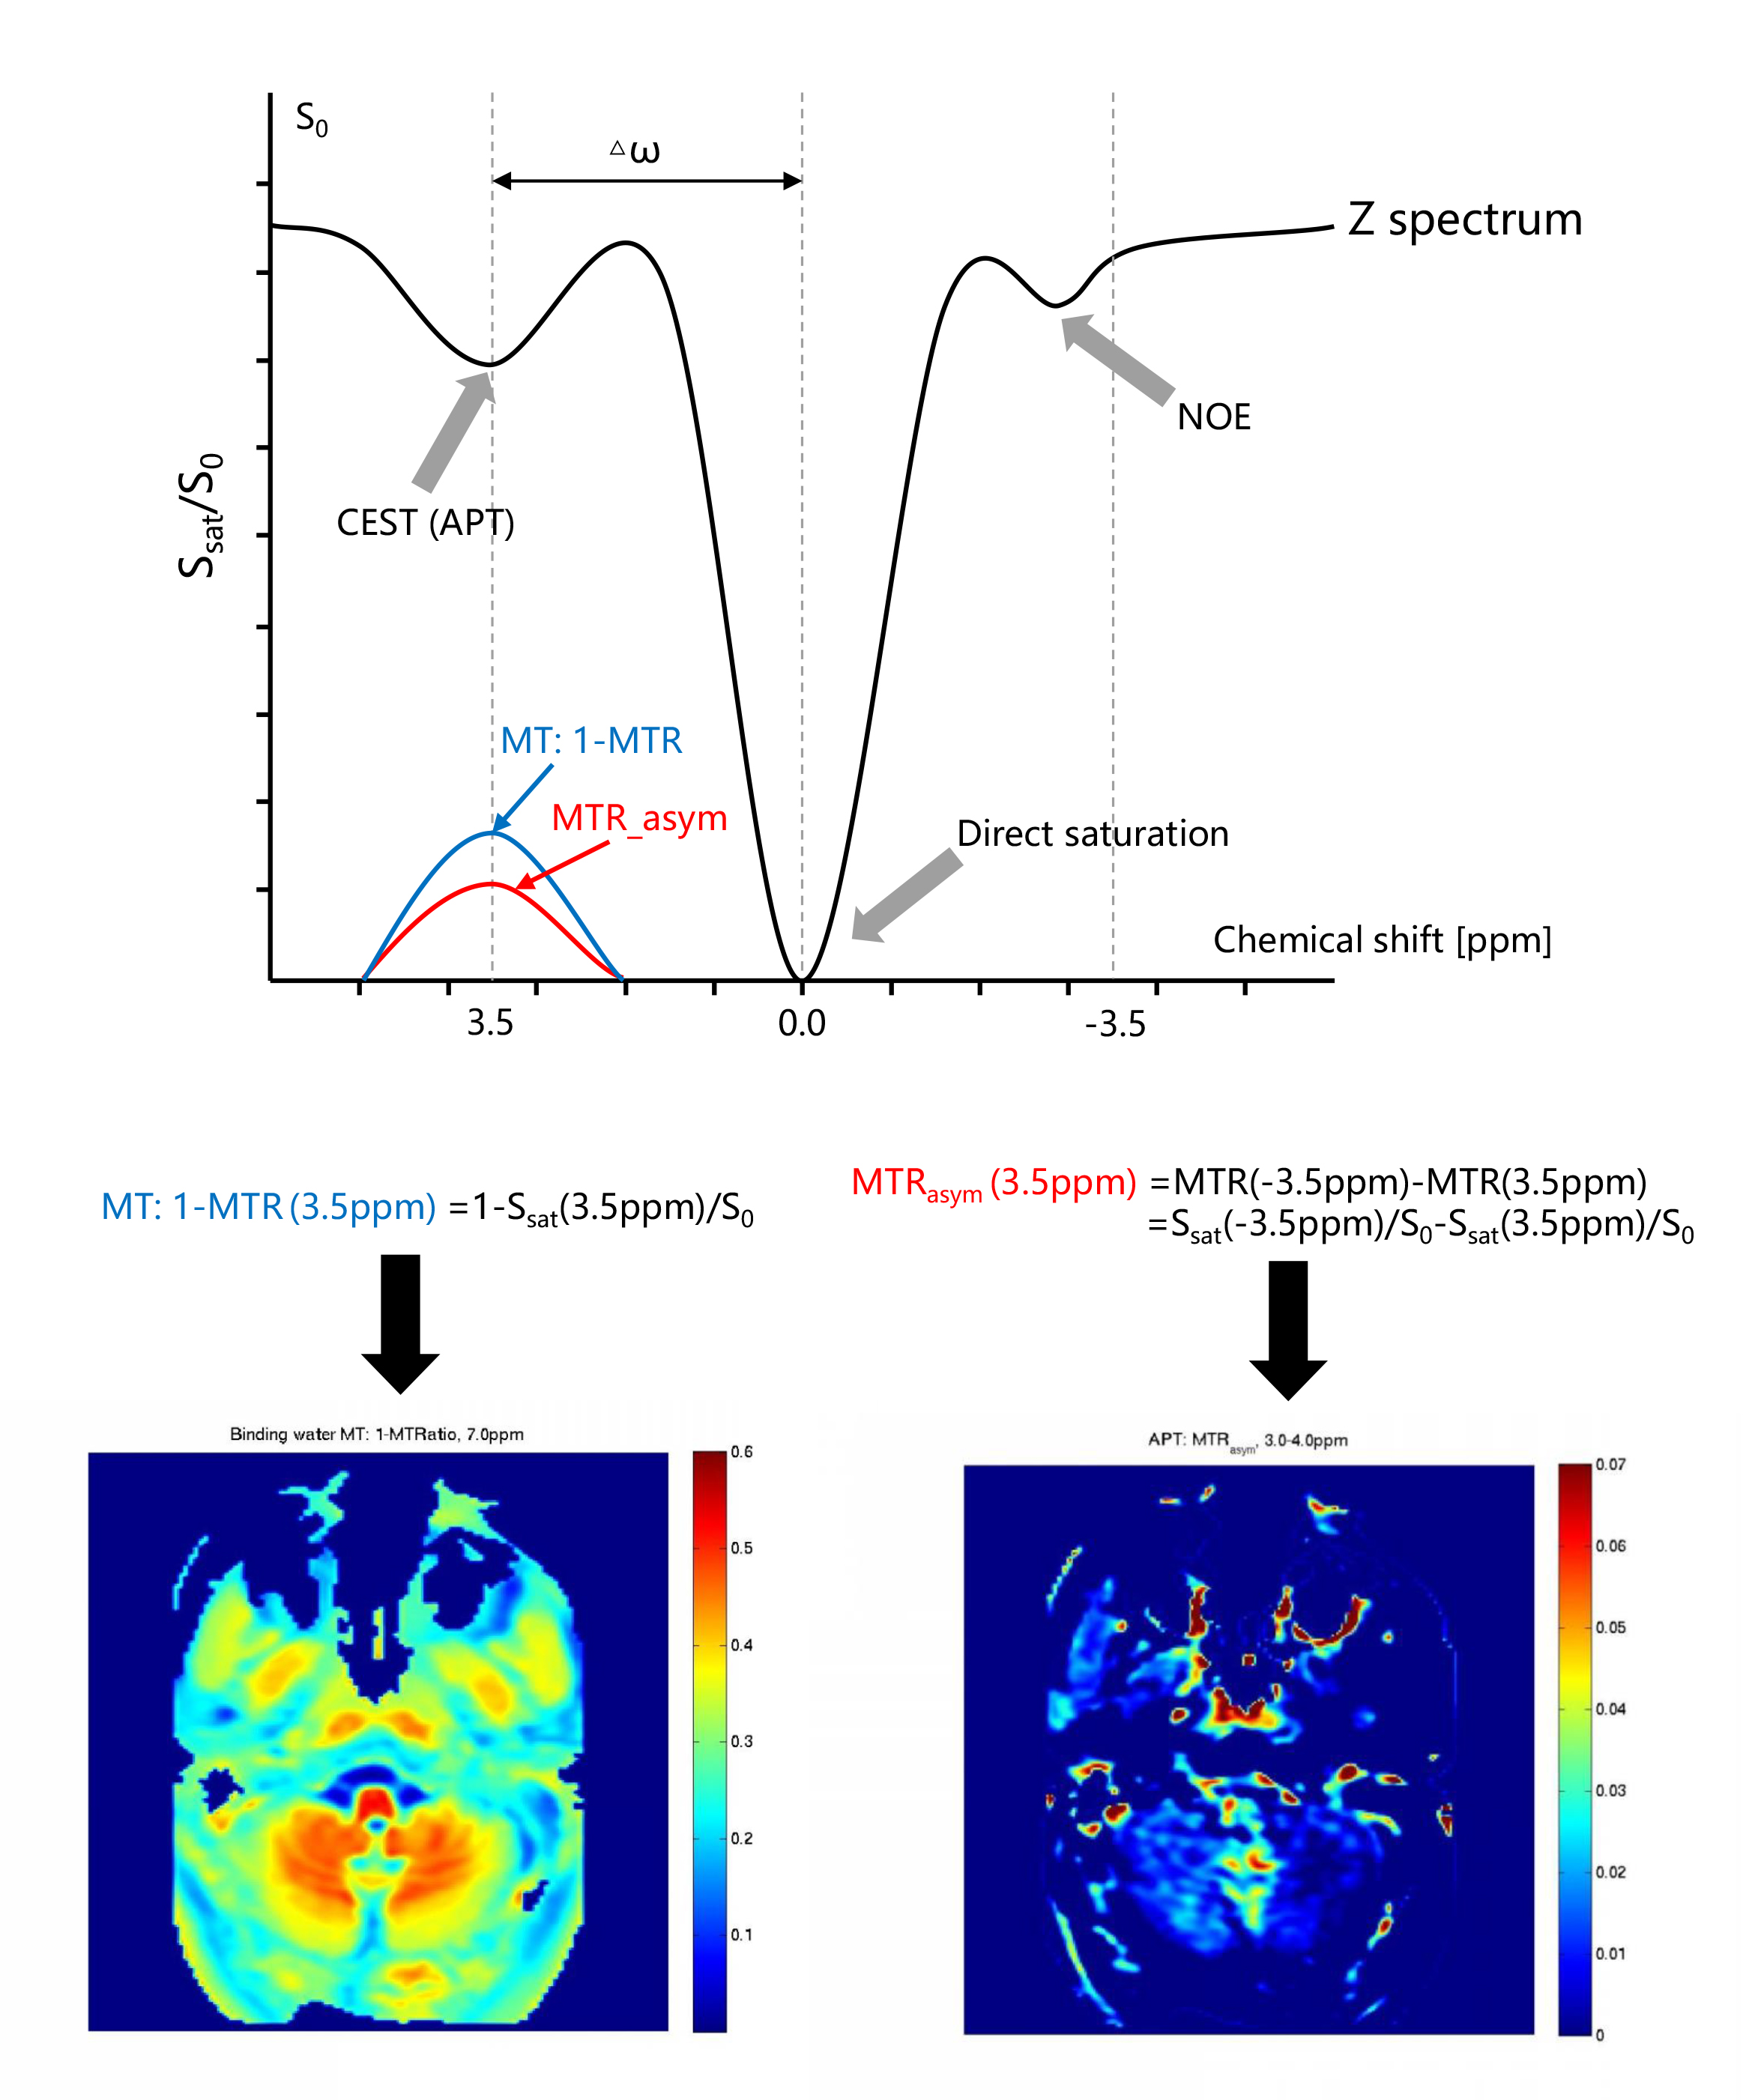
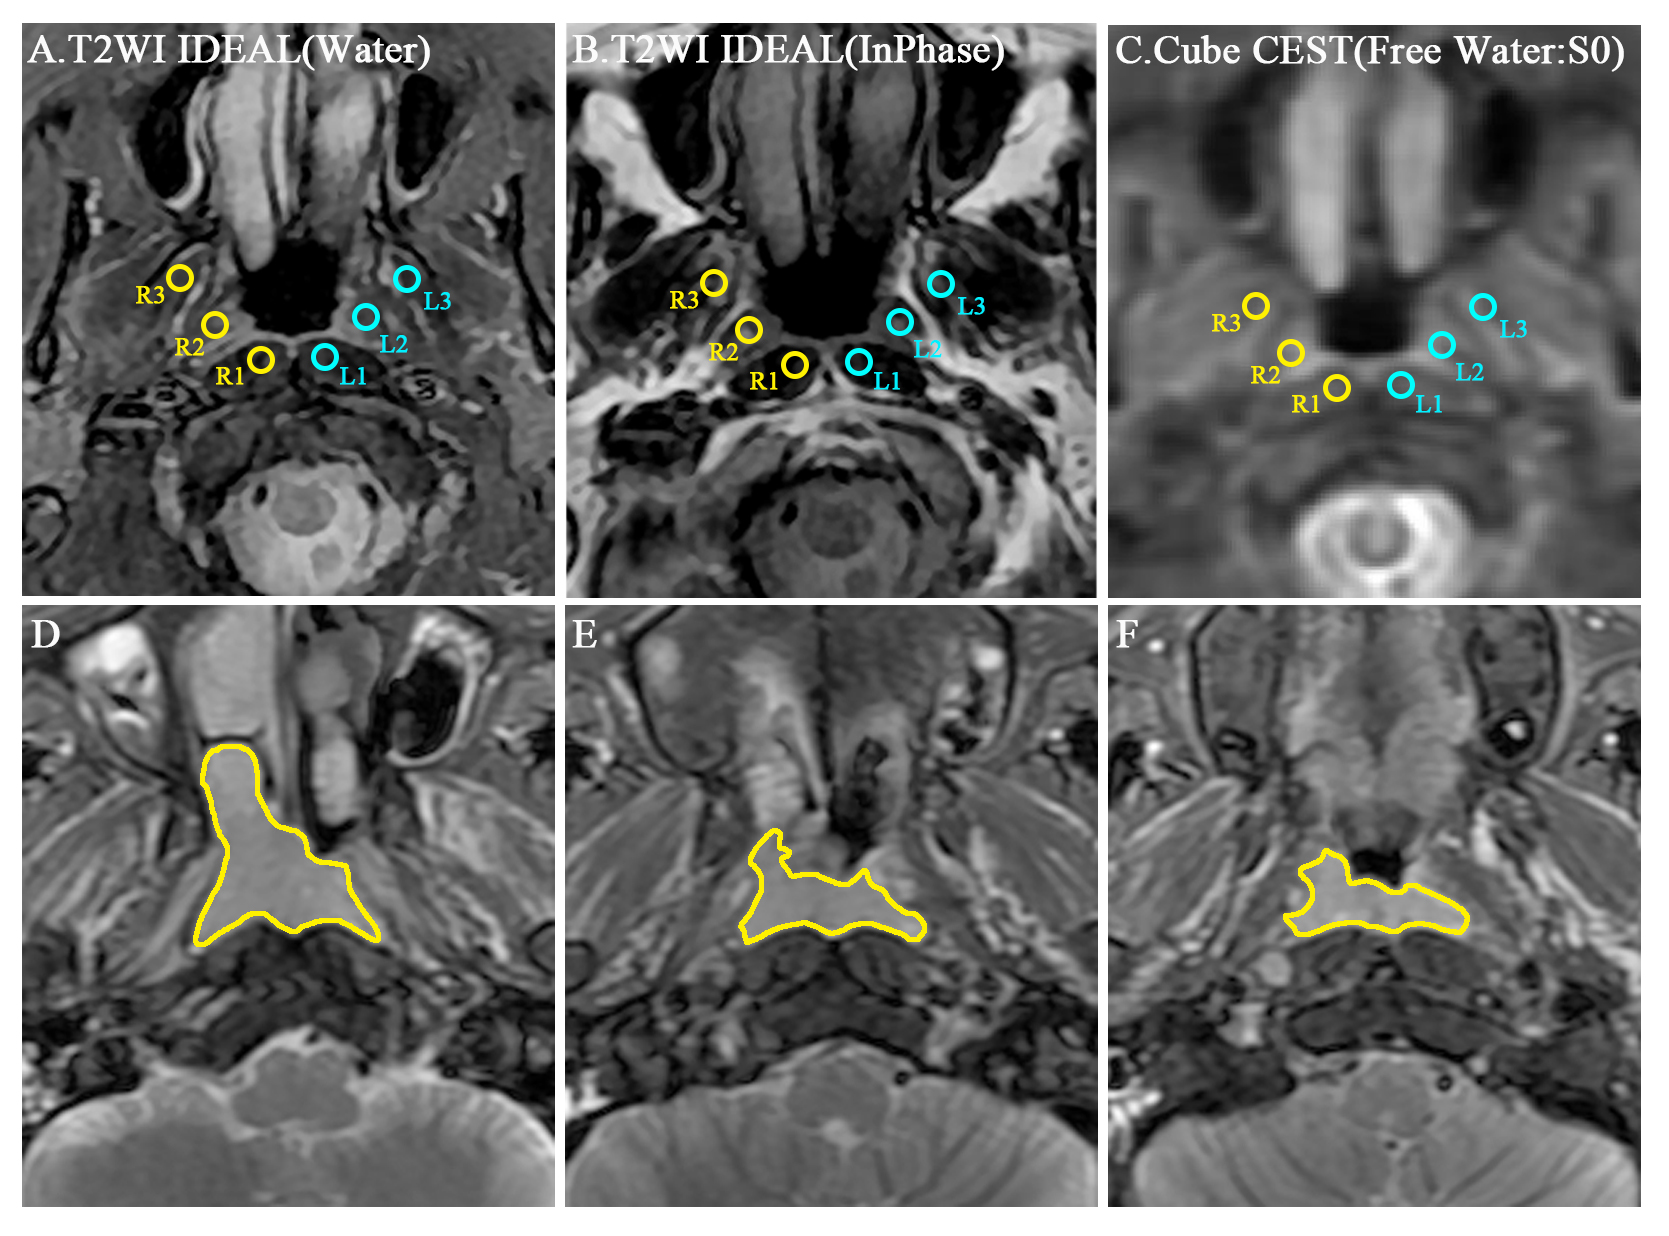
This prospective study was approved by the hospital ethics committee and informed signed consent was obtained from all patients and healthy volunteers. A total of 40 patients (mean age: 51.2 ±12.6 years, age range: 14-80 years) and 14 healthy volunteers (mean age: 52.2 ±10.3 years; age range: 27-74 years) were identified in our study. All NPC patients and healthy volunteers underwent pre-treatment MR examination including a three-dimensional Cube CEST, reduced field-of-view (rFOV) DWI and routine MR images on 3.0 T MR scanners (Discovery MR750w, GE Healthcare, USA) using 16 channels flex large array coil and 6 channels flex array coil. Axial APT images were acquired using a 3D fast spin echo with relative echo train lengths and ultrashort echo spacing and chemical exchange saturation transfer (Cube CEST) sequence (a single slab-selective 90° excitation pulse, readout in the right-left direction, repetition time/echo time = 3000/15 ms, field of view, 400 × 400 mm2, voxel size, 4 × 4× 8 mm3, ARC 2, 10 slices, echo train length 70, and partial Fourier factor, 0.75). The APT maps were quantified using the magnetization transfer ratio asymmetry (MTRasym) at 3.5 ppm with respect to the water resonance as the formula of MTRasym(3.5 ppm) = (S−3.5ppm−S3.5ppm)∕S0 with pixel-by-pixel B0 correction, where S−3.5ppm and S3.5ppm are the signal intensities at −3.5 and 3.5 ppm, respectively, and S0 is the unsaturated signal intensity (Figure1). Intraclass correlation coefficient (ICC) was used to assess intra-observer and inter-observer reliability of 3D APT in healthy subjects. For NPC patients, two kinds of region of interests (ROIs) (Single section ROI (SS-ROI) and whole tumor ROI(WT-ROI)) were manually drawn to measure APT and MT maps (Figure2) and then divided into residual and non-residual groups based on treatment response. The predicting performance would be analyzed by the area under the curve (AUC) for treatment response with SS-ROI and WT-ROIs.Results and Discussion
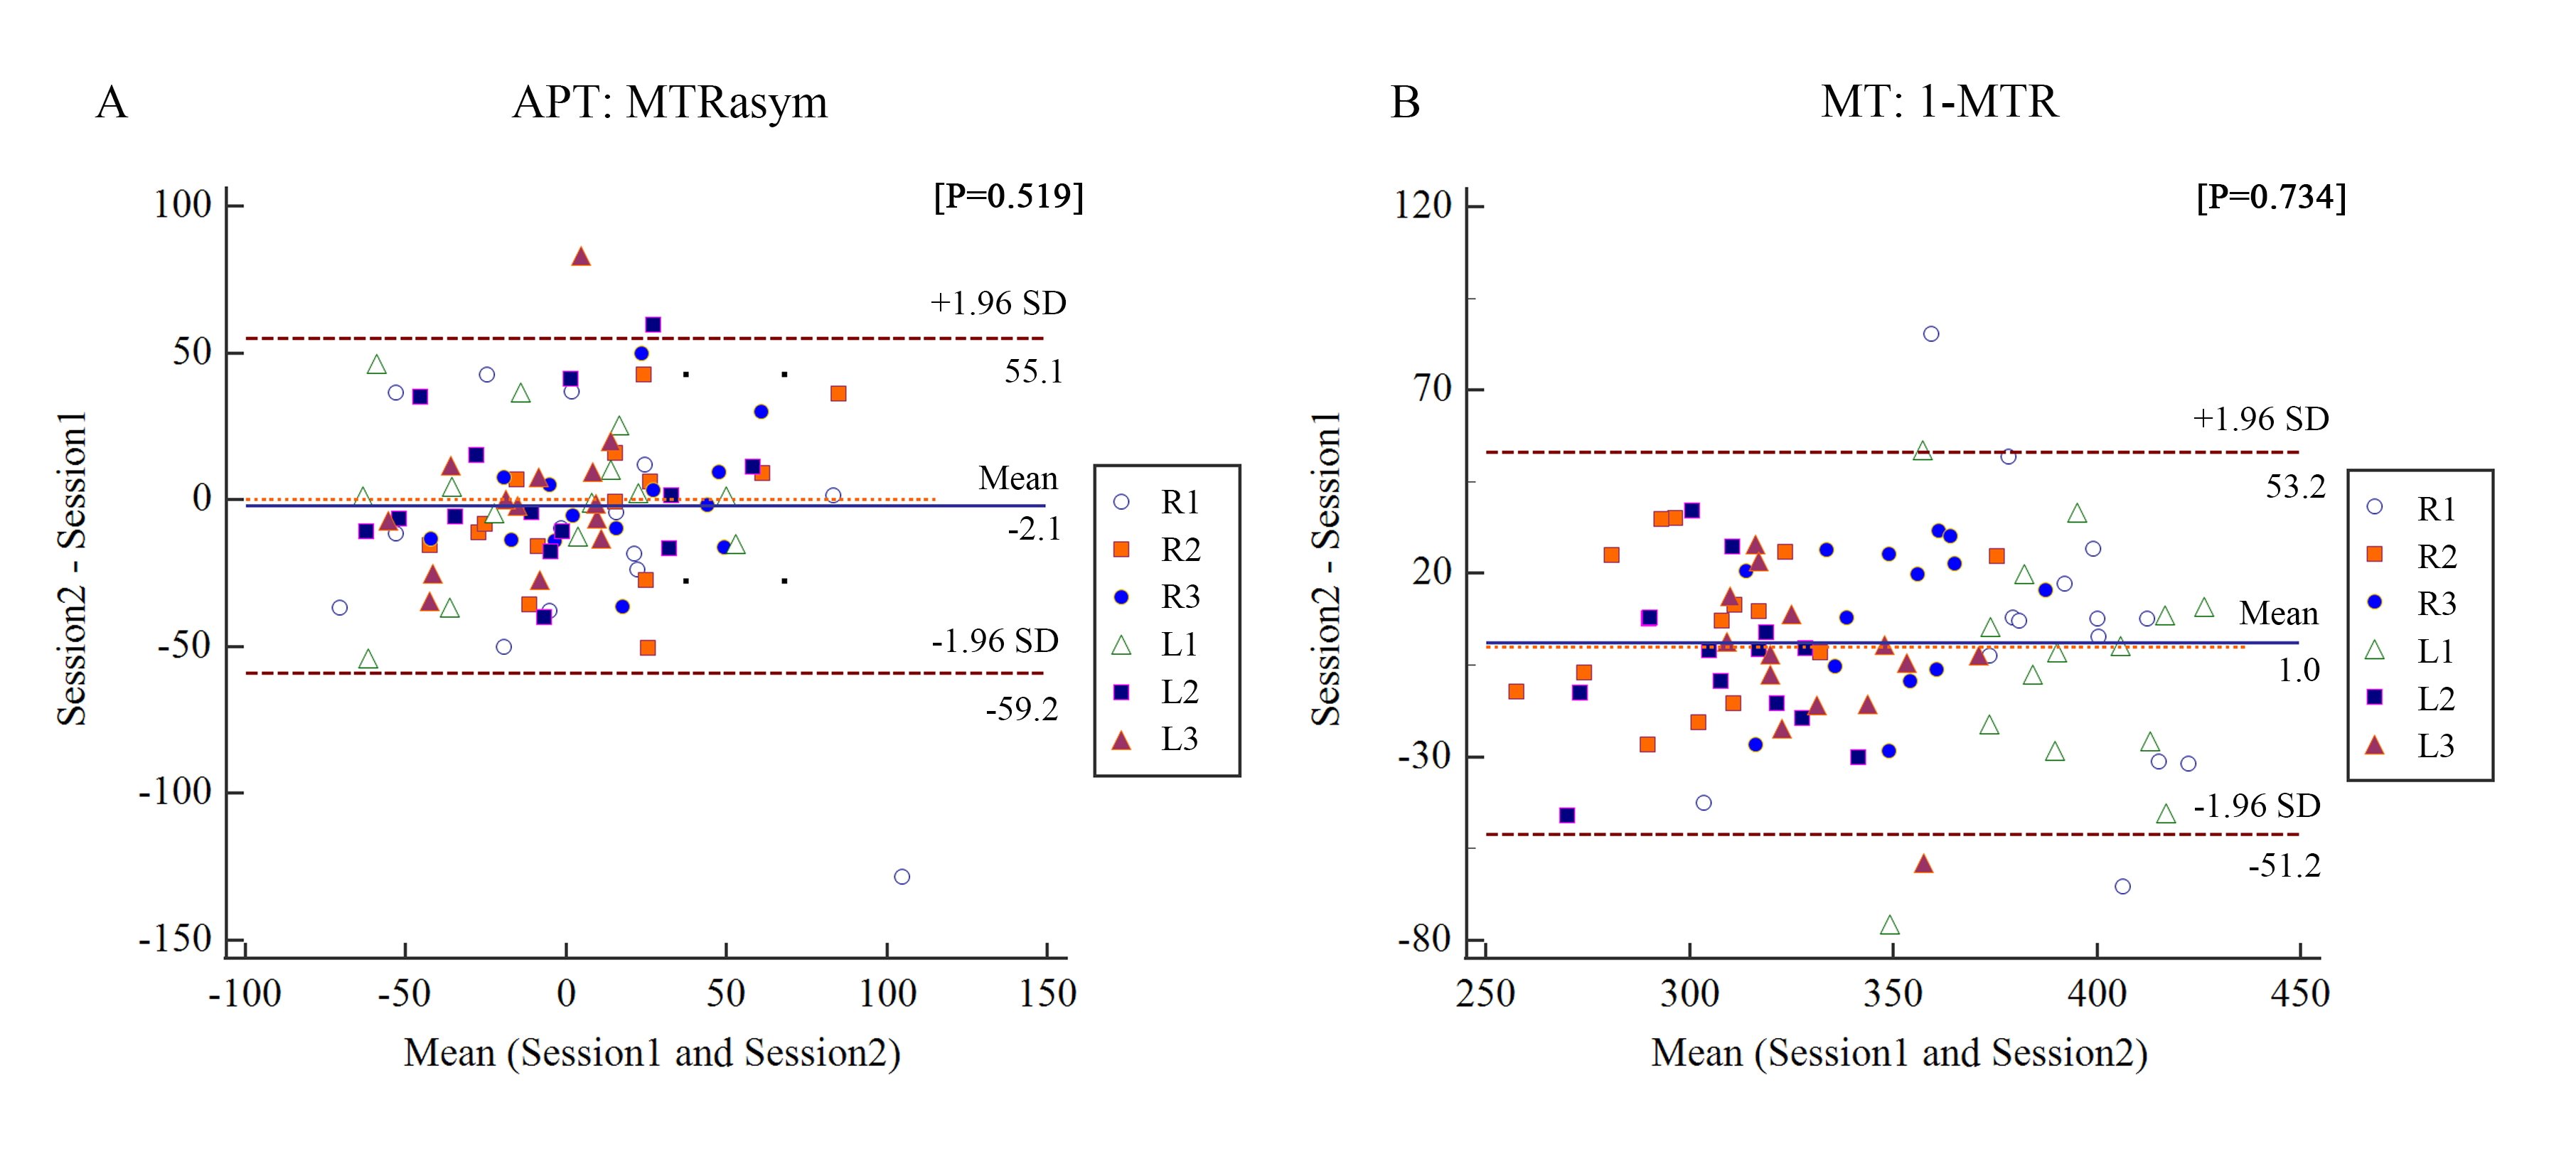
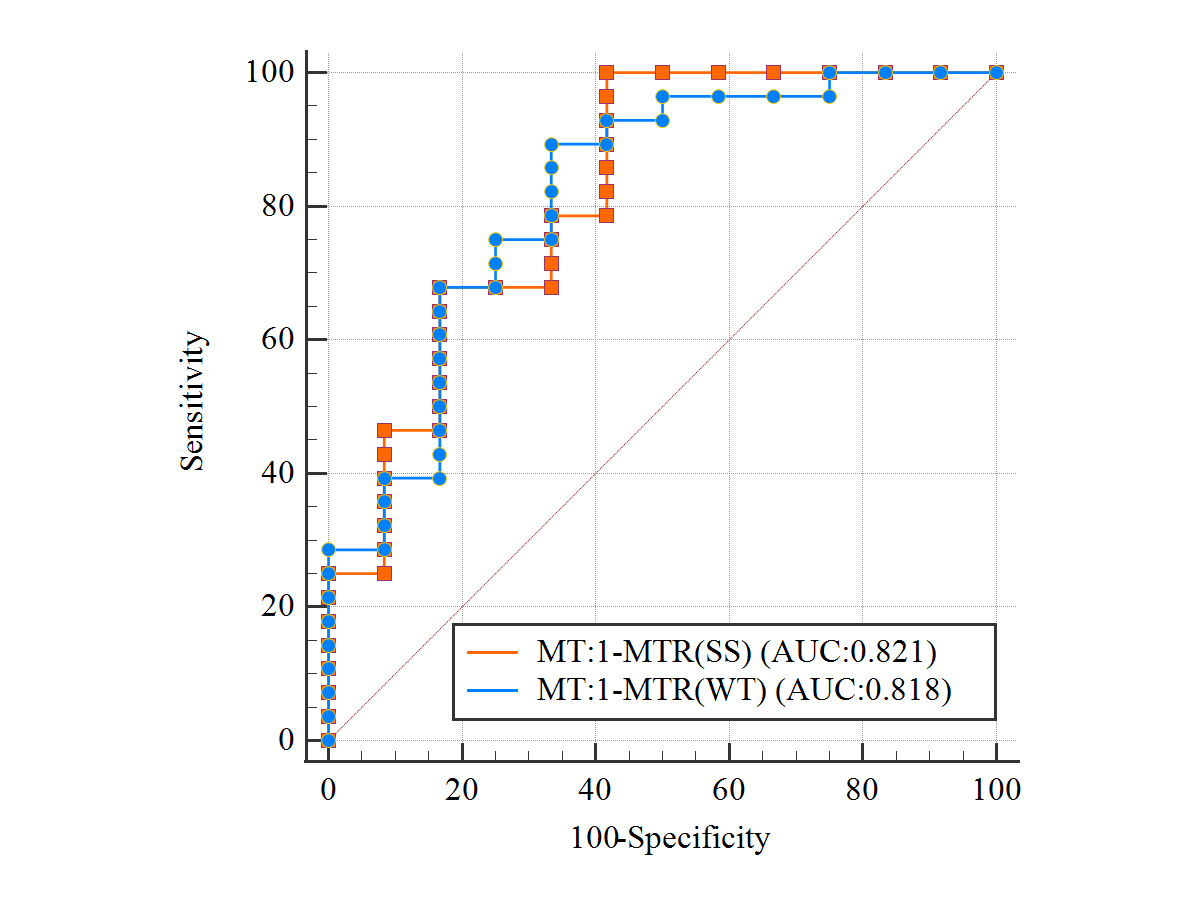
The APT and MT values showed good and excellent intra- and inter-observer agreement (all P values > 0.05, intra-ICC: 0.486 -0.888; inter-ICC: 0.665-0.993) by healthy volunteers (Figure3). This result suggests that 3D CEST APT imaging is feasible for the research of the nasopharynx. There was not significant difference for APT and ADC (P > 0.05) between residual and non-residual groups. However, it is significant difference for MT between two groups with SS-ROI(347.53 ± 17.93 vs.313.89 ± 41.71, P <0.001) and WT-ROIs (347.39 ± 15.42 vs.312.41 ± 52.12, P=0.003). For the forecasting treatment response performance, there was no significant difference between SS-ROI and WT-ROI (AUC: 0.818 vs. 0.821; P=0.969) (Figure4). We found that the APT and MT values of the non-residual groups were lower than the residual groups, suggesting that NPC patients with lower APT and MT values may have a better outcome. Consistent with our results, a long follow-up study by Qamar S et al [2] has shown that a low APT90 value has a higher 2-year disease-free survival rate. We speculated that tumors with a higher degree of malignancy showed higher APT and MT values due to increased protein synthesis accompanied by increased cell division and cell density [4,5]. This mechanism has also been confirmed in other malignant tumors [6]. Based on theoretical research, MT does not reduce the NOE effect. Therefore, the low MT value can be used as a marker of good outcome for NPC patients and better than the APT and ADC value.Conclusion
The pre-treatment MT values obtained by SS-ROI with 3D CEST APT sequence can perform better than the APT and ADC value on predicting treatment response of NPC with CRT, and the kind of manual drawing approach, SS-ROI, was easier than WT-ROI.Acknowledgements
This work was supported by the National Natural Science Foundation of China (grant number 82071895).References
[1] Chen Y P, Chan A, Le QT, et al. Nasopharyngeal carcinoma[J]. Lancet, 2019,394(10192):64-80.
[2] Qamar S, King A D, Ai Q H, et al. Pre-treatment amide proton transfer imaging predicts treatment outcome in nasopharyngeal carcinoma[J]. Eur Radiol, 2020,30(11):6339-6347.
[3] Lee A W, Ma B B, Ng W T, et al. Management of Nasopharyngeal Carcinoma: Current Practice and Future Perspective[J]. J Clin Oncol, 2015,33(29):3356-3364.
[4] Togao O, Yoshiura T, Keupp J, et al. Amide proton transfer imaging of adult diffuse gliomas: correlation with histopathological grades[J]. Neuro Oncol, 2014,16(3):441-448.
[5] Ohno Y, Yui M, Koyama H, et al. Chemical Exchange Saturation Transfer MR Imaging: Preliminary Results for Differentiation of Malignant and Benign Thoracic Lesions[J]. Radiology, 2016,279(2):578-589. [6] Nishie A, Asayama Y, Ishigami K, et al. Amide proton transfer imaging to predict tumor response to neoadjuvant chemotherapy in locally advanced rectal cancer[J]. J Gastroenterol Hepatol, 2019,34(1):140-146.
Figures