3138
A time-related random forest survival model based on MR imaging markers to predict the survival of patients with nasopharyngeal carcinoma1Sun Yat-sen University Cancer Center, Guangzhou, China, 2Philips Healthcare, Guangzhou, China
Synopsis
This study aimed to identify magnetic resonance (MR) imaging markers associated with the overall survival (OS) of patients with nasopharyngeal carcinoma (NPC) and establish a random survival forest (RSF) model, which is a time-related machine learning model for survival analysis, to predict their survival.
Background
The most powerful predictor for prognosis of NPC is the disease stage [1]. Other factors with prognostic relevance that have been suggested include size and degree of fixation of involved neck nodes, sex, age, presence of cranial nerve palsy and ear symptoms at presentation, histological type, and radiotherapy dose and coverage [2,3]. Random survival forest (RSF) is an ensemble tree method for analysis of right-censored survival data. As it is well known, constructing ensembles from base learners, such as trees, can substantially improve prediction performance [4]. In nearly all examples mentioned in [4], RSF is consistently better than, or at least as good as cox regression model [5]. This study explored MR imaging markers related to overall survival (OS) of patients with NPC using RSF, and established a model to predict their prognosis, which can provide important information about the survival probability of patients.Materials and Methods
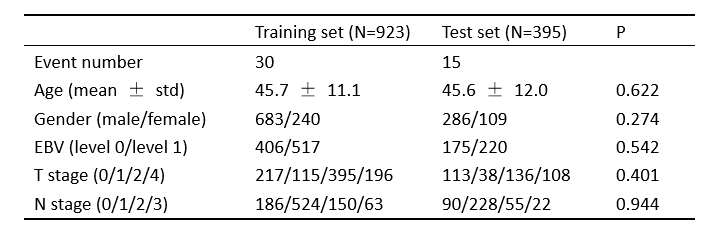
Consecutive patients with histologically proven NPC and with no metastasis at the initial diagnosis, treated at the Sun Yat-sen University Cancer Center (Guangzhou, China) between January 2010 and 2013, were enrolled in this study. The demographic and clinicopathological data were collected for all patients. The enrolled patients underwent MR imaging examinations with a 1.5-Telsa superconducting system (CVi-EXCITE-II, GE) or a 3.0-Telsa superconducting system (Achieva TX, Philips). The tumor-related MR imaging features the radiologists reported and clinical information were extracted. According to the admission time, the patients were divided into the training set (n = 923) and the testing set (n = 396). The period of follow-up was 2 years. The forward stepwise selection method based on RSF was performed in the training set to filter markers which were most predictive according to the results of 5-fold cross validation. Then a final RSF model using the selected markers combining with clinicopathological features (T stage and N stage) was constructed on the training set. The predictive performance of the model was evaluated by C-index, and survival curve was performed to explore the integrated relationship between the final model and OS. The feature selection and model building process were performed in Python.Results
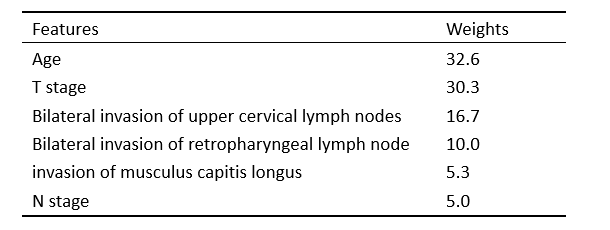
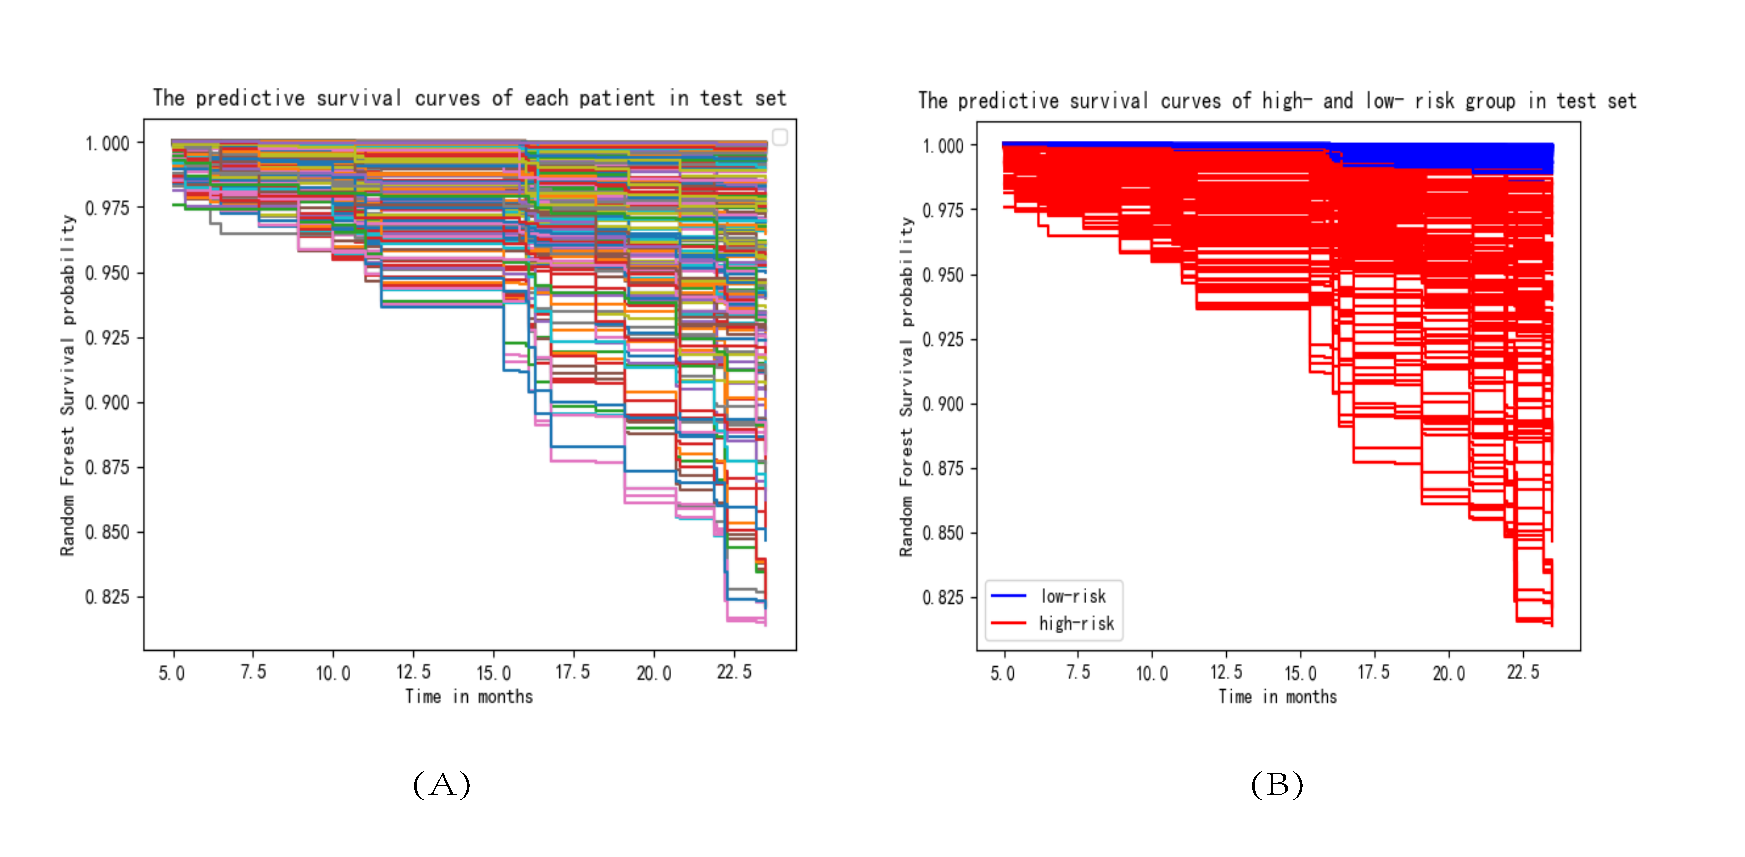
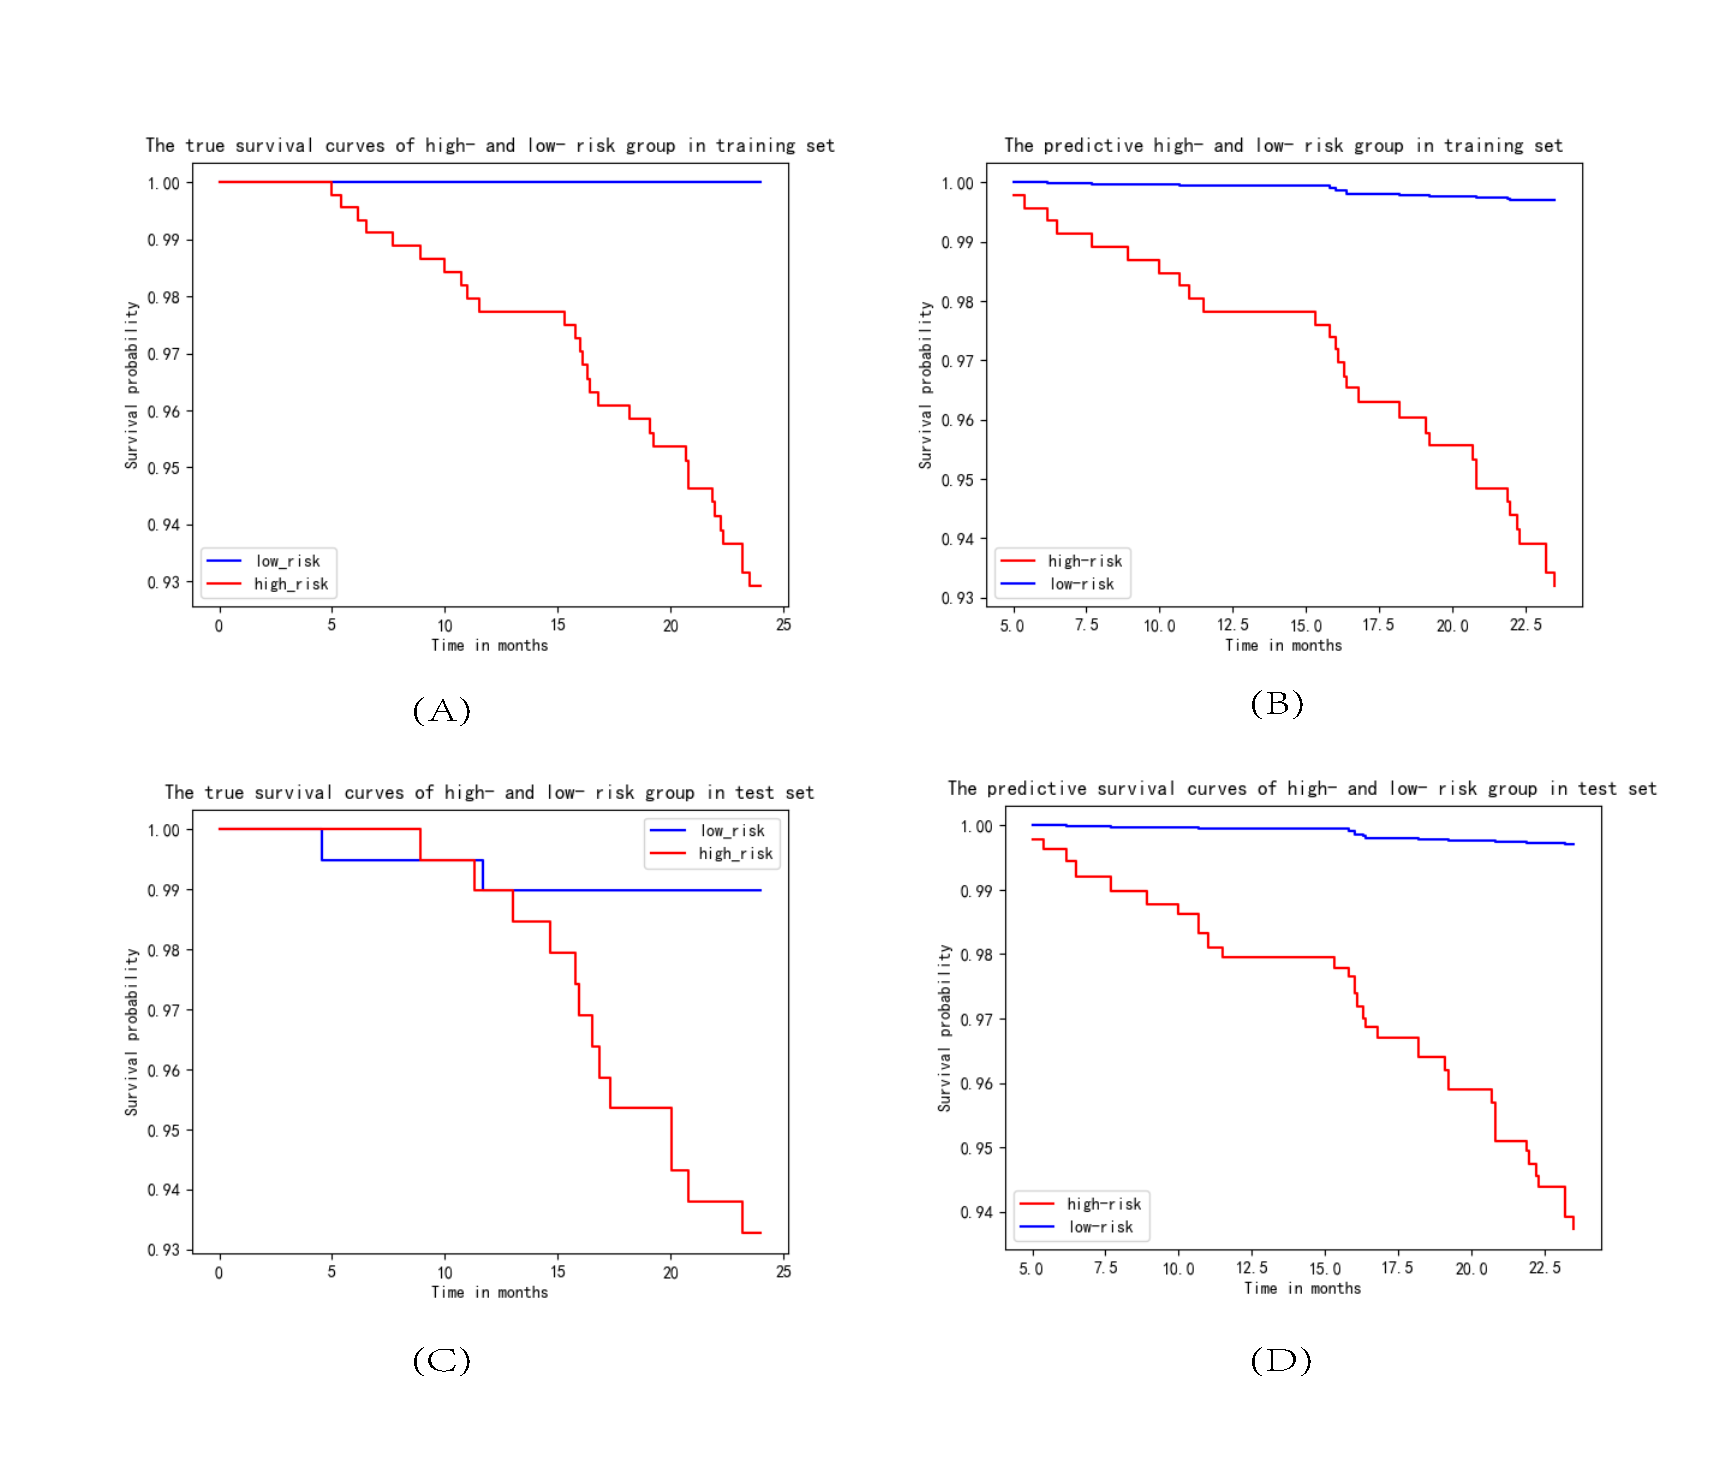
The baseline characteristics of all patients are listed in Table 1. After forward stepwise selection method, four features, including age, invasion of musculus capitis longus, bilateral invasion of retropharyngeal lymph node, and bilateral invasion of upper cervical lymph nodes were identified as important factors associated with 2-year OS. Except for age, other three features are MR imaging features. The C-index of the RSF model constructed by these four markers combining with clinicopathological features in the training set and test set was 0.87 and 0.79, respectively, which were higher than that of the cox model constructed only by clinicopathological features (0.79 and 0.71, respectively). The weights of features in RSF model are shown in Table 2. Based on the predictive survival scores of RSF model, which is in higher risk in dead event if the score is larger, the patients in the training set and test set were classified into low- and high-risk groups according to the median predictive score. Figure 1 shows the predicted survival curves of the test set. Figure 2 shows the survival curves of the true high- and low- risk groups and the predictive high- and low- risk groups, in which the survival curves of high- and low- risk group are clearly separated and the predictive survival curves of high- and low- risk groups are quite similar to the corresponding true survival curves. According to the predicted survival function of each patient, we can see the survival probability of this patient within 2 years, according to which may make it possible to arrange the patient to come back for reexamination at the right time.Conclusion
This study identified four features, including age, invasion of musculus capitis longus, bilateral invasion of retropharyngeal lymph node, and bilateral invasion of upper cervical lymph nodes may associated with the 2-year OS of patients with NPC. A RSF model built by the selected markers combining with clinicopathological features has a good performance in test set and may be helpful to the reexamination arrangement of patients with NPC.Acknowledgements
No acknowledgement found.References
[1] Petersson, Fredrik. Nasopharyngeal carcinoma: A review[J]. Seminars in Diagnostic Pathology, 2015, 32(1):54-73.
[2] Ng WT, Yau TK, Yung RW, et al. Screening for family members of patients with nasopharyngeal carcinoma. Int J Cancer. 2005;113:998–1001.
[3] Zeng Y, Zhang LG, Wu YC, et al. Prospective studies on nasopharyngeal carcinoma in Epstein–Barr virus IgA/VCA antibody-positive persons in Wuzhou City, China. Int J Cancer. 1985;36:545–547.
[4] Ishwaran H , Kogalur U B , Blackstone E H , et al. Random survival forests[J]. Journal of Thoracic Oncology Official Publication of the International Association for the Study of Lung Cancer, 2008, 2(12):841-860.
[5] Cox D . Regression models and life tables.[J]. J R Stat Soc Ser B, 1972, 34.
Figures