3137
Differentiation of T1 stage nasopharyngeal carcinoma and lymphoid hyperplasia by mono-exponential and bi-exponential metrics of TSE DWI1Dept. of Radiology, Yunnan Cancer Hospital, Kunming, China, 2Philips Healthcare China, Guangzhou, China
Synopsis
We aimed to differentiate between T1 stage nasopharyngeal carcinoma (NPC) and nasopharyngeal lymphoid hyperplasia using multiple b-values Turbo-spin-echo DWI acquisition. Turbo-spin-echo DWI were adopted to minimize susceptibility artifacts in nasopharynx. Mono-exponential and bi-exponential models were both used to generate ADC, D, D* and f maps. We found that T1 stage NPC had significant lower ADC and D, higher D* than nasopharyngeal lymphoid hyperplasia. Furthermore, D has best diagnostic efficacy with highest area under curve in ROC analysis, indicating that it's a potential imaging biomarker for accurate early diagnosis of T1 stage NPC.
Purpose
Nasopharyngeal carcinoma (NPC) is a common malignant tumor in China with high incidence rate. Studies has proved that early stage NPC had significant higher five-year survival rate than NPC at advanced stages. Therefore, timely diagnosis of early stage NPC is essential for good treatment outcome. However, it's difficult to differentiate between T1 stage NPC and lymphoid hyperplasia on anatomical MRI due to its small lesion size. This study aims to explore the value of turbo spin echo diffusion weighted imaging (TSE-DWI) by mono-exponential and bi-exponential fitting in the differential diagnosis of T1 stage NPC and nasopharyngeal lymphoid hyperplasia.Materials and Methods
This study was approved by local Institutional Review Board. 31 patients with T1 stage nasopharyngeal carcinoma and 23 patients with lymphoid hyperplasia which were all confirmed by pathological diagnosis were enrolled in the study. All patients underwent conventional anatomical scans and TSE-DWI scan with 10 b-values (b=0, 10, 20, 30, 50, 100, 200, 400, 600 and 800 s/mm2) in nasopharynx before treatment. Apparent diffusion coefficient (ADC), pure diffusion coefficient(D), pseudo-diffusion coefficient(D*) and perfusion fraction(f) were obtained for each subject by fitting diffusion weighted signals into mono-exponential (b0 and b=800s/mm2) and bi-exponential equation (all b-values), respectively. The above metrics were measured by manually drawing regions of interest (ROIs) on b0 images and their mean values were compared between the two groups with independent student t test in SPSS software. Receiver operating characteristic (ROC) curves of each metric were drawn and the areas under the curve (AUC) were calculated to evaluate their diagnostic efficacy. A P-value < 0.05 was considered statistically significant.Results
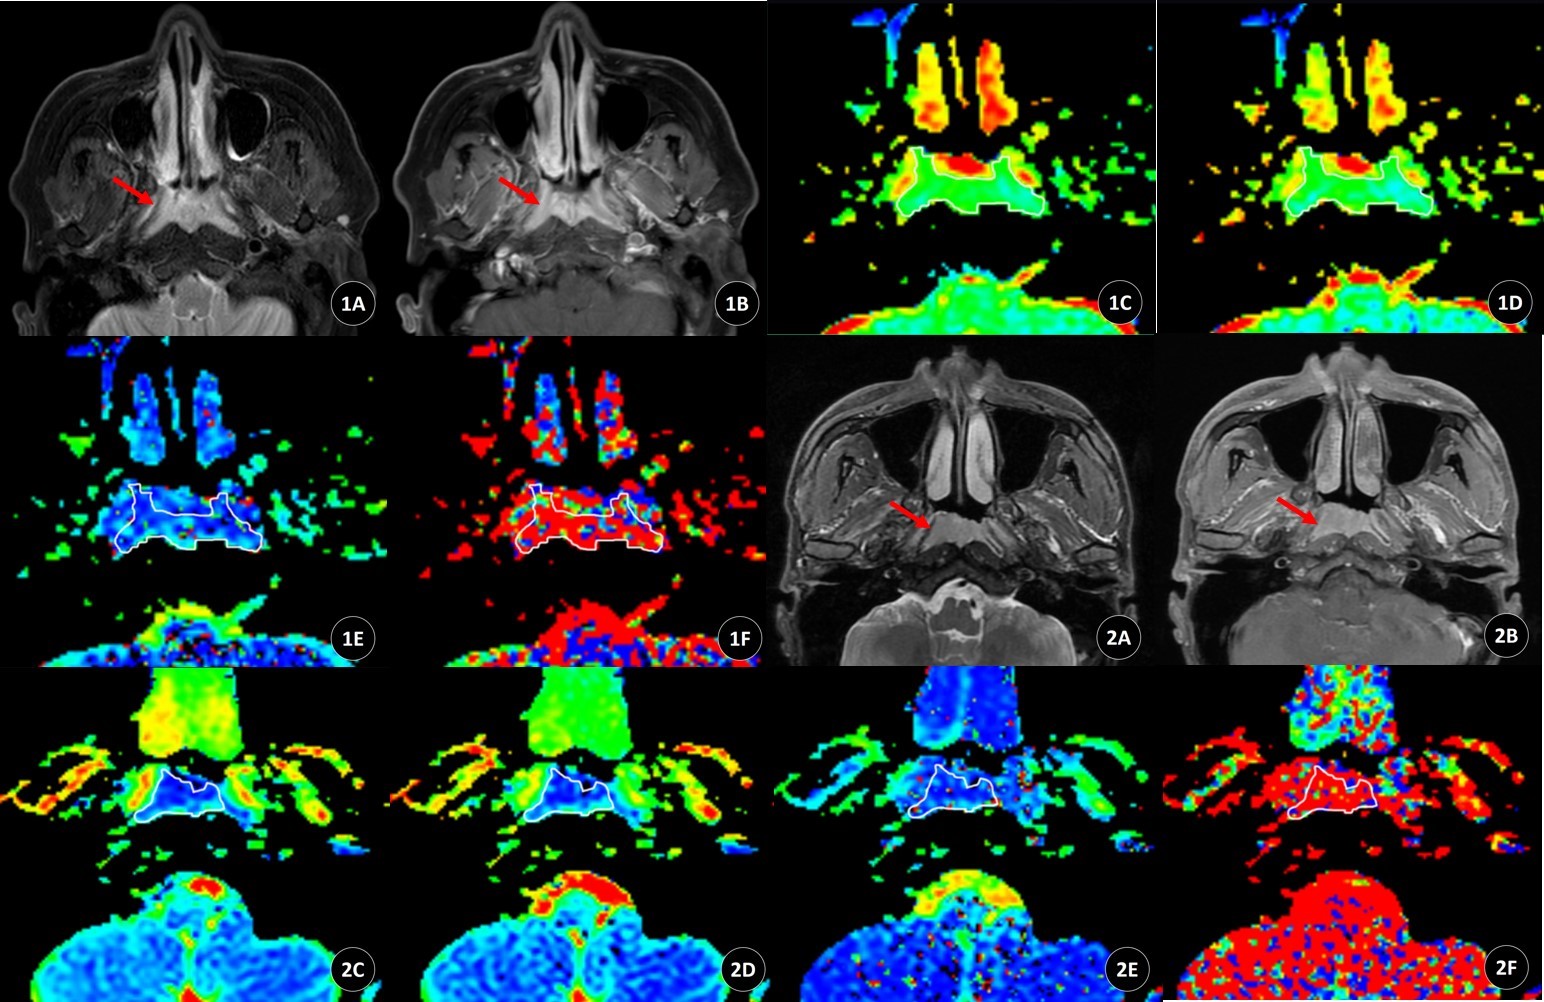
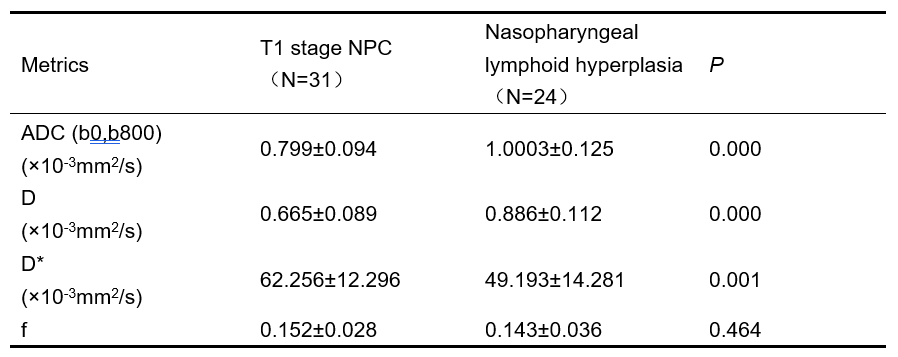
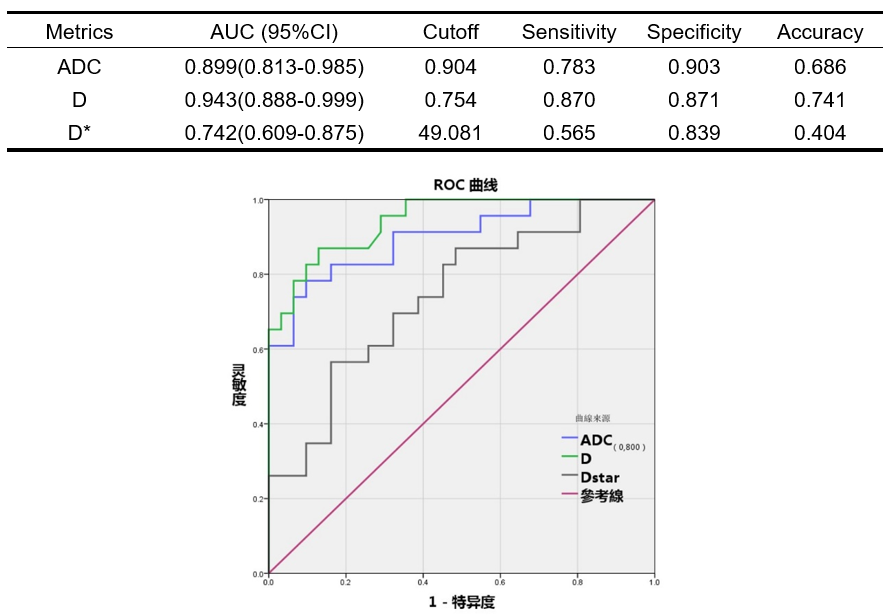
Figure 1 showed the representative anatomical images, ADC, D, D* and f maps of a female patient with nasopharyngeal lymphoid hyperplasia and a male patient with T1 stage NPC, respectively. As compared with lymphoid hyperplasia, T1 stage NPC exhibited significantly lower ADC and D (P<0.001), and higher D*(P=0.001<0.05) shown in Figure 2. But there was no statistical difference of f values between the two groups (P=0.464>0.05). Figure 3 demonstrated that the AUC of ADC and D were 0.899 and 0.943, respectively, and their best diagnostic thresholds were 0.904 and 0.754, respectively.Discussions
Sakamoto J. found that ADC, D and D* of malignant NPC were all significantly different than benign tumors[1]. Similarly, our studies also observed significantly lower ADC and D and higher D* in T1 stage NPC as compared with lymphoid hyperplasia lesions. Lower ADC and D may indicate higher cell density and less extracellular space in T1 stage NPC. D* is related to blood velocity and mean capillary segment length[2]. As NPC has abundant blood vessels, angiogenesis in T1 stage NPC may be higher than that in nasopharyngeal lymphoid hyperplasia, as shown by the higher D* of former group. There was no significant difference of perfusion fraction(f). Lemke A et. al. reported that f value was dependent on the TE time of DWI sequence and it would increase with TE[3]. As known, TE time of TSE DWI is prolonged with reference to traditional single-shot EPI DWI sequence, which leads to high f values and may bias its differentiation value in this study.Conclusion
TSE-DWI could significantly reduce the susceptibility artifacts in nasopharynx imaging. Mono-exponential model derived- ADC (b0 and b=800s/mm2) and bi-exponential model derived- D and D* from TSE DWI are potential imaging biomarkers to differentiate between early stage (T1 stage) nasopharyngeal carcinoma and nasopharyngeal lymphoid hyperplasia. Bi-exponential model derived- D has best diagnostic efficiency with highest AUC 0.943, and it could achieve high sensitivity and specificity both greater than 0.85 with 0.754x10⁻³mm/s2Acknowledgements
No acknowledgement found.References
[1] SAKAMOTO J, IMAIZUMI A, SASAKI Y, et al. Comparison of accuracy of intravoxel incoherent motion and apparent diffusion coefficient techniques for predicting malignancy of head and neck tumors using half-Fourier single-shot turbo spin-echo diffusion-weighted imaging. Magn Reson Imaging. 2014 Sep;32(7):860-866.DOI: 10.1016/j.mri.2014.05.002
[2] LE BIHAN D, BRETON E, LALLEMAND D, et al. Separation of diffusion and perfusion in intravoxel incoherent motion MR imaging. Radiology. 1988 Aug;168(2):497-505.DOI: 10.1148/ radiology.168.2.3393671
[3] LEMKE A, LAUN FB, SIMON D, et al. An in vivo verification of the intravoxel incoherent motion effect in diffusion-weighted imaging of the abdomen. Magn Reson Med. 2010 Dec;64(6):1580-1585.DOI: 10.1002/mrm.22565
Figures