3136
Characterizing meningioma subtypes using MRI-cytometry1Siemens Healthineers Ltd., Shanghai, China, 2Department of Neurosurgery, Huashan Hospital, Fudan University, Shanghai, China, 3Institute of Science and Technology for Brain-Inspired Intelligence, Fudan University, Shanghai, China, 4Human Phenome Institute, Fudan University, Shanghai, China, 5Siemens Healthcare GmbH, Erlangen, Germany
Synopsis
We used MRI-cytometry to estimate the mean cell diameter and intracellular volume of tumors of the meningioma subtype classification. We found cell size and intracellular volume to be very different between the three meningioma subtypes in this preliminary study. Our results reflected high collagen volume among the extracellular space in fibrous meningioma. We plan to scan more patients in the future to find a useful biomarker using MRI-cytometry.
Introduction
Determining the subtype and clinical characteristics of meningioma is crucial to treatment planning1. Imaging characteristics, such as tumor volume, presence of tumor necrosis, edema, or location acquired by T1w or T2w imaging, are related to the histological grade2. A machine-learning analysis method was applied to better classify the meningioma by grade, based on similar imaging features3. However, it is difficult to access the texture features of tumors or subtypes of meningiomas using routine MRI scans. The texture-related factors of meningioma, such as consistency, adherence, and neurovascular structures, are associated with surgical resection. Meningiomas with high stiffness and high adherence to surrounding brain tissue can be a challenge for surgical removal. It is necessary to predict these parameters before surgery to reduce the risk of surgical morbidity. A recent study showed a weak association between the T2/T1 intensity ratio and tumor consistency4. Diffusion-weighted imaging and apparent diffusion coefficient (ADC) maps have been used to correlate tumor grade and histopathologic findings5. Diffusion-weighted imaging provides information regarding tissue microstructure. However, the correlation between tumor cellularity and ADC reported in several studies is inconsistent6,7. Recently, multidimensional or oscillating gradient spin‐echo (OGSE) diffusion-weighted imaging provides a non-invasive tool to access tumor cellularity and its microstructure7,8. Here, we used MRI-cytometry9 to estimate the mean cell diameter and intracellular volume of the tumor. We hypothesized that the derived histopathological information could be used to estimate subtypes of meningiomas and their texture.Methods
Pre-operative MRI scans were acquired on a 3T MR scanner (MAGNETOM Prisma, Siemens Healthcare, Erlangen, Germany). Four meningioma patients, including two with fibrous meningioma, one with meningothelial meningioma, and one with angiomatous meningioma, were scanned. The MPRAGE sequence was used for structural T1 weighted imaging (TR/TE = 2300/2.29 ms, image matrix = 256 x 256 x 176, resolution = 0.93 mm iso). Pulsed and oscillating gradient spin-echo (PGSE and OGSE, respectively) diffusion-weighted images were acquired with the same oscillating frequencies and diffusion duration as previously described10 using a prototype sequence (TR/TE = 4000/119 ms, imaging matrix = 96 x 96 x 20, resolution = 2 x 2 x 5 mm3, GRAPPA = 2 and SMS = 2, PGSE: b= 0/250/500/750/1000/1400/1800 s/mm2, OGSE 25Hz: b= 0/250/500/750/1000 s/mm2, OGSE 50Hz: b = 0/100/200/300 s/mm2). The mean cell diameter and intracellular volume fraction (IVF) were calculated using MRI-cytometry9. Tumors were sectioned and stained with hematoxylin and eosin (H&E) for cellularity.Results
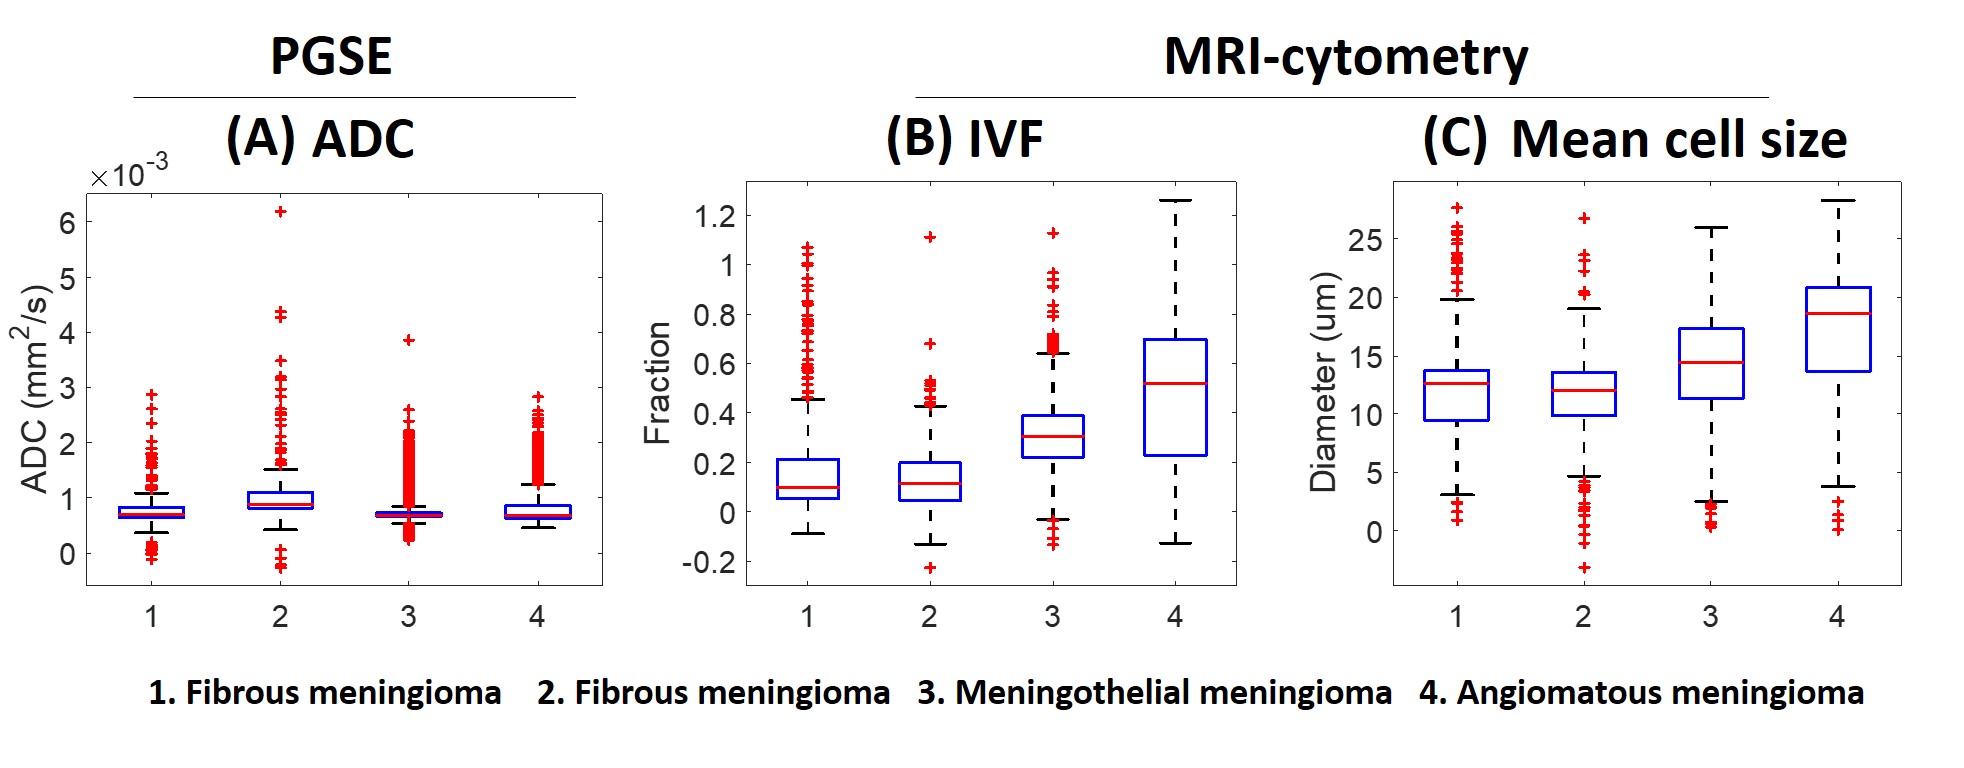
Figure 1 shows the T1 weighted images, ADC, IVF, mean cell size (diameter) maps, and H&E stain of the four patients. Based on the image intensities, it is difficult to tell the difference in the T1 and ADC values between the various tumor subtypes. Comparing the IVF maps, the first fibrous meningioma had a lower value, and the angiomatous meningioma had a greater value. Comparing the mean cell size maps, the fibrous meningioma had a smaller cell size, and angiomatous meningioma had a larger cell size. Figure 2 shows the boxplots of ADC, IVF, and mean cell size of voxels within the tumor for each patient. The median ADCs from left to right were 0.70, 0.89, 0.69, and 0.68 x 10⁻³ mm2/s, respectively. The median IVFs from left to right were 0.10, 0.11, 0.31, and 0.52, respectively. The median cell size from left to right were 12.62, 12.03, 14.38, and 18.60, respectively. The median IVF of meningothelial meningioma was 285% that of the fibrous meningioma, and the median IVF of angiomatous meningioma was 485% that of the fibrous meningioma. The median cell size of the meningothelial meningioma was 117% that of the fibrous meningioma, and the median cell size of the angiomatous meningioma was 151% that of the fibrous meningioma.Discussion and Conclusion
ADC values in meningiomas depend on cellularity, cell size, diffusion coefficient, and vascularity. Using MRI-cytometry, we were able to separate these effects and provide microstructural information which correlates with histological findings. The information provided by this method may enable to distinguish meningioma subtypes without the need for biopsy. In this preliminary study, we found that the IVF and cell type were different between the three meningioma subtypes. Particularly for the IVF, meningothelial meningioma and angiomatous meningioma were 285% and 485% that of fibrous meningioma, respectively. The lower IVF of fibrous meningioma reflected high collagen volume among the extracellular space. The relation between extracellular volume and collagen volume was implemented in diagnosing myocardial fibrosis11. We only compared three different meningiomas among four patients; the number was too small to provide useful conclusions that can be used for future subtype classification. In the future, we plan to recruit additional patients and aim to find biomarkers for subtype classification. Due to the slew rate limit in clinical scanners, this method may not be accurate for small cells due to the limited gradient oscillation frequencies. The assumption made for non-permeable cell membrane and spherical cells may not reflect reality, but the quantitative values estimated from MRI-cytometry can still be useful if used as a biomarker to classify the tumor subtype.Acknowledgements
No acknowledgement found.References
1. Gajbhiye S, Gosal JS, Pandey S, Das KK. Apoplexy Inside a Giant Medial Sphenoid Wing Meningothelial (Grade I) Meningioma: An Extremely Rare but a Potentially Dangerous Complication. Asian J Neurosurg 2019;14:961-3.
2. Hale, Andrew T., et al. Differentiating meningioma grade by imaging features on magnetic resonance imaging. Journal of Clinical Neuroscience 48 (2018): 71-75.
3. Yan, Peng-Fei, et al. The potential value of preoperative MRI texture and shape analysis in grading meningiomas: a preliminary investigation. Translational oncology 10.4 (2017): 570-577.
4. Sauvigny, Thomas, et al. Features of tumor texture influence surgery and outcome in intracranial meningioma. Neuro-oncology advances 2.1 (2020): vdaa113.
5. Surov, Alexey, et al. Diffusion-weighted imaging in meningioma: prediction of tumor grade and association with histopathological parameters. Translational oncology 8.6 (2015): 517-523.
6. Sanverdi, S. Eser, et al. Is diffusion-weighted imaging useful in grading and differentiating histopathological subtypes of meningiomas?. European journal of radiology 81.9 (2012): 2389-2395.
7. Topgaard, Daniel. Multidimensional diffusion MRI. Journal of Magnetic Resonance 275 (2017): 98-113.
8. Baron, Corey A., and Christian Beaulieu. Oscillating gradient spin‐echo (OGSE) diffusion tensor imaging of the human brain. Magnetic resonance in medicine 72.3 (2014): 726-736.
9. Xu, J. et al. MRI-cytometry: Mapping nonparametric cell size distributions using diffusion MRI. Magnetic Resonance in Medicine (2020).
10. Xu, J. et al. Magnetic resonance imaging of mean cell size in human breast tumors. Magnetic Resonance in Medicine 83, 2002–2014 (2020).
11. Haaf, Philip, et al. Cardiac T1 mapping and extracellular volume (ECV) in clinical practice: a comprehensive review. Journal of Cardiovascular Magnetic Resonance 18.1 (2017): 1-12.
Figures
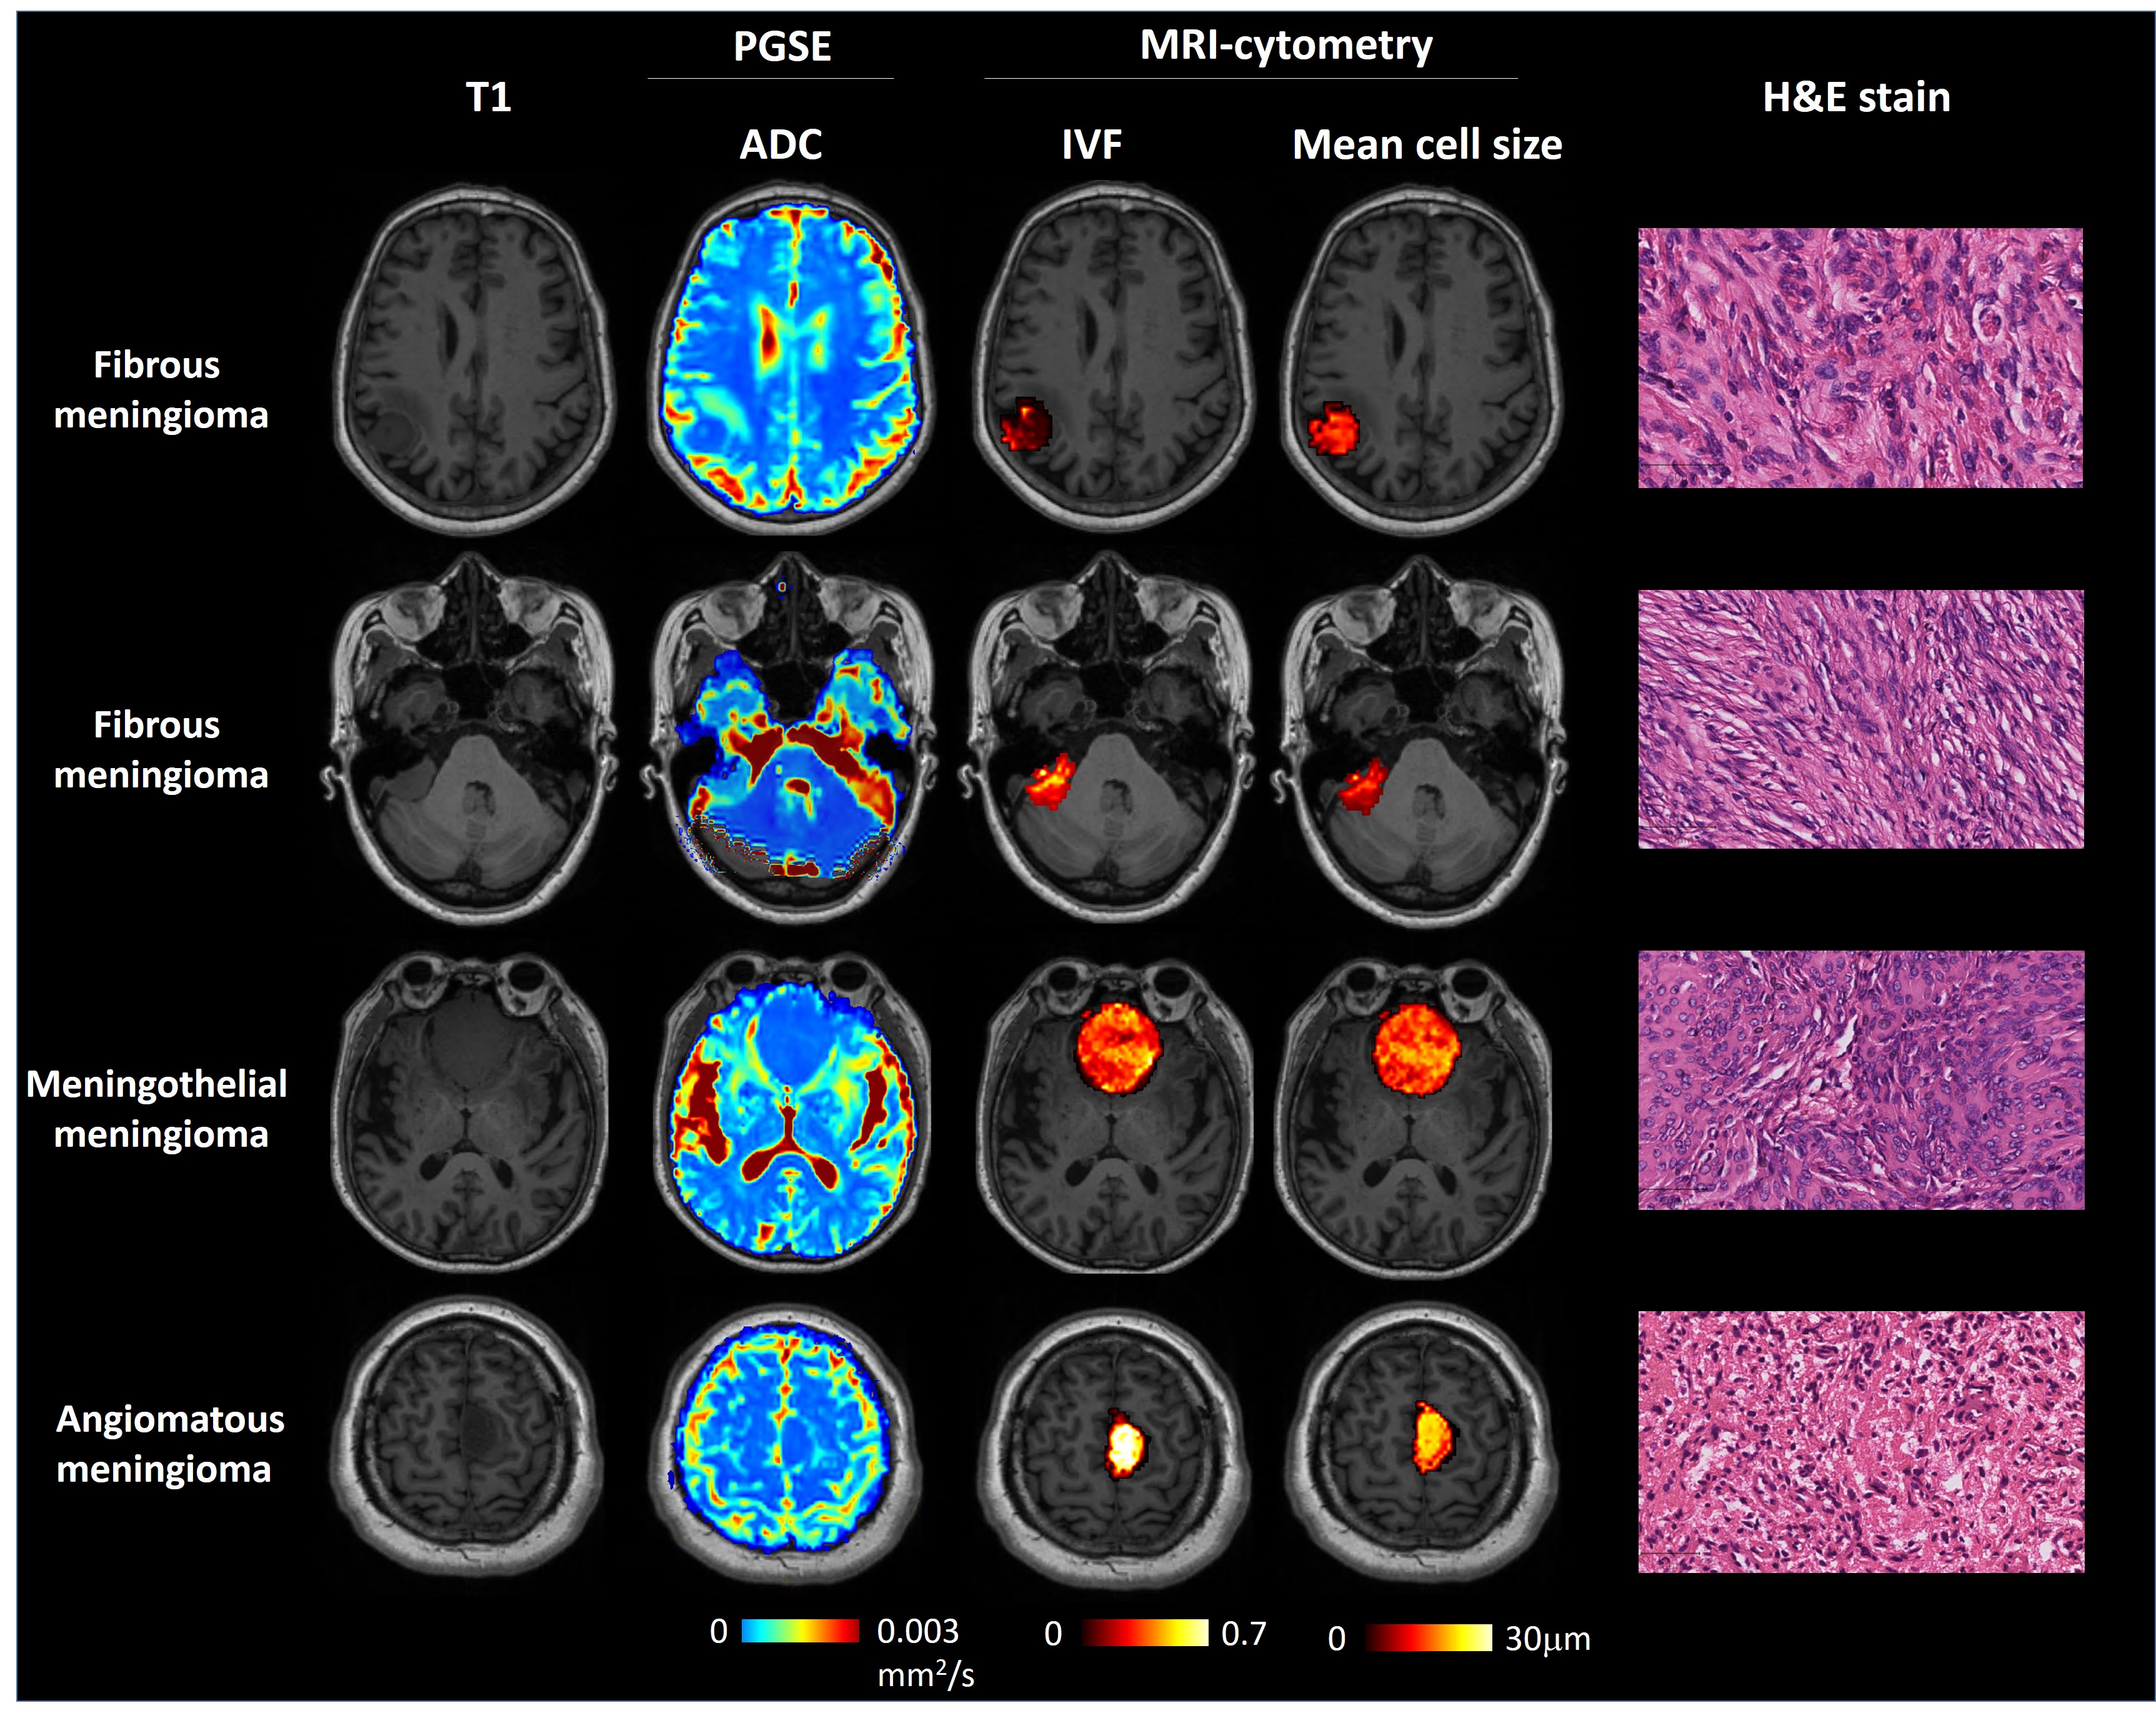
Figure 1. T1 weighted images, ADC, IVF, and mean cell size (diameter) maps, respectively, of the four patients.