3135
Evaluation of diagnostic and prognostic value of high-resolution 3D 1H-MRSI for patients with newly diagnosed glioma
Bin Bo1, Tianyao Wang2, Ziyu Meng1, Rong Guo3,4, Yudu Li3,4, Yibo Zhao3,4, Xin Yu5, Zhi-Pei Liang3,4, and Yao Li1
1School of Biomedical Engineering, Shanghai Jiao Tong University, Shanghai, China, 2Radiology Department, The Fifth People's Hospital of Shanghai, Fudan University, Shanghai, China, 3Beckman Institute for Advanced Science and Technology, University of Illinois at Urbana-Champaign, Urbana, IL, United States, 4Department of Electrical and Computer Engineering, University of Illinois at Urbana-Champaign, Urbana, IL, United States, 5Department of Biomedical Engineering, Case Western Reserve University, Cleveland, OH, United States
1School of Biomedical Engineering, Shanghai Jiao Tong University, Shanghai, China, 2Radiology Department, The Fifth People's Hospital of Shanghai, Fudan University, Shanghai, China, 3Beckman Institute for Advanced Science and Technology, University of Illinois at Urbana-Champaign, Urbana, IL, United States, 4Department of Electrical and Computer Engineering, University of Illinois at Urbana-Champaign, Urbana, IL, United States, 5Department of Biomedical Engineering, Case Western Reserve University, Cleveland, OH, United States
Synopsis
Conventional structural MRI has limited specificity in defining the extent and grade of glioma. MRSI complements MRI in tumor tissue characterization with neurometabolic fingerprints. In this study, we investigated the use of high-resolution 3D MRSI for glioma grading and evaluation of patient overall survival. Our results showed that the neurometabolic biomarkers could differentiate low-grade from high-grade gliomas and provide prognostic value for overall survival of newly diagnosed glioma patients.
Introduction
Glioma is the most common type of brain tumor in adults and its treatment strategy is highly dependent on accurate definition of tumor grade and tumor tissue characterization1. Conventional contrast-enhanced T1-weighted MRI and T2-weighted MRI have been widely used for glioma identification and localization, but have very limited specificity in defining the extent and grade of tumor and predicting patient outcome2. Advanced neuroimaging techniques capable of providing reliable and quantitative biochemical assessment of tumor tissues are desired to further improve the clinical management of glioma patients3,4. MR spectroscopic imaging (MRSI) has been well recognized as a potentially powerful tool for mapping the neurometabolic fingerprints of tumor tissue5,6. However, poor spatial resolution and long acquisition time have limited its clinical applications in glioma diagnosis and prognosis. In this study, we investigated the use of a recently developed fast high-resolution MRSI technique known as SPICE (SPectroscopic Imaging by exploiting spatiospectral CorrElation)7-13 for glioma grading and evaluated its prognostic value for predicting patient overall survival (OS). Our results showed that the neurometabolites concentrations could differentiate low-grade from high-grade gliomas and provide prognostic biomarkers for OS of patients.Methods
From October 2018 to June 2021, 29 patients with newly diagnosed gliomas were included in this study. Tumor grading information was obtained based on histopathological assessment (conducted on 24 patients) or diagnosis using the watch-and-wait strategy by clinician (conducted on 5 patients)14. Tumor proliferation activity was assessed using Ki-67 labeling index (LI) following the standard procedure (conducted on 25 patients)15. OS was obtained from clinical record review. A detailed summary of patient characteristics and outcome is provided in Table 1. This study was approved by the Institutional Review Board of the Fifth People’s Hospital of Shanghai, China. All participants provided written informed consents. All patients underwent presurgical MRI on a 3T Siemens Skyra scanner. The imaging protocol included 3D 1H-MRSI scan using the SPICE sequence (2.0 × 3.0 × 3.0 mm3, FOV = 240 × 240 ×72 mm3, TE = 1.6 ms, TR = 160 ms, scan time = 8 min), 3D MPRAGE (1.0 × 1.0 × 1.0 mm3, FOV = 256 mm, TR = 2500 ms, TE = 2.13 ms) before (T1) and after (cT1) administration of gadopentetate dimeglumine bolus (0.1 mmol/kg), and FLAIR (0.5 × 0.5 × 2.0 mm3, FOV = 240 mm, TR = 9000 ms, TE = 89 ms). The spatiospectral function of the neurometabolites was reconstructed from the 3D MRSI data using a union-of-subspaces model, incorporating pre-learned spectral basis functions7-13. An improved LCModel-based method was used for spectral quantification, incorporating both spatial and spectral priors10. The segmentation of tumor tissue, peritumoral edema, and contralateral normal tissue was manually performed by an experienced neuroradiologist on the T1-weighted images and the FLAIR images, respectively. The FLAIR images, the T1-weighted images and the corresponding tissue masks were all coregistered to MRSI using an affine linear transformation16. Paired t-tests were applied to compare the concentrations of choline (Cho), N-acetylaspartate (NAA), creatine (Cr), and Cho/NAA ratio in the regions of tumor, edema, and normal tissues. Spearman correlation analysis was used to investigate the relationship between the neurometabolite concentrations and Ki-67 LI. Kaplan-Meier estimates of the cumulative probability of OS were performed to evaluate the prognostic value of the neurometabolites. All the statistical analyses were conducted using SPSS and GraphPad Prism.Results
Figure 1 shows a set of representative Cho and NAA maps along with spatially resolved spectra from the tumor, edema and normal regions, obtained from a patient with grade IV glioma. Decreased NAA and increased Cho can be clearly observed within the tumor area. Figure 2 shows the representative neurometabolite maps from patients of grade II (astrocytoma), grade III (astrocytoma), and grade IV (glioblastoma), respectively. The corresponding immunohistochemical Ki-67 staining tissue sections were also displayed. The Cho/NAA ratio in high-grade glioma was significantly higher than low-grade glioma, which is consistent with literature17. Moreover, the mean Cho/NAA of tumor tissue was significantly correlated with the Ki-67 LI (r = 0.54, p = 0.014), as shown in Fig. 2C, which indicated the close link of Cho/NAA to tumor proliferation activity. Figure 3 shows the statistical comparisons of the neurometabolite concentrations among different regions of interest in glioma patients. Significantly higher level of Cho/NAA ratio in tumor tissue than normal tissue was consistently found across different tumor grades. The Cho/NAA in tumor tissue was significantly lower in low-grade glioma patients than that in high-grade glioma patients. Figure 4 shows the Kaplan-Meier OS curves using Cho and Cho/NAA. Participants with higher Cho and Cho/NAA in both tumor and edema areas had a significantly higher risk of death than those with lower Cho and Cho/NAA values.Conclusion
Our study shows that neurometabolic biomarkers obtained using high-resolution 3D 1H-MRSI provide useful information for both tumor grading and overall survival prediction of newly diagnosed gliomas.Acknowledgements
This work was supported by National Science Foundation of China (No.61671292 and 81871083); Shanghai Jiao Tong University Scientific and Technological Innovation Funds (2019QYA12); Key Program of Multidisciplinary Cross Research Foundation of Shanghai Jiao Tong University (YG2021ZD28).References
- Tanaka S, Louis DN, Curry WT, et al. Diagnostic and therapeutic avenues for glioblastoma: no longer a dead end. Nat Rev Clin Oncol. 2013; 10 (1):14-26.
- Waldman AD, Jackson A, Price SJ, et al. Quantitative imaging biomarkers in neuro-oncology. Nat Rev Clin Oncol. 2009; 6(8):445-454.
- la Fougere C, Suchorska B, Bartenstein P, et al. Molecular imaging of gliomas with PET: opportunities and limitations. Neuro Oncol. 2011; 13(8):806-819.
- Bi J, Chowdhry S, Wu S, et al. Altered cellular metabolism in gliomas—an emerging landscape of actionable co-dependency targets. Nat Rev Cancer. 2020; 20(1):57-70.
- Cordova JS, Shu HKG, Liang, Z, et al. Whole-brain spectroscopic MRI biomarkers identify infiltrating margins in glioblastoma patients. Neuro Oncol.2016; 18(8): 1180-1189.
- Bulik M, Jancalek R, Vanicek J, et al. Potential of MR spectroscopy for assessment of glioma grading. Clin Neurol Neurosurg. 2013; 115(2):146-153.
- Lam F, Liang ZP. A subspace approach to high-resolution spectroscopic imaging. Magn Reson Med. 2014;71(4):1349-1357.
- Lam F, Ma C, Clifford B, et al. High-resolution 1H-MRSI of the brain using SPICE: Data acquisition and image reconstruction. Magn Reson Med. 2016;76(4):1059-1070.
- Ma C, Lam F, Johnson CL, et al. Removal of nuisance signals from limited and sparse 1H MRSI data using a union-of-subspaces model. Magn Reson Med. 2016;75(2):488-497.
- Li Y, Lam F, Clifford B, et al. A subspace approach to spectral quantification for MR spectroscopic imaging. IEEE Trans Biomed Eng. 2017;64(10):2486-2489.
- Peng X, Lam F, Li Y, et al. Simultaneous QSM and metabolic imaging of the brain using SPICE. Magn Reson Med. 2018;79(1):13-21.
- Guo R, Zhao Y, Li Y, et al. Simultaneous metabolic and functional imaging of the brain using SPICE. Magn Reson Med. 2019;82(6):1993-2002.
- Guo R, Zhao Y, Li Y, et al. Simultaneous QSM and metabolic imaging of the brain using SPICE: Further improvements in data acquisition and processing. Magn Reson Med. 2021;85(2):970-977.
- Louis DN, Perry A, Reifenberger G, et al. The 2016 World Health Organization classification of tumors of the central nervous system: a summary. Acta Neuropathol. 2016;131(6):803-820.
- Imbalzano KM, Tatarkova I, Imbalzano AN, et al. Increasingly transformed MCF-10A cells have a progressively tumor-like phenotype in three-dimensional basement membrane culture. Cancer Cell Int. 2009;9(1):1-11.
- Muzik O, Chugani DC, Juhász C, et al. Statistical parametric mapping: assessment of application in children. Neuroimage. 2000;12(5):538-549.
- Law M, Yang S, Wang H, et al. Glioma grading: sensitivity, specificity, and predictive values of perfusion MR imaging and proton MR spectroscopic imaging compared with conventional MR imaging. Am J Neuroradiol. 2003;24(10):1989-1998.
Figures
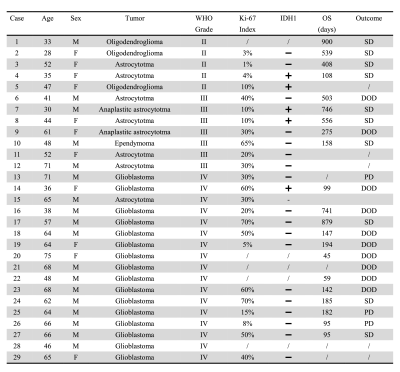
Table 1. Summary
of patient characteristics and outcome. Abbreviations: DOD, died of
disease; SD, stable disease; PD, progressive disease.
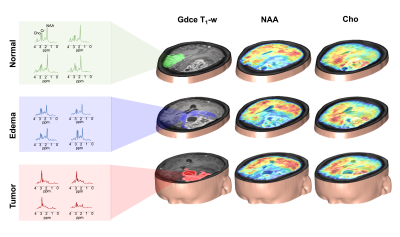
Figure 1. 3D MRSI results
obtained from a glioma patient (grade IV) at a nominal spatial resolution of
2.0×3.0×3.0 mm3 in an 8-min scan. 3D Cho
and NAA maps overlaid on Gdce T1-w images. The representative
spectra were acquired from the tumor (red), edema (blue) and normal (green)
regions.
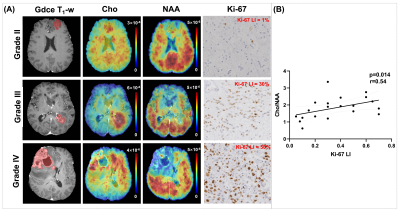
Figure 2. (A) Metabolic and
immunochemistry images from representative patients of grade II (astrocytoma), grade III (astrocytoma), and grade
IV (glioblastoma), respectively. (B) The mean Cho/NAA ratio in tumor was
correlated with Ki-67 labeling index (LI).
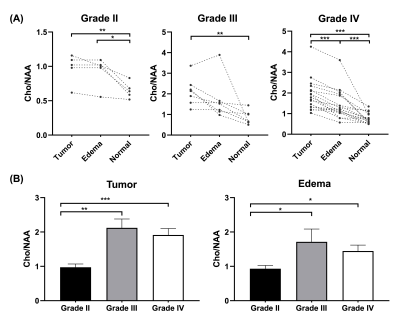
Figure 3. (A) Comparisons of
neurometabolite concentrations among different regions of interest in glioma
patients. (B) Cho/NAA in low-grade (grade II) and high-grade (grades III and
IV) gliomas. *, p < 0.05; **, p < 0.01; ***, p < 0.001.
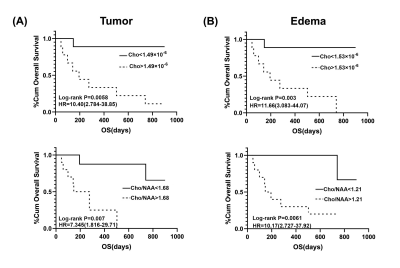
Figure 4. Kaplan-Meier
estimates of OS using Cho concentrations and Cho/NAA ratios.
(A)
In the tumor area, Cho of less than 1.49×10⁻⁶ and Cho/NAA of less
than 1.68 indicate relatively long-term survival. (B) In the edema area, Cho of
less than 1.53× 10⁻⁶ and
Cho/NAA of less than 1.21 indicate relatively long-term survival.
DOI: https://doi.org/10.58530/2022/3135