3132
The application of multi-mode MR imaging technology in the tumor infiltration boundary of cerebral glioma1The First Affiliated Hospital of Guangxi Medical University, Nanning, China, 2MR Scientific Marketing, Siemens Healthineers, Wuhan, China
Synopsis
We explored the applied value of multi-mode MR imaging technology, including diffusion kurtosis imaging (DKI), arterial spin labeling (ASL) and 1H-MRS, in glioma tumor invasion boundary. Results showed mean kurtosis from DKI and apparent diffusion coefficient had the highest diagnostic efficiency between high-grade (HGG) and low-grade gliomas (LGG). There were significant differences in CHO/Cr and NAA/Cr from 1H-MRS between the solid area and the proximal peritumoral edema area (PEA), and CHO/Cr and NAA/Cr in different PEA of LGG or HGG. PEA within 1cm around the solid area is recommended to be resected to decrease recurrence rate.
Purpose
To investigate the applied value of diffusion kurtosis imaging (DKI), three- dimensional arterial spin labeling (3D-ASL) perfusion imaging and magnetic resonance spectroscopy (1H-MRS) in the tumor infiltration boundary of cerebral glioma.Materials and Methods
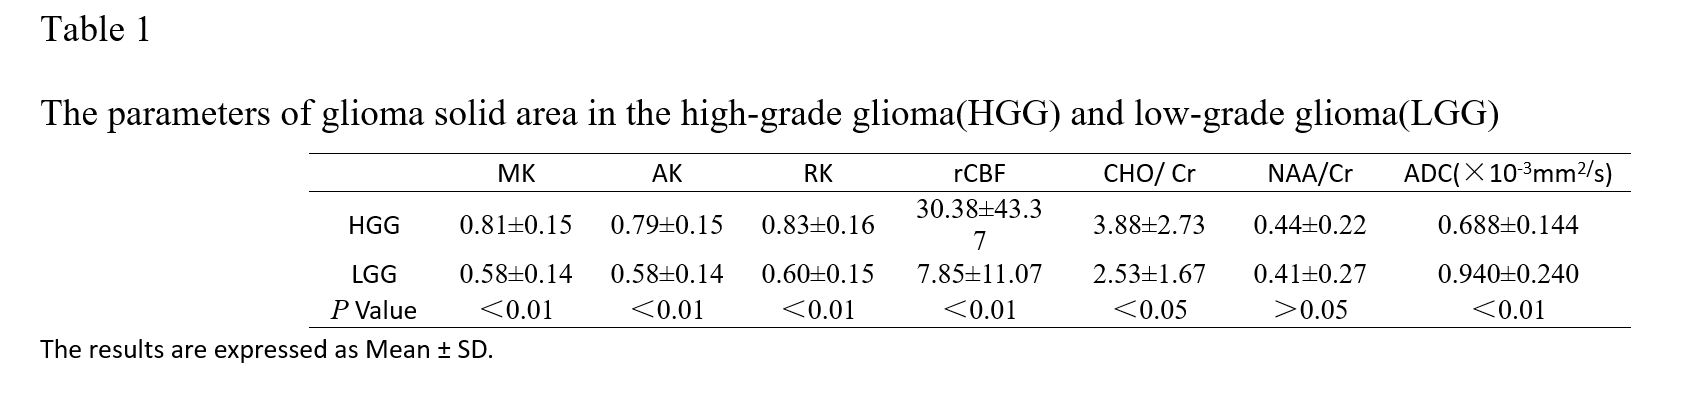
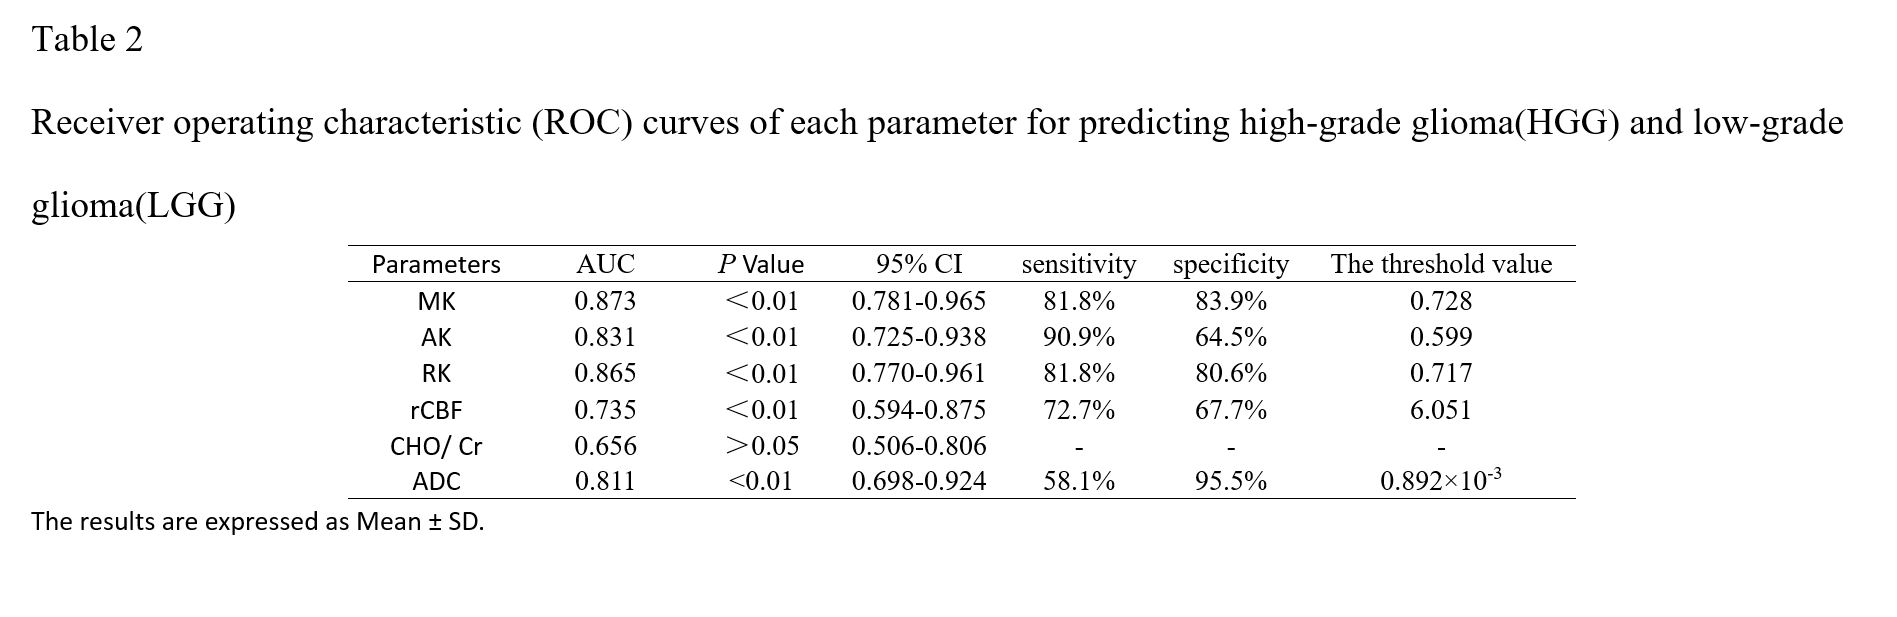
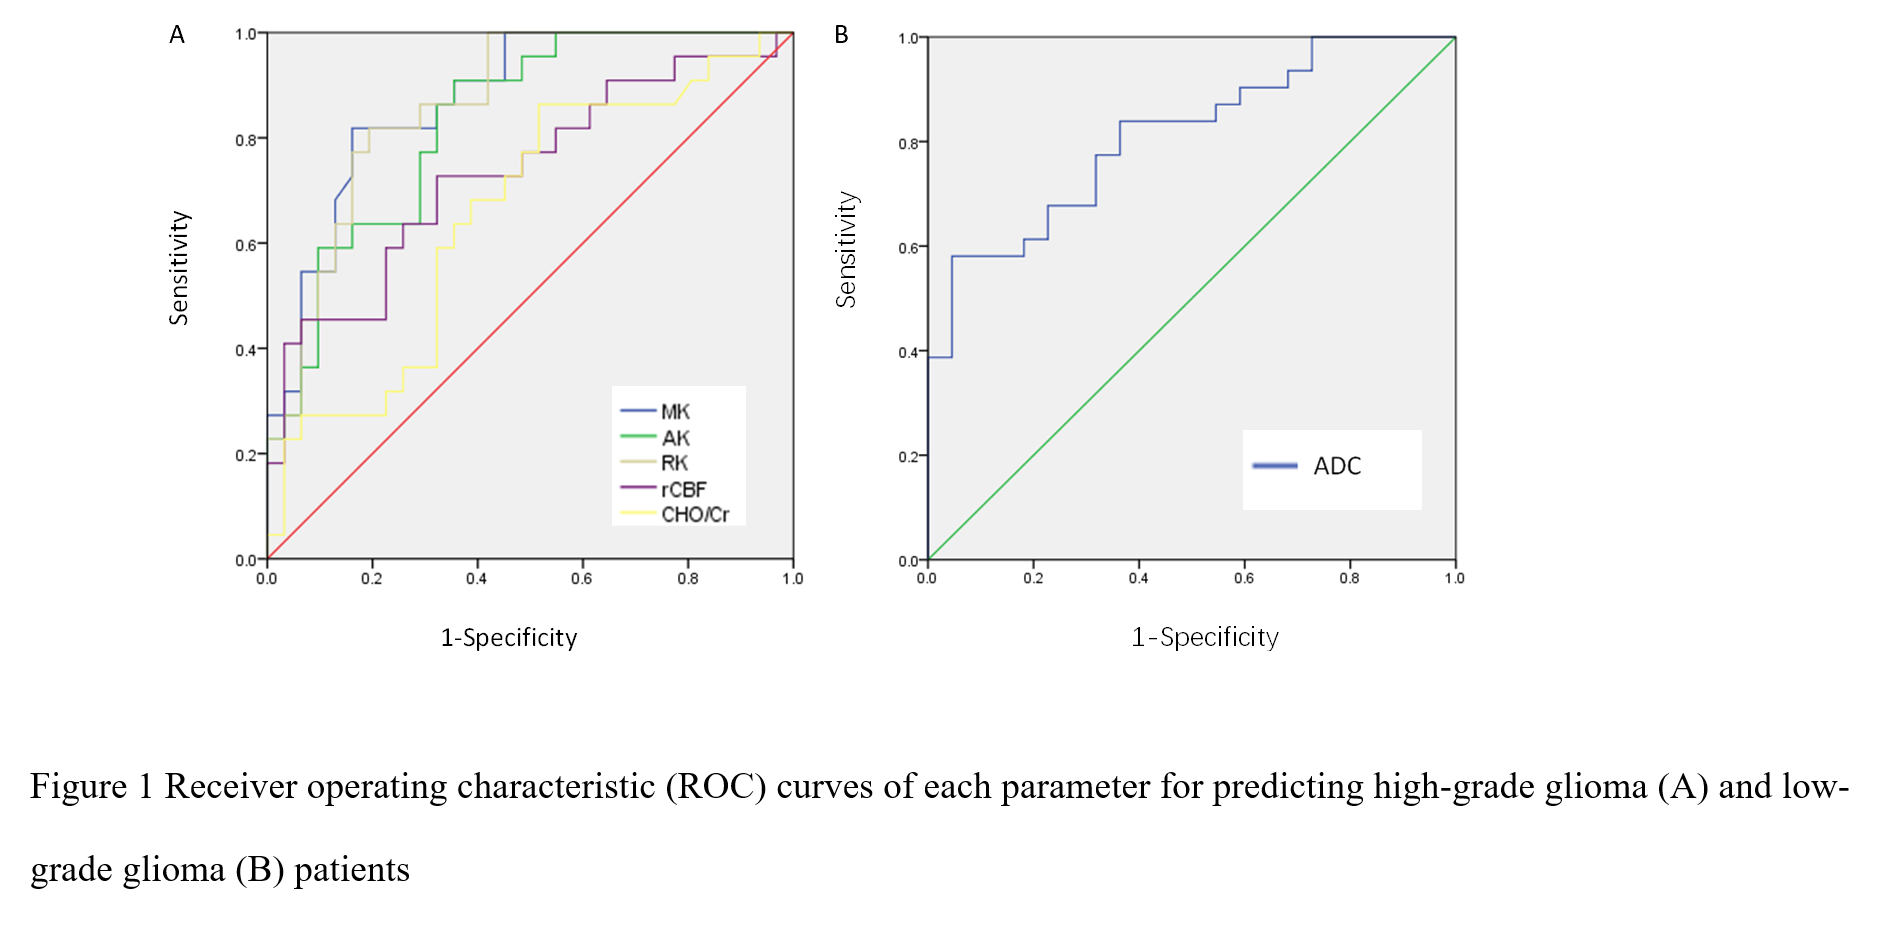
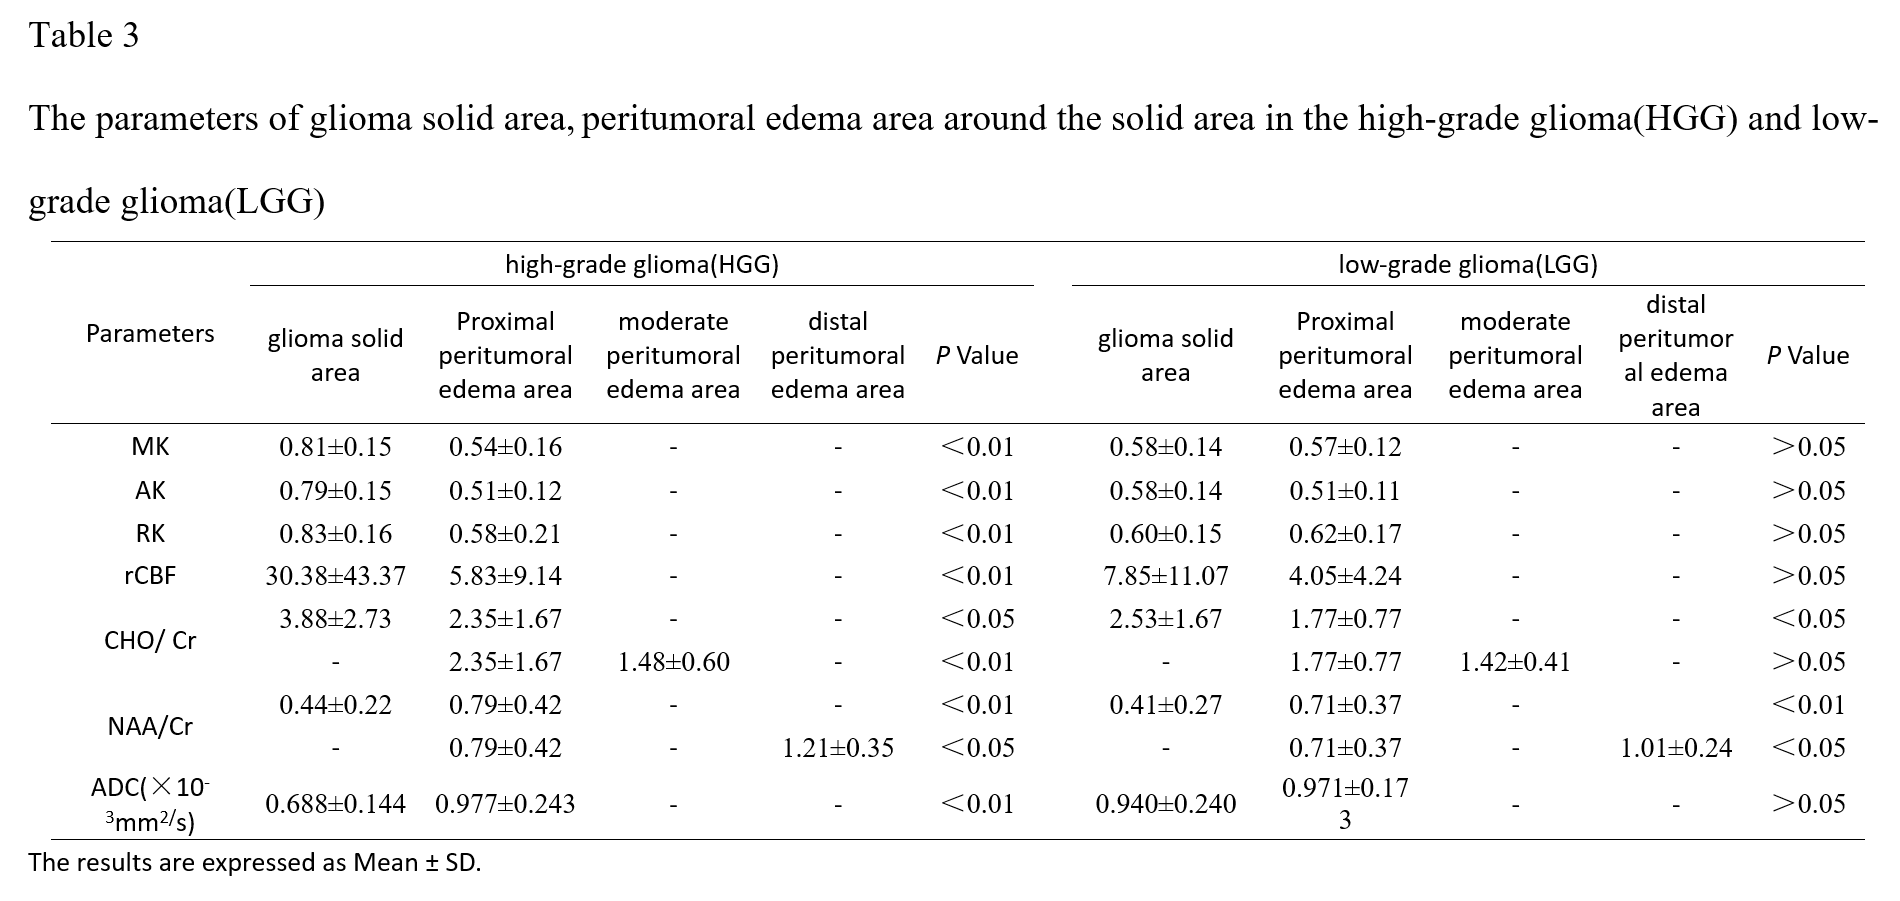
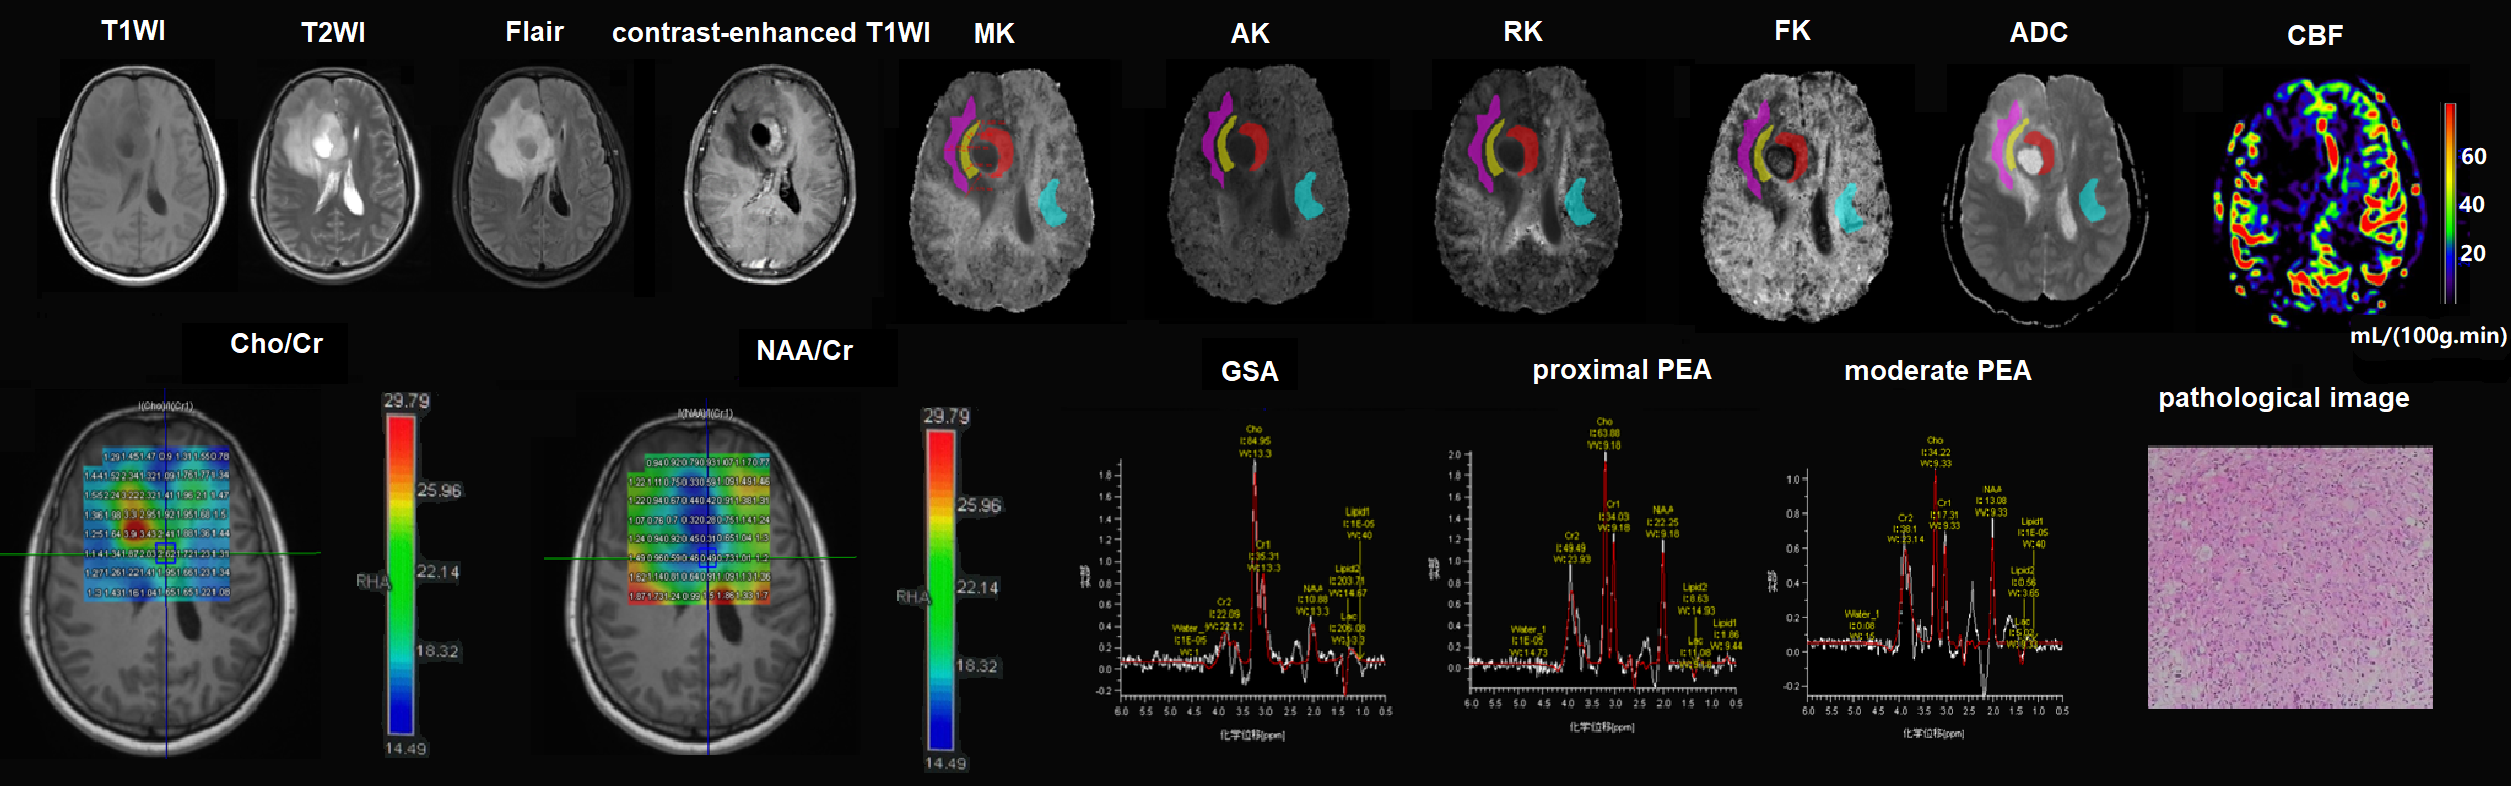
This study included 53 pathologically confirmed glioma patients, and all patients underwent conventional brain magnetic resonance imaging sequences, DKI, 3D-ASL and 1H-MRS examination before surgery on the MAGTOM Prisma 3T scanner (Siemens Healthcare, Erlangen, Germany). The scan parameters are as follows: DKI (repetition time (TR) / echo time (TE)= 2600/92ms, slice thickness = 4mm, field of view (FOV) = 240×240mm2, b= 500,1000,1500,2000 and 2500s/mm2, thirty uniformly distributed directtions for each b-value, and acquisition time = 6min46s), 3D-ASL(TR/ TE =4600/16.18ms, slice thickness = 3mm, post-label delay (PLD) time = 1990 ms, FOV=192×192mm2, acquisition time = 4min59s), 1H-MRS(TR/ TE =1700/135ms, slice thickness = 15mm, FOV = 160×160mm2, acquisition time = 6min53s). In the glioma solid area (GSA) and peritumoral edema area (PEA) around the solid area (<1cm, proximal; 1~2cm, moderate; >2cm, distal), the parameters, including apparent diffusion coefficient (ADC), mean, axis and radial kurtosis (MK, AK, RK) from DKI, relative cerebral blood flow (rCBF) from ASL, and CHO/Cr and NAA/Cr from MRS, were compared between high-grade (HGG) and low-grade gliomas (LGG) using t-test or Kruskal-Wallis test. P < 0.05 was considered statistically significant. Then, the receiver operating characteristic (ROC) curve was plotted for the significantly different indexes to calculate their sensitivity, specificity, area under the curve (AUC) and diagnostic threshold.Results
Among the enrolled 53 patients (24 females, mean age 40±15), 31 had LGG and 22 had HGG. The MK, AK, RK, rCBF and CHO/ Cr values of GSA in the HGG were higher than those in the LGG, and the ADC values of GSA in the HGG were lower than that in the LGG (P < 0.05). The MK value (AUC, 0.873; 95% CI, 0.781-0.965; P<0.01; sensitivity, 81.8%; specificity, 83.9%) had the highest diagnostic efficacy for HGG, with a threshold of 0.728. In addition, the ADC value (AUC, 0.811; 95%CI, 0.698-0.924; P<0.01; sensitivity, 58.1%; specificity, 95.5%) had a certain diagnostic value for LGG, with the threshold of 0.892×10⁻³ mm2/s. The results are shown in Table 1,2 and Figure 1. In the HGG, there were statistically significant differences in MK, AK, RK, ADC, rCBF, CHO/Cr and NAA/Cr values between the solid area and the proximal PEA, in CHO/Cr between the proximal and moderate PEA, and in NAA/Cr between moderate and distal PEA (P<0.05). In the LGG, there were statistically significant differences in NAA/Cr and CHO/Cr between the glioma solid area and the proximal PEA, and in NAA/Cr between the proximal and distal PEA (P<0.05). There was no statistical difference in every index of PEA between HGG and LGG (P>0.05). The results are shown in Table 3.Discussion and Conclusion
Our study showed that DKI, 3D-ASL and 1H-MRS can identify high-grade glioma and low-grade glioma by the parameters of the glioma solid area, and the MK and ADC values have the highest diagnostic efficacy in predicting the glioma grade. MK > 0.728 reveals a high probability of high-grade glioma, while ADC > 0.892×10⁻³ mm2/s suggests a great probability of low-grade glioma. MK represents the complexity of the tissue elements, so the higher MK in the high-grade glioma suggests the more complex elements, which is consistence with the previous study[1-5]. However, unlike this study, ADC values have not been used as a parameter index for research. In addition, through the comparison of the solid area and the different regions of peritumoral edema area, we found that the CHO/Cr value can differentiate the solid area and the proximal peritumoral edema area in both the high-grade and low-grade glioma. Moreover, it has a significant difference between the proximal and moderate peritumoral edema area in the high-grade glioma. These findings mean that there was tumor cell infiltration in the proximal peritumoral edema area. This is similar to the conclusion of Blystad I et al [6]. They found that there was a significant statistical difference between peritumoral edema area and normal appearing white matter by using quantitative R1‑difference‑maps. In contrast, our study divided PEA into three regions in detail, proximal, moderate and distal. We also found that CHO/Cr values can be regarded as a noninvasive and effective supplementary method to evaluate the invasive boundary of the glioma. Association studies of this are still rare. It is suggested that the range of surgical resection is to maximize the removal of the GSA and the PEA within 1cm under the premise of ensuring the functional area of the brain.Acknowledgements
We sincerely thank all those who have contributed to this research project.References
[1] Delgado AF, Fahlstrom M, Nilsson M, et al. Diffusion Kurtosis Imaging of Gliomas Grades II and III - A Study of Perilesional Tumor Infiltration, Tumor Grades and Subtypes at Clinical Presentation[J]. Radiol Oncol,2017,51(2):121-129.
[2] Jiang R, Jiang J, Zhao L, et al. Diffusion kurtosis imaging can efficiently assess the glioma grade and cellular proliferation[J]. Oncotarget,2015,6(39):42380-42393.
[3] Qi XX, Shi DF, Ren SX, et al. Histogram analysis of diffusion kurtosis imaging derived maps may distinguish between low and high grade gliomas before surgery[J]. Eur Radiol,2018,28(4):1748-1755.
[4] Van Cauter S, Veraart J, Sijbers J, et al. Gliomas: diffusion kurtosis MR imaging in grading[J]. Radiology,2012,263(2):492-501.
[5] Zhao J, Wang YL, Li XB, et al. Comparative analysis of the diffusion kurtosis imaging and diffusion tensor imaging in grading gliomas, predicting tumour cell proliferation and IDH-1 gene mutation status[J]. J Neurooncol,2019,141(1):195-203.
[6] Blystad I, Warntjes JBM, Smedby O, et al. Quantitative MRI using relaxometry in malignant gliomas detects contrast enhancement in peritumoral oedema[J]. Sci Rep,2020,10(1):17986.
Figures