3131
Molecular subgrouping of pediatric medulloblastoma by APT radiomics1Key Laboratory for Biomedical Engineering of Ministry of Education, Department of Biomedical Engineering, College of Biomedical Engineering & Instrument Science, Zhejiang University, Hang Zhou, Zhejiang, China, 2Department of Radiology, Children’s Hospital, Zhejiang University School of Medicine, Hang Zhou, Zhejiang, China, 3Department of Neurosurgery, Children’s Hospital, Zhejiang University School of Medicine, Hang Zhou, Zhejiang, China, 4Philips Healthcare, Shanghai, China
Synopsis
APT imaging and its derived metric maps were applied to identify molecular subgroups of medulloblastoma for the first time. Thirty-eight newly-diagnosed pediatric patients with medulloblastoma were enrolled in this study and scanned on a 3T scanner. We implemented a radiomic analysis of the APT-related metric maps, with initial regions of interest delineated by an experienced radiologist and then shrunk automatically. After feature extraction and selection, five different classifiers were tested with both single-metric and multi-metric maps. We successfully established predictive models to differentiate the subgroups of medulloblastoma with good accuracy of 0.754.
Introduction
Chemical Exchange Saturation Transfer (CEST) imaging is an emerging MRI technique that can detect various biomolecules in vivo(1). Amide Proton Transfer (APT) imaging is a variant of CEST imaging, which can probe proteins and peptides noninvasively(2). Previous studies have used MR imaging features of the tumor location and enhancement pattern(3), and radiomic signature of conventional T2-weighted (T2w) and contrast-enhanced T1-weighted (T1w) images(4) for predicting molecular subgroups of pediatric medulloblastoma. In this work, we implemented a radiomic analysis of APT-related metric maps to identify molecular subgroups of pediatric medulloblastoma.Materials & Methods
Patients: This study was approved by the local Institutional Review Board. We enrolled a cohort of 38 patients with newly-diagnosed medulloblastoma from February 2018 to July 2021. This cohort comprised 25 males (age: 5.83±3.67 years) and 13 females (age: 5.83±3.67 years), including two WNT, twelve SHH, seven G3, and seventeen G4 patients (Table 1). Owing to the number of WNT subjects being much smaller than other subgroups, we combined them with the G4 group based on their similar risk stratification and prognosis(5).MRI data acquisition and analysis: All experiments were performed on a 3T Philips Achieva scanner, with guardian consent forms obtained from all participants. The key scanning parameters were as follows: RF saturation power/duration=2uT/0.8sec, TR/TE=3000/6.7ms, FOV=230x230mm2, slice thickness=6mm, 63 frequency offsets from -6 to 80ppm, and total acquisition duration=3.2 min. Quantitative T1 and T2 values were calculated from the acquired “MIX” sequence(6). Several APT-related metric maps, including CESTR, CESTfc, CESTRnr, MTRRex, and AREX were calculated with the reference signal at -3.5ppm and the label signal at 3.5ppm(7-9).
Tumor segmentation and semi-automatic processing: The regions of interest (ROI) were initially delineated on APT source images by an experienced radiologist with T1w images as a reference. Then, the automatic ROI-shrinking algorithm was applied to choose subregions in which the APT signal intensity was higher than a user-defined histogram threshold(10). In our experiment, we generated a series of sub-ROIs using enumerated percentiles of the histogram as the cutoff, which ranged from 0th to 95th with a step-size of 5th.
Radiomics feature extraction: A total of 464 features were extracted by using Pyradiomics(11) within each generated sub-ROI of every single metric map, including 9 two-dimensional shape features, 18 first-order statistical features, 22 GLCM features, 16 GLRLM features, 16 GLSZM features, 14 GLDM features, and 5 NGTDM features. The first-order statistical features and texture features were extracted from both the original image and four wavelet-transformed images of every single metric map. All features were mapped to 0-1 by using Min-Max normalization.
Feature selection and modeling: A feature selection & modeling method with 5-fold stratified cross-validation was implemented on a single-metric feature set or multi-metric feature set. A recursive feature elimination (RFE) method was implemented on the training set by fitting a multi-class support vector machine model to get a feature ranking. With the thirty top-ranked features selected in each RFE process, we trained five classifiers (multi-class decision tree, multi-class K nearest neighbor, multi-class support vector machine, multi-class logistic regression, and multi-class linear discriminant analysis) with different numbers of features from one to thirty, respectively. The trained models were then evaluated on the validation set for the 3-group (SHH, G3, and G4) classification accuracy. The feature selection and validation process were repeated 100 times with the 5-fold data partition randomly shuffled, with the mean classification accuracy assessed for both single-metric and multi-metric feature sets.
Results
Figure 1 displays conventional anatomical T1-weighted images, T2-weighted images, and APT-related metric maps (CESTR, CESTfc, CESTRnr, MTRRex, and AREX) from representative patients of the three medulloblastoma subgroups. Figure 2 illustrates the whole process of this work, including image data preparation, feature extraction, and feature selection & classification. A heatmap of the mean classification accuracy using five different classifiers constructed with the five single metric maps is displayed in Figure 3. In conjunction with the AREX metric map, the multi-class logistic regression classifier achieved the highest accuracy of 0.733 among all combinations. In addition, Table 2 shows the performance of the five different classifiers constructed with multi-metric maps. We found that the highest 3-subgroup classification accuracy (0.754) was obtained by using the multi-logistic regression model constructed with the combined feature set of CESTfc and AREX maps.Discussion & Conclusion
So far, all previous studies have used radiological descriptors(12) or radiomic features based on conventional MR modalities to differentiate the molecular subgroups of medulloblastoma. To the best of our knowledge, this is the first study to implement a radiomic analysis based on APT imaging and its related metric maps for subgrouping medulloblastoma. The results demonstrated that the radiomic models could achieve relatively good performance in identifying the molecular subgroups of pediatric medulloblastoma. Among all tested classifiers and APT metric maps, the combination of AREX and multi-logic regression obtained the best results. In addition, the multi-metric strategy improved the classification accuracy compared to the single-metric approach. In conclusion, APT MRI is a potential biomarker for differentiating the molecular subgroups of pediatric medulloblastoma noninvasively.Acknowledgements
NSFC grant numbers: 61801421 and 81971605. Leading Innovation and Entrepreneurship Team of Zhejiang Province: 2020R01003. This work was supported by the MOE Frontier Science Center for Brain Science & Brain-Machine Integration, Zhejiang University.References
1. Van Zijl PC, Yadav NN. Chemical exchange saturation transfer (CEST): what is in a name and what isn't? Magnetic resonance in medicine 2011;65(4):927-948.
2. Zhou J, Zhu H, Lim M, Blair L, Quinones‐Hinojosa A, Messina SA, Eberhart CG, Pomper MG, Laterra J, Barker PB. Three‐dimensional amide proton transfer MR imaging of gliomas: initial experience and comparison with gadolinium enhancement. Journal of Magnetic Resonance Imaging 2013;38(5):1119-1128.
3. Perreault S, Ramaswamy V, Achrol AS, Chao K, Liu TT, Shih D, Remke M, Schubert S, Bouffet E, Fisher PG, Partap S, Vogel H, Taylor MD, Cho YJ, Yeom KW. MRI surrogates for molecular subgroups of medulloblastoma. AJNR Am J Neuroradiol 2014;35(7):1263-1269.
4. Iv M, Zhou M, Shpanskaya K, Perreault S, Wang Z, Tranvinh E, Lanzman B, Vajapeyam S, Vitanza NA, Fisher PG. MR imaging–based radiomic signatures of distinct molecular subgroups of medulloblastoma. American Journal of Neuroradiology 2019;40(1):154-161.
5. Ramaswamy V, Remke M, Bouffet E, Bailey S, Clifford SC, Doz F, Kool M, Dufour C, Vassal G, Milde T, Witt O, von Hoff K, Pietsch T, Northcott PA, Gajjar A, Robinson GW, Padovani L, Andre N, Massimino M, Pizer B, Packer R, Rutkowski S, Pfister SM, Taylor MD, Pomeroy SL. Risk stratification of childhood medulloblastoma in the molecular era: the current consensus. Acta Neuropathol 2016;131(6):821-831.
6. In den Kleef JJ, Cuppen JJ. RLSQ: T1, T2, and rho calculations, combining ratios and least squares. Magnetic resonance in medicine 1987;5(6):513-524.
7. Zhou J, Blakeley JO, Hua J, Kim M, Laterra J, Pomper MG, van Zijl PC. Practical data acquisition method for human brain tumor amide proton transfer (APT) imaging. Magnetic resonance in medicine 2008;60(4):842-849.
8. Keupp, J, Togao O. Magnetization Transfer Ratio based Metric for APTw or CESTw MRI Suppressing Signal from Fluid Compartments - Initial Application to Glioblastoma Assessment. ISMRM(2018):3156 2018.
9. Heo HY, Lee DH, Zhang Y, Zhao X, Jiang S, Chen M, Zhou J. Insight into the quantitative metrics of chemical exchange saturation transfer (CEST) imaging. Magnetic resonance in medicine 2017;77(5):1853-1865.
10. Ruibin Liu , Xianlong Wang , Zhibo Wen , Tingting Liu , Jinyuan Zhou , Dan Wu , Zhang Y. Comparison of Different CEST Metrics for Brain Tumor Grading with Semi-Automatic ROIs. ISMRM(2019):3992 2019.
11. van Griethuysen JJM, Fedorov A, Parmar C, Hosny A, Aucoin N, Narayan V, Beets-Tan RGH, Fillion-Robin JC, Pieper S, Aerts H. Computational Radiomics System to Decode the Radiographic Phenotype. Cancer Res 2017;77(21):e104-e107.
12. Dasgupta A, Gupta T, Pungavkar S, Shirsat N, Epari S, Chinnaswamy G, Mahajan A, Janu A, Moiyadi A, Kannan S, Krishnatry R, Sastri GJ, Jalali R. Nomograms based on preoperative multiparametric magnetic resonance imaging for prediction of molecular subgrouping in medulloblastoma: results from a radiogenomics study of 111 patients. Neuro Oncol 2019;21(1):115-124.
Figures
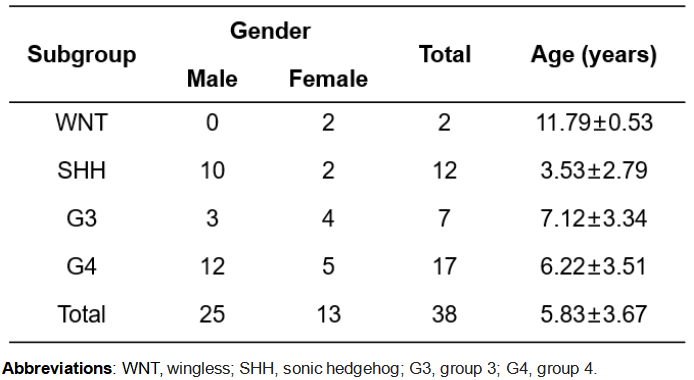
Table 1. Patient Demographics
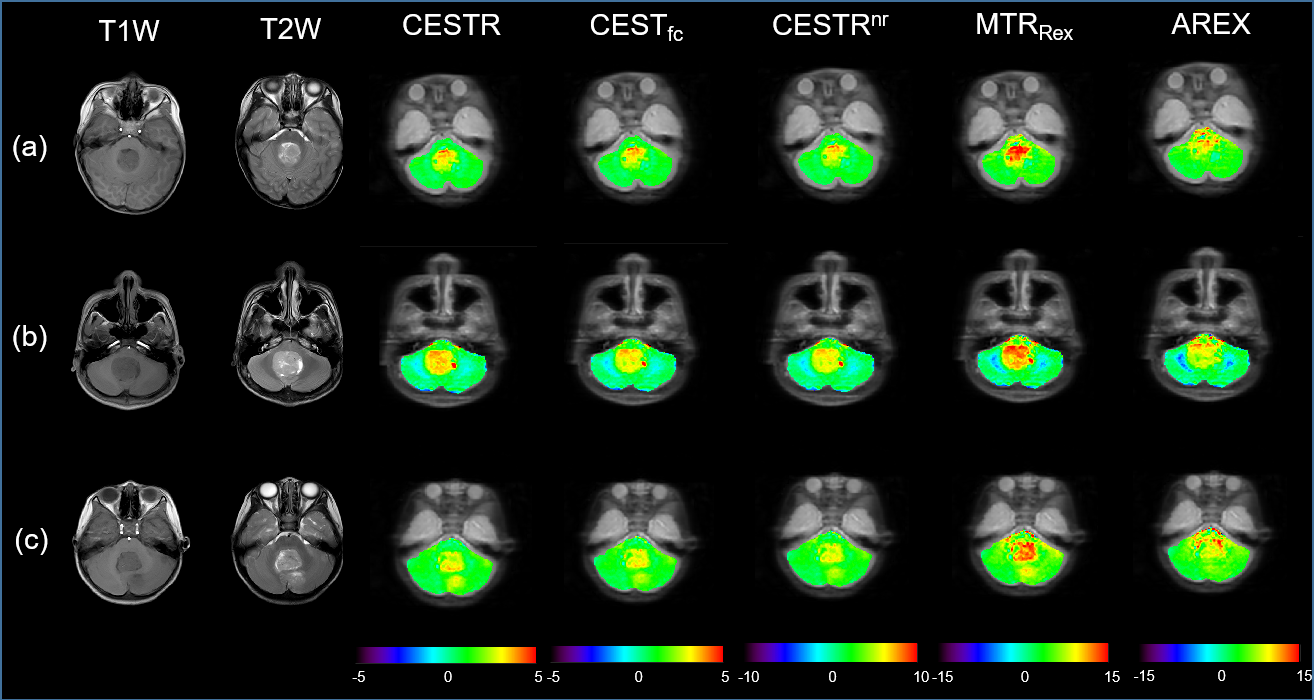
Figure 1. Anatomical and APT-related images of patients with SHH (a), G3 (b), and G4 (c) medulloblastomas, respectively. Columns 1 and 2 display conventional anatomical T1-weighted and T2-weighted images, respectively. Columns 3 to 7 show CESTR, CESTfc, CESTRnr, MTRRex, and AREX metrics maps, respectively, overlaid on the APT source image.
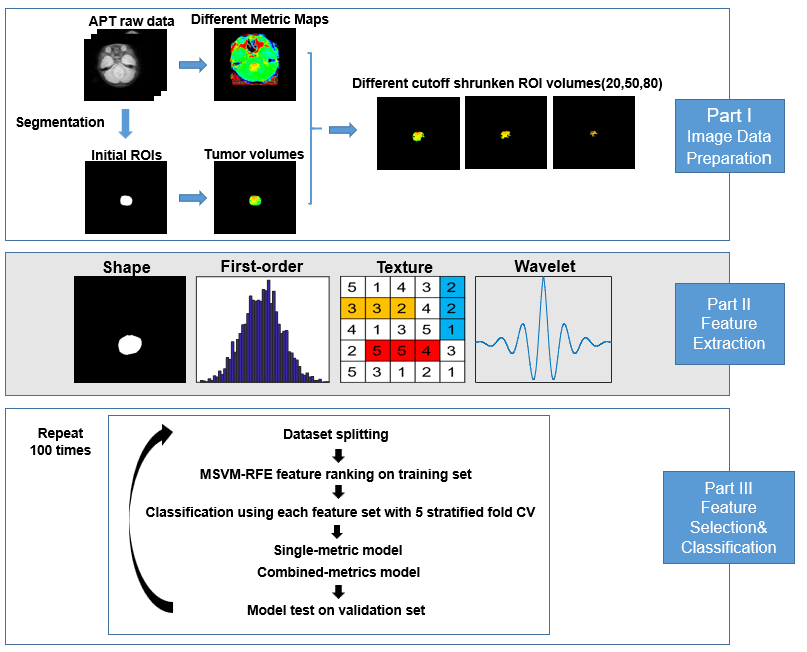
Figure 2. Flowchart of the whole process.
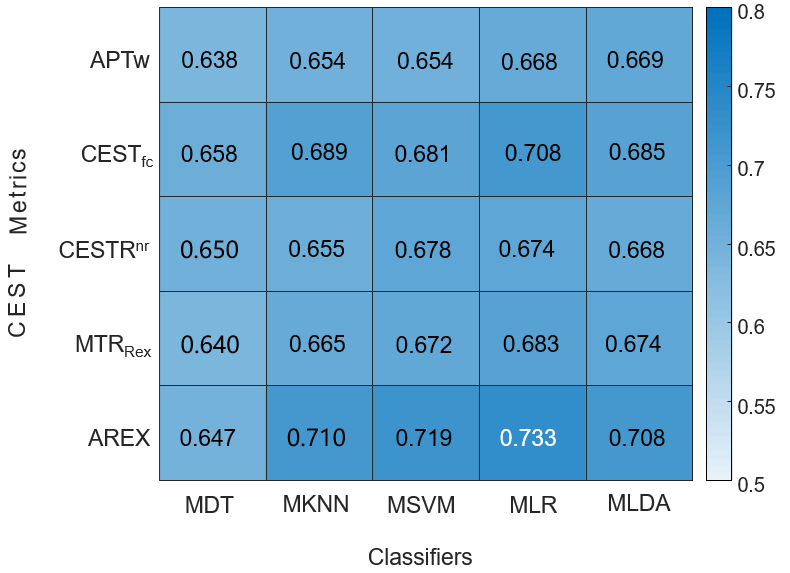
Figure 3. The heatmap of the mean classification accuracy from 100 runs using five different classifiers constructed with different single metric maps. MDT, multi-class decision tree; MKNN, multi-class K nearest neighbor; MSVM, multi-class support vector machine; MLR, multi-class logistic regression; MLDA, multi-class linear discriminant analysis.
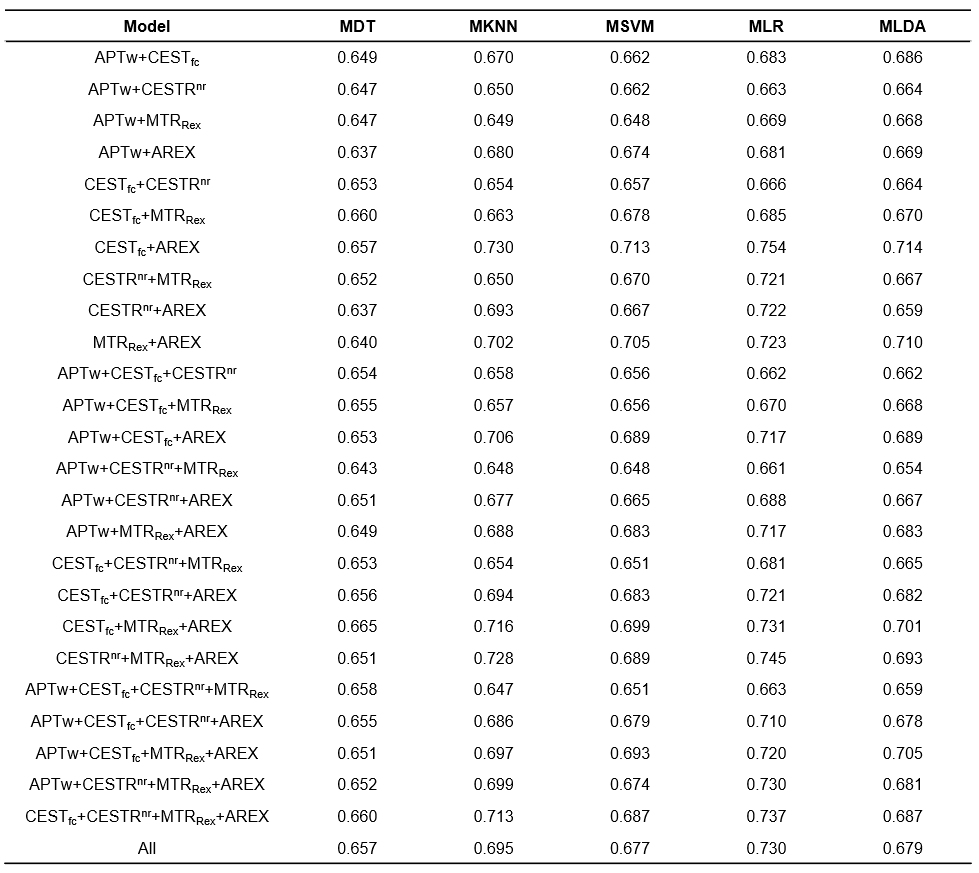
Table 2. Mean classification accuracy of different classifiers constructed with multi-metric maps