3130
Combined 7T CEST/MRS imaging to predict tumor metabolism in glioma1Department of Neurosurgery, Huashan Hospital, Fudan University, Shanghai, China, 2Siemens Healthineers Ltd., Shanghai, China, 3Siemens Healthcare GmbH, Erlangen, Germany, 4Institute of Science and Technology for Brain-Inspired Intelligence, Fudan University, Shanghai, China, 5Human Phenome Institute, Fudan University, Shanghai, China
Synopsis
Magnetic resonance imaging has been applied in intraoperative neuro-navigation and irradiation guidance in glioma diagnosis. The contrast-enhanced MRI or peritumor edema on T2w image is not precise enough to delineate tumor infiltration. MR spectroscopy (MRS) and chemical exchange saturation transfer (CEST) have been used to evaluate tumor metabolism. Studies showed that amino acid PET surpassed conventional MR imaging for tumor delineation. Here, we explored the correlation between MRS and CEST at 7T and chose PET as gold standard to investigate multimodal MR imaging for glioma metabolic characteristics and tumor extent. An exemplary case with stereotactic biopsy proof was shown.
Introduction
Glioma is the most common malignant intradural tumor, with an incidence of about 6 per 100,000. Surgery serves as the first-line treatment for debulking tumors and obtaining tissues for pathology analysis. It has achieved widely consensus that the extent of tumor removal is positively correlated with patient survival and residues surrounding tumor margin always lead to early recurrence1. Therefore, precise delineation of tumor infiltration essentially guides clinical decision-making in glioma treatment. Because the blood-brain barrier (BBB) remains intact in tumor regions regardless of glioma grade, the enhanced signal on post-contrast T1 images is not precise enough to delineate tumor infiltration. It is difficult to discriminate tumor infiltration from peritumor edema on T2 flair images. Studies have shown that amino acid PET surpassed conventional MR imaging for tumor delineation, especially in areas outside enhanced regions. Both proton MR spectroscopy (MRS) and amide proton transfer CEST (APTCEST) have been used to evaluate tumor metabolism2,3. In this study, we investigate a non-invasive diagnostic method using MRS and CEST at 7T for glioma tumor delineation, thus assisting precise resection as well as irradiation.Material and methods
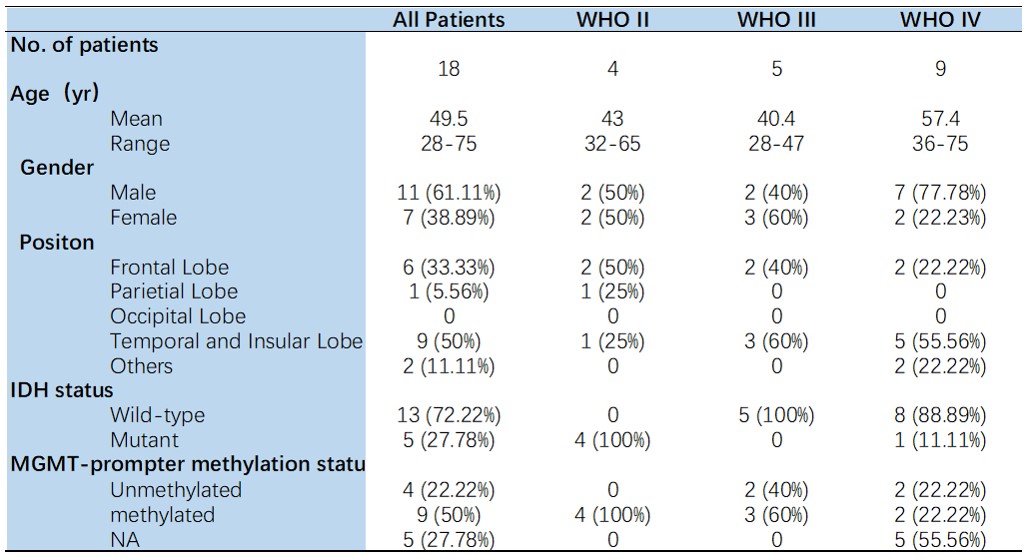
This study was approved by the local institutional ethics committee, and written informed consent was obtained from all patients. A total of eighteen patients (seven females, eleven males; median age, 59 years; age range, 28–75 years, see Table 1) were recruited. All patients underwent surgical biopsy or resection for definitive histopathologic diagnoses. Contrast enhanced T1-weighted images and MR spectroscopy (PRESS; TR= 1000ms, TE= 144 ms, and resolution=13.3mm x13.3mmx15mm) were acquired at 3T (GE MR750 or Philips Ingenia). An amino acid PET (18F-FET or 11C-MET) was performed (Biograph 128 PET/CT system, Siemens, Erlangen, Germany). High-resolution T1-weighted images (MP2RAGE; TR=3800 ms, TI1=800ms, TI2=2700ms, TE=2.29ms, FA=7°, and resolution=0.7mm isotropic), T2-weighted images (SPACE; TR=4000ms, TE=118ms, and resolution=0.67mm isotropic), and CEST imaging (prototype sequence; TR=3.4ms, TE=1.59ms,FA=6°,and resolution=1.6mm x 1.6mm x 5mm, 56 RF offsets, and B1=0.6, 0.75, 0.9mT) were acquired at 7T (MAGNETOM Terra, Siemens Healthineers, Erlangen, Germany). APT CEST data was quantified using the Lorentzian fit method with B1 correction4. Regions of interest (ROIs) were chosen based on FOV of MRS. The standardized uptake value (SUV) > 1.6 in amino acid PET was chosen as true tumor extent in receiver operating characteristic (ROC) curves analysis. The Cho/NAA ratio in MRS, the APT in CEST, and the tumor probability were metrics for predicting tumor presence. The tumor probability map, which was calculated from both MRS and CEST, was built by a Least-squares boosting model5. The histology results were shown using H&E stain.Results
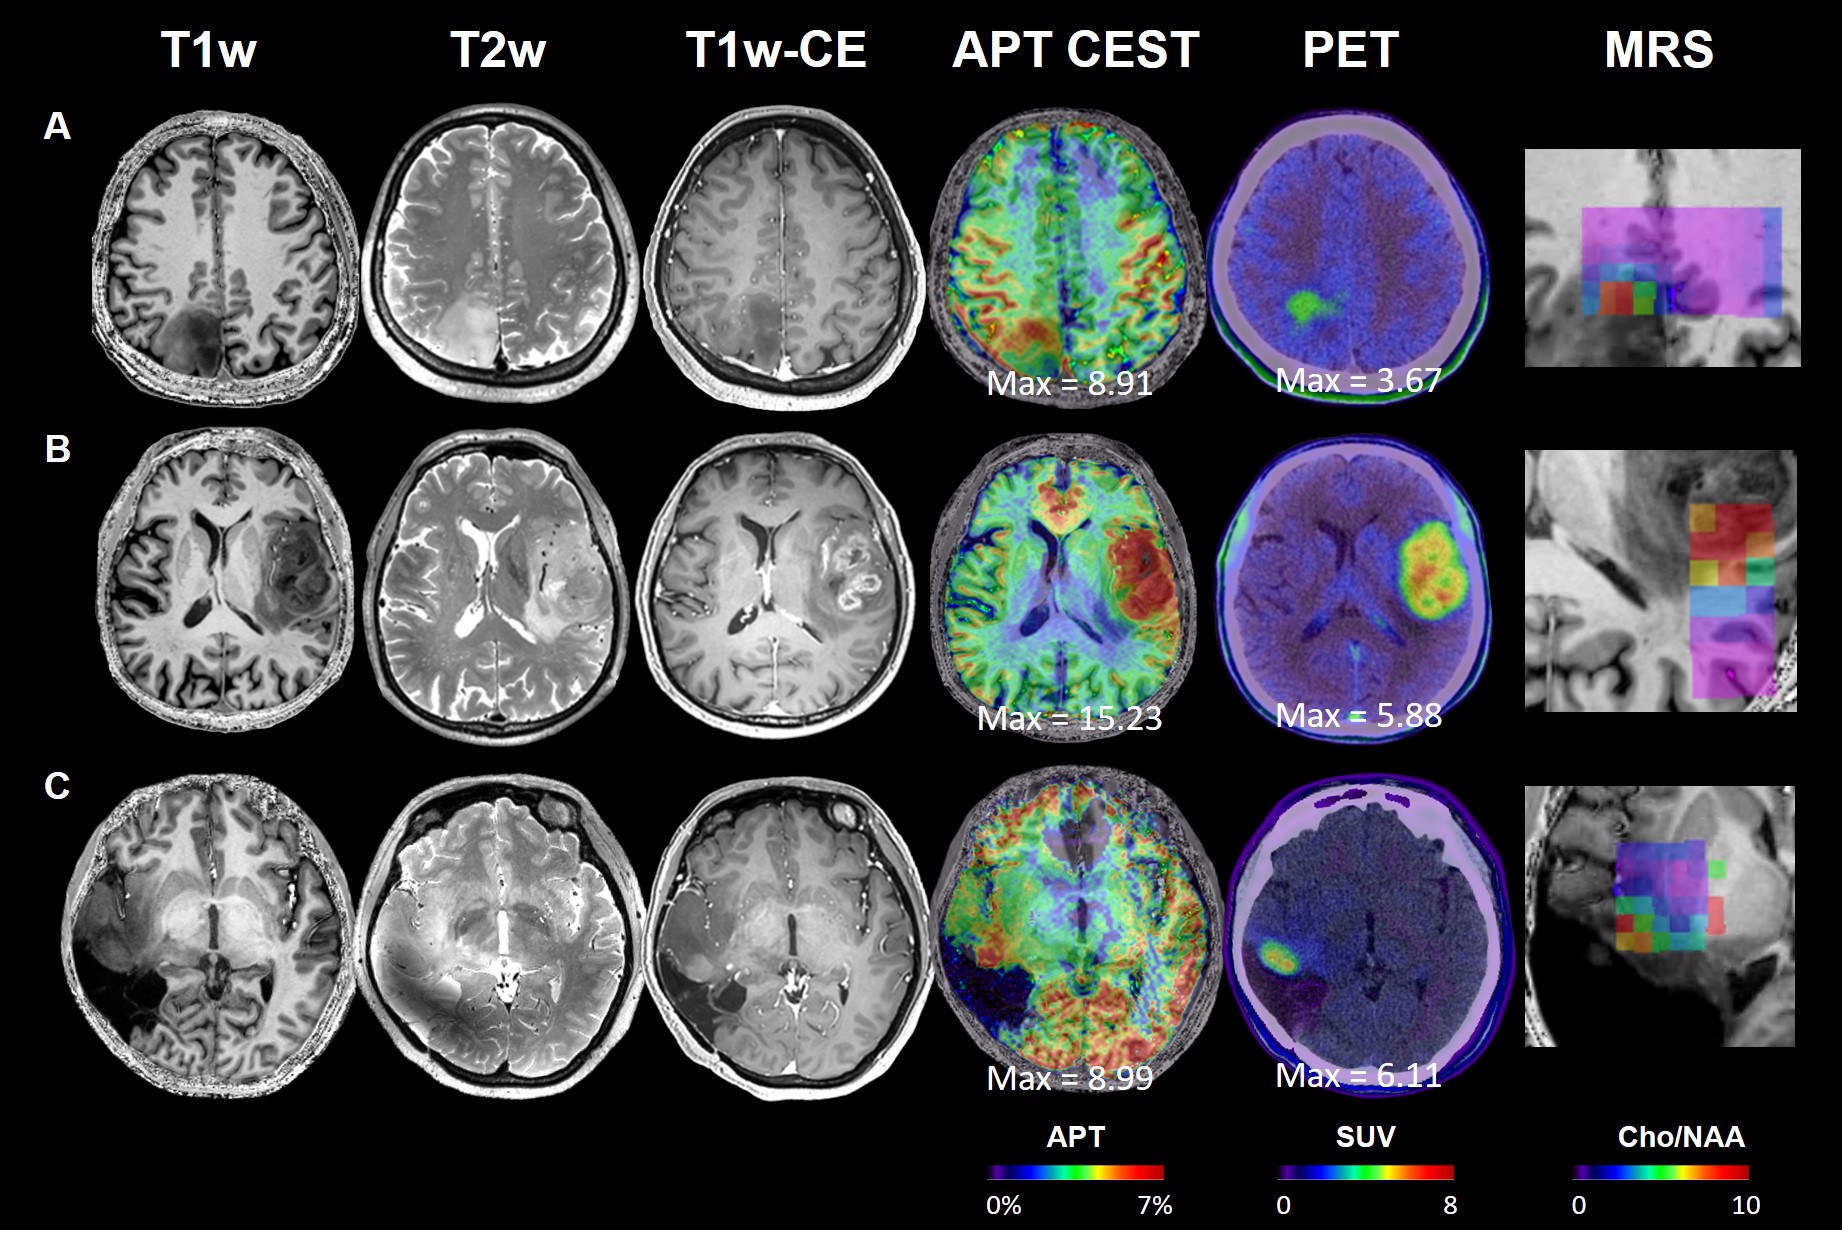
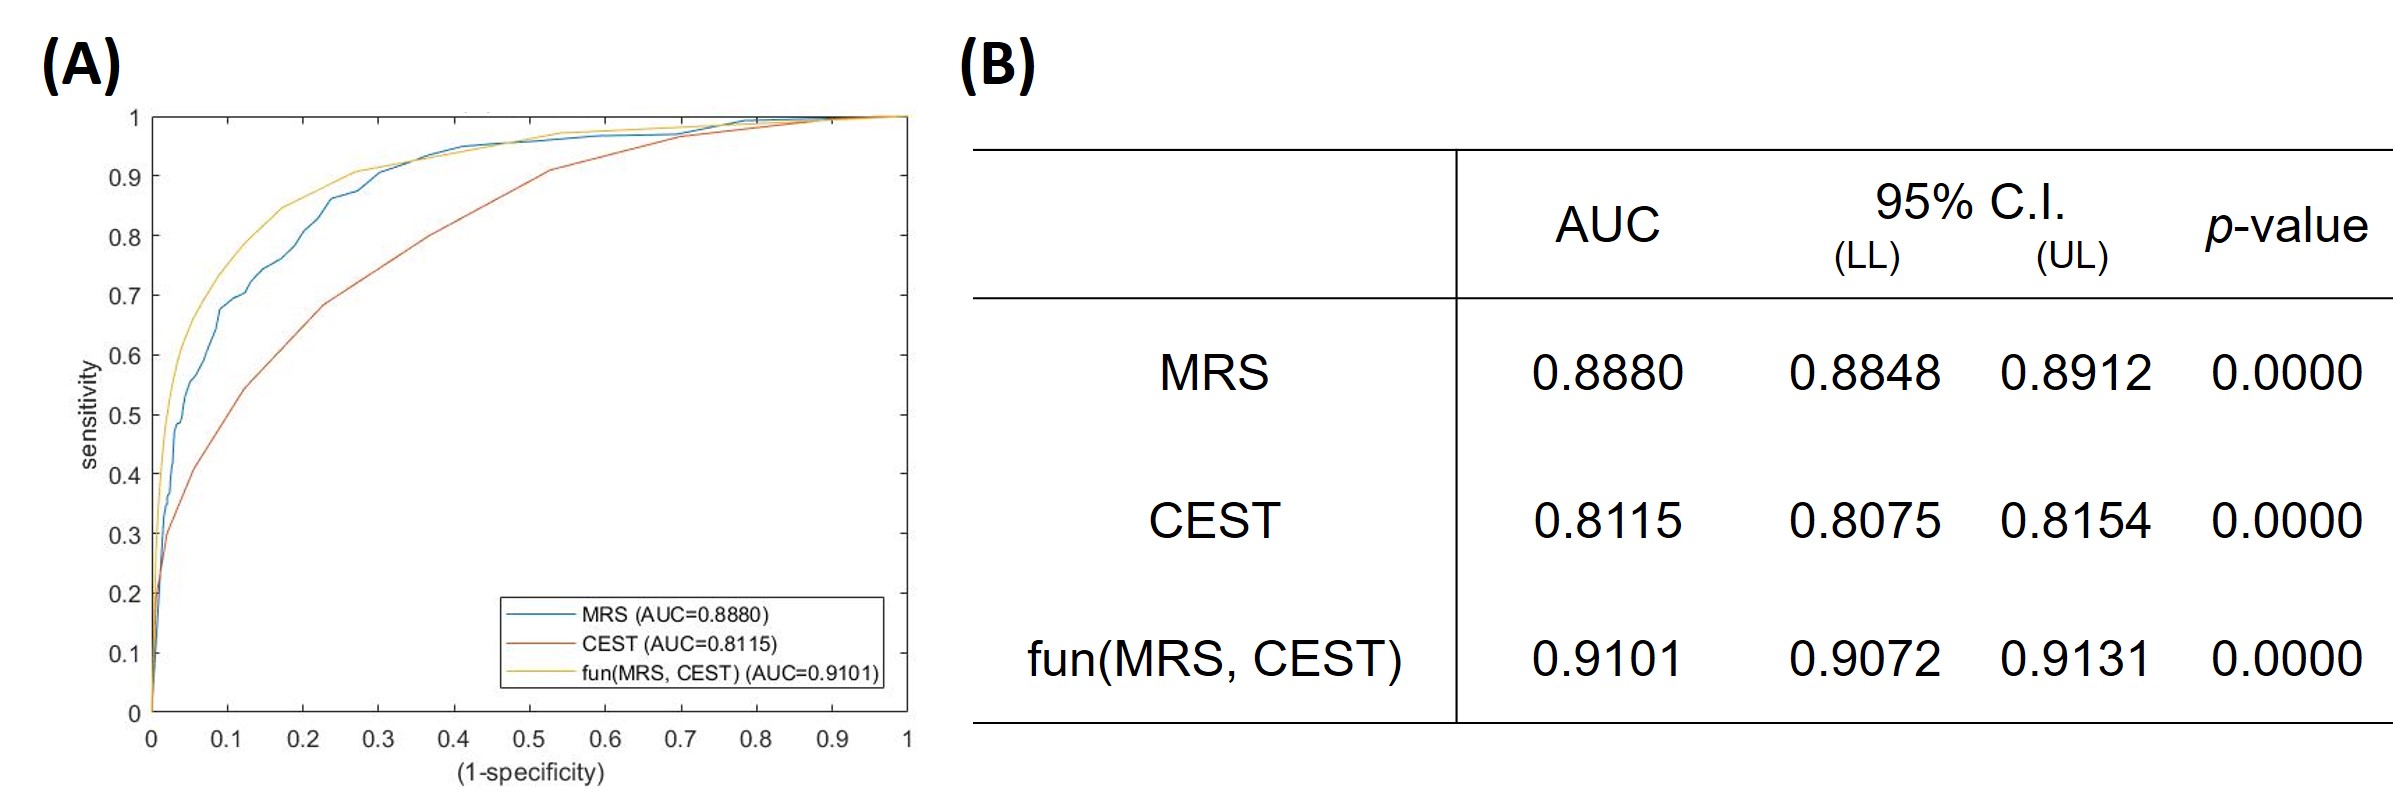
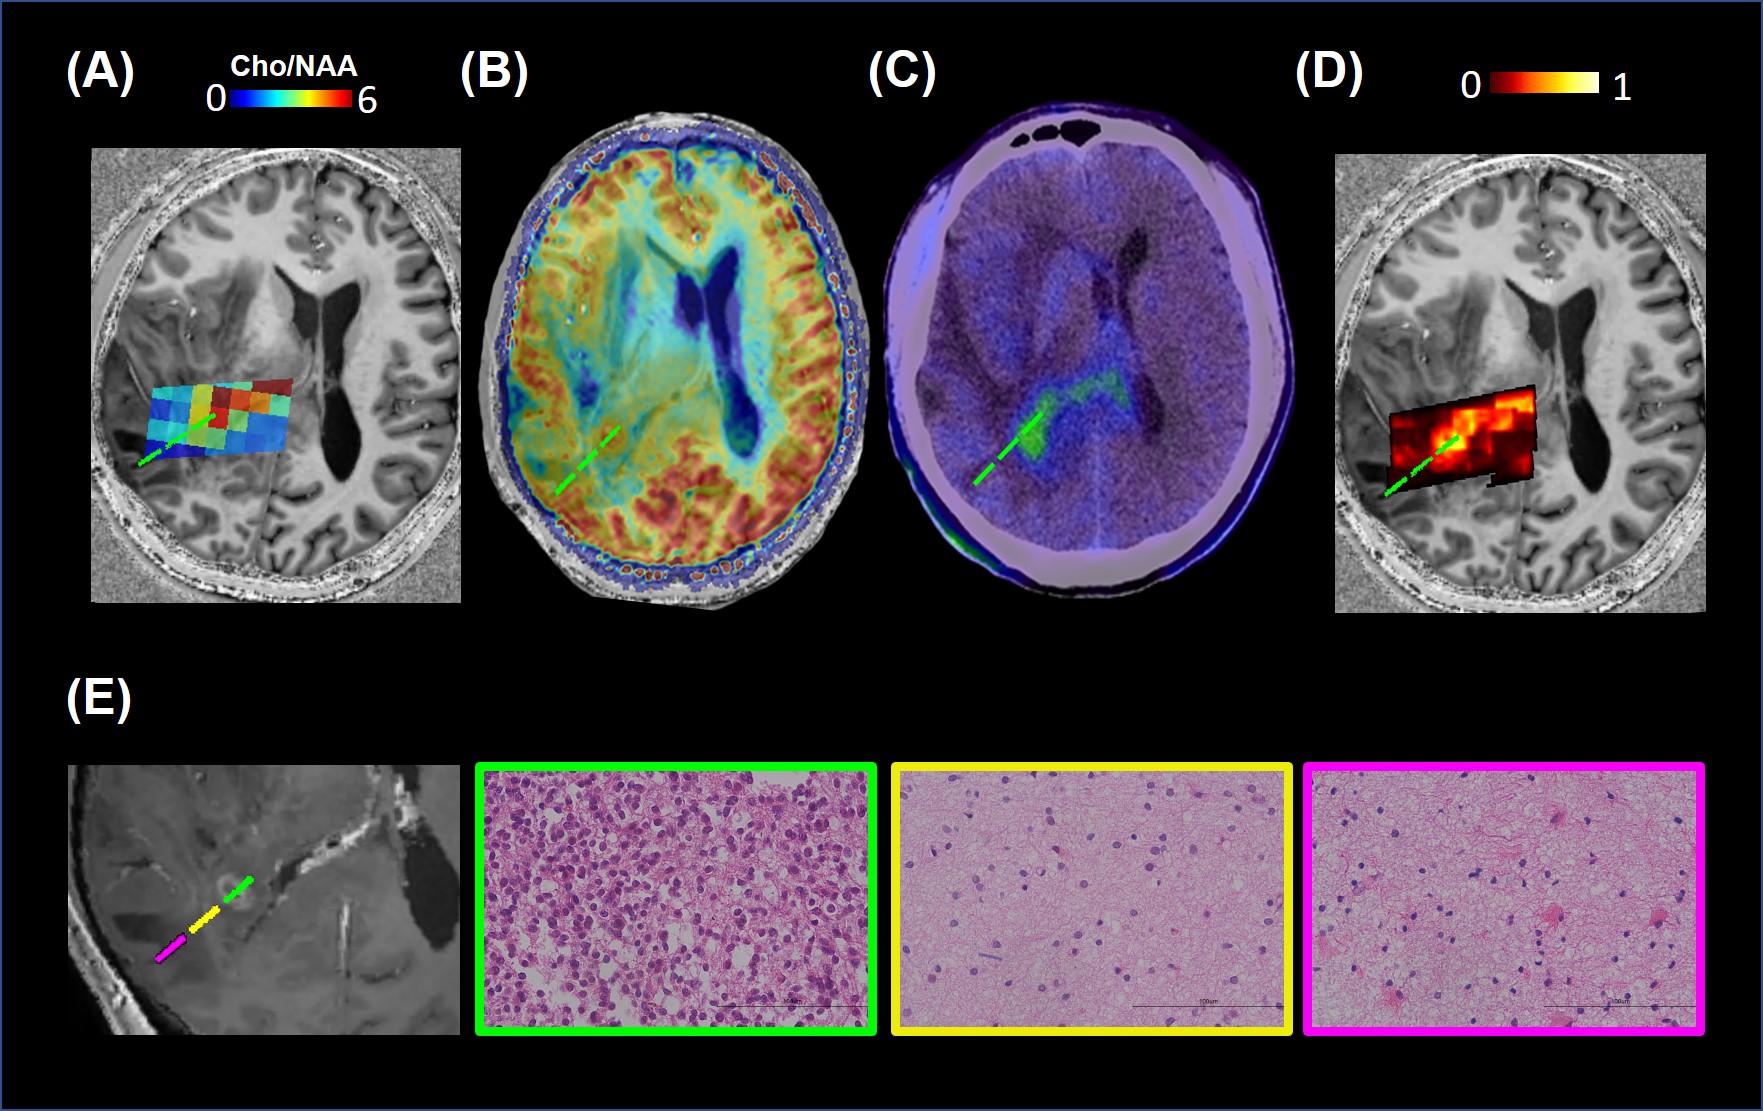
The representative images of conventional MR, CEST, MRS, and PET were shown in Figure 1. The max CEST value within the lesion in glioblastoma was higher than the other two (15.23 vs 8.99, 8.91). The SUV values were also correlated to the tumor grade. In Figure 2, using PET as the gold standard of tumor presence, we plotted ROC curves to evaluate the diagnostic accuracy of CEST and MRS. Voxel-wise analysis showed that the AUC of CEST and MRS was 0.8115 (95% CI: 0.8075-0.8154) and 0.8880 (95% CI: 0.8848-0.8912), respectively. The tumor probability map, a combination of MRS and CEST, elevated the AUC to 0.9101 (95% CI: 0.9072-0.9131). An exemplary case with three sample points using stereotactic biopsy was presented in Figure 3. The tumor probability map shows high probability (64.50%) in Point 1, which was located in tumor core according to contrast-enhanced T1 imaging. H&E staining of the biopsy tissue confirmed tumor cell accumulation with highly nuclear atypia, indicating high proliferative activity of the tumor. Point 2 with lower probability (14%) was located at 2 cm away contrast-enhancing area, where was usually considered as peri-tumor zone. Histology shows that tumor presence with mild nuclear atypia. There was no tumor presence in point 3 and H&E staining revealed scattered suspected tumor cells with the lowest cell density with seldom nuclear atypia.Discussion
PET has been demonstrated to gain an advantage in defining tumor extent, but low spatial resolution limits its detailed guidance for tumor resection. Although MRS was also reported to navigate glioma metabolic boundary, it is routinely present in a single slice and insufficient to delineate tumor in a three-dimensional way. By contrast, it has been reported that APT CEST was able to indicate glioma infiltration at the ultra-high-field with high spatial resolution. In this study, we found a satisfactory spatial correlation between APT CEST and MRS in predicting metabolic characteristics, and that a combination of the two was able to improve tumor classification. Precise delineation of glioma boundary guides the extent of tumor resection and irradiation, thus having a potential impact on patient survival. We put forward APT CEST as an ideal technique delineating glioma boundary and look forward to its wide application in the future.Acknowledgements
No acknowledgement found.References
1. Stupp, R., et al. High-grade glioma: ESMO Clinical Practice Guidelines for diagnosis, treatment and follow-up. Annals of oncology 25 (2014): iii93-iii101.
2. Consolino, Lorena, et al. Non-invasive investigation of tumor metabolism and acidosis by MRI-CEST imaging. Frontiers in oncology 10 (2020): 161.
3. Bulik, Martin, et al. Potential of MR spectroscopy for assessment of glioma grading. Clinical neurology and neurosurgery 115.2 (2013): 146-153.
4. Schuenke P, Windschuh J, Roeloffs V, Ladd ME, Bachert P, Zaiss M. Simultaneous mapping of water shift and B1 (WASABI) - application to field-inhomogeneity correction of CEST MRI data. Magn Reson Med. 2017; 77(2): 571- 580.
5. Hastie, T., R. Tibshirani, and J. Friedman. The Elements of Statistical Learning, second edition. New York: Springer, 2008
Figures