3128
Changes in serial DWI MRI imaging during radiation therapy can predict treatment response in patients with head and neck cancer
Yuvnik Trada1,2, Paul Keall2, Michael Jameson3, Daniel Moses4,5, Peter Lin6,7, Phillip Clap5,8, Lois Holloway8,9, Myo Min10,11, Dion Forstner3, Allan Fowler9, and Mark Lee5,9
1Radiation Oncology, Calvary Mater Newcastle, Waratah, Australia, 2The University of Sydney, Sydney, Australia, 3GenesisCare St Vincents Hospital, Sydney, Australia, 4Department of Medical Imaging, Prince of Wales Hospital, Sydney, Australia, 5University of New South Wales, Sydney, Australia, 6Department of Nuclear Medicine and PET, Sydney, Australia, 7Western Sydney University, Sydney, Australia, 8Ingham Institute of Applied Medical Research, Liverpool, Australia, 9Liverpool Hospital, Liverpool, Australia, 10Sunshine Coast University Hospital, Sunshine Coast, Australia, 11University of Sunshine Coast, Britinya, Australia
1Radiation Oncology, Calvary Mater Newcastle, Waratah, Australia, 2The University of Sydney, Sydney, Australia, 3GenesisCare St Vincents Hospital, Sydney, Australia, 4Department of Medical Imaging, Prince of Wales Hospital, Sydney, Australia, 5University of New South Wales, Sydney, Australia, 6Department of Nuclear Medicine and PET, Sydney, Australia, 7Western Sydney University, Sydney, Australia, 8Ingham Institute of Applied Medical Research, Liverpool, Australia, 9Liverpool Hospital, Liverpool, Australia, 10Sunshine Coast University Hospital, Sunshine Coast, Australia, 11University of Sunshine Coast, Britinya, Australia
Synopsis
In head and cancer there is a need for a predictive biomarker for patients undergoing radiotherapy(RT) to allow personalisation of treatment.55 patients with HNSCC had DWI imaging performed at baseline, during (week 2, 3, 5 and 6) and post RT (1 and 3 months). Absolute and change in primary tumour ADCmean was correlated to local recurrence.Week 3 was the optimal timepoint for mid-treatment response assessment. Change in week 3 ADCmean of <24.4% predicted local recurrence; corresponding 2 year LRFS of 97% vs 42%.Changes in mid-treatment DWI imaging could be utilised in design of future adaptive clinical trials.
INTRODUCTION
Following definitive radiotherapy in mucosal head and neck squamous cell carcinoma (HNSCC), a proportion of patients still experience locoregional tumour recurrence causing significant morbidity and death.(1) Further, in those who are cured, the treatment is associated with significant acute and late toxicities.(1) There is a need for a reliable quantitative biomarker that can predict outcomes to guide adapted intensification or de-intensification of treatment based on response in HNSCC.(1) Changes in functional imaging performed during treatment has been shown to be a better biomarker of treatment response compared to pre-treatment imaging.(2-5) Studies analysing mid-treatment images have largely limited by utilising few timepoints and non-uniform methodologies.(6, 7) There is also limited data on determining the optimal time point for assessing imaging response. The aim of this study was to evaluate if tumour changes measured using a combination of diffusion-weighted imaging (DWI) MRI performed serially during definitive radiotherapy (RT) in HNSCC can predict treatment response. We also sought to find the optimal time point for assessing DWI in future imaging biomarker studies.METHODS
Data from 55 patients with HNSCC recruited into two prospective imaging biomarker studies were available for analysis. The imaging timeline utilised is shown in Figure 1. DWI was performed at baseline, during RT (week 2, 3, 5 and 6) and post RT (1 and 3 months). MRI was performed on a dedicated wide-bore 3.0-T scanner. Sequences obtained were DWI, using a readout-segmented EPI technique, using b= 50 and 800 s mm-2 with signal averages set to 1 and 3, respectively.(8) The primary tumour were volumetrically delineated by a radiation oncologist (YT) in consensus with a radiologist (DM) on ADCmaps while referencing to the co-registered b50 and T2 images as per consensus recommendations.(9)Absolute and relative change (%D) in serial DWI ADCmean were correlated to 1 year local recurrence using the Mann-Whitney U test. Strength of correlation was tested using ROC analysis. Optimal cut-off values for analysis were derived from the ROC curves aiming for best sensitivity and specificity.(17) Local recurrence-free survival (LRFS) was estimated using Kaplan-Meier analysis and compared using the log-rank (Mantel-Cox) test.RESULTS
The one year local, regional and distant recurrence rates were 18.2% (10/55), 7.3% (4/55) and 12.7% (7/55) respectively. The primary tumour ADCmean increased during radiotherapy and plateaued at week 5, see Figure 2A. The corresponding relative change in ADCmean values from baseline were: ∆Week 2 (22%), ∆Week 3 (36%), ∆Week 5 (45%), ∆Week 6 (55%), ∆Week 11 (49%) and ∆Week 19 (57%). A trend of absolute ADCmean values over time by local recurrence status is provided in Figure 3. The relative change in primary tumour ADCmean (DADCmean) at all time points except week 5 correlated to local recurrence, see Figure 2B. Difference in absolute values and relative change in ADCmean values based on local recurrence status are provided in Table 1. ∆Week 3 ADCmean (AUC 0.825, p=0.003) was the best predictors of local recurrence. Optimal cut-off values of ∆week 3 ADCmean for predicting local recurrence was <24.4% rise in primary tumour ADCmean; resulting in sensitivity of 89%, specificity of 88% and accuracy of 88%. A statistically significant difference was found on Kaplan-Meier survival analysis based on primary tumour ∆Week 3 ADCmean OC value with corresponding 2 year LRFS of 97% vs 42%, p=<0.001 (log rank).(Figure 4)DISCUSSION
Our study represents a large prospective mid-treatment imaging biomarker series utilising the most extensive DWI scans performed during radiotherapy in head and neck squamous cell carcinoma (HNSCC). Absolute values of ADCmean did not correlate with tumour control. Change in ADCmean was a better biomarker of treatment response compare to pre-treatment imaging. Change in week 3 primary tumour ADCmean had the strongest correlation to local control. Our results are consistent with previous studies that measured change in primary tumour ADCmean early during HNSCC treatment. Motaba et al and Ghany et al, performed DWI imaging at week 3 and found that DADCmean (OC 24% and 20% respectively), correlated to treatment response.(7, 10) The higher rise in ADCmean during radiotherapy in good responders is explained by greater tumour cell loss expected to continue during radiotherapy. However as radiotherapy progresses, increasing treatment related oedema would also alter the ADC signal.(11) Week 3 likely represents the optimal timepoint for assessing treatment response due to higher ratio of signal from tumour prior to onset of noise from radiotherapy related oedema. Previous studies looking to identify the optimal timepoint for DWI response assessment were limited to 2 to 3 mid-treatment imaging timepoints.(4, 5, 7, 10, 12) Patients in our study underwent extensive serial DWI during and following radiotherapy. The size of our study and number of timepoints for DWI treatment response assessment adds considerably to the current published literature.CONCLUSION
Changes in mid-treatment DWI imaging can predict treatment response and could be utilised in the design of future adaptive clinical trials. Based on our results week 3 appears to be a promising time period for mid-treatment DWI assessment of tumour response.Acknowledgements
No acknowledgement found.References
1. Morgan HE, Sher DJ. Adaptive radiotherapy for head and neck cancer. Cancers Head Neck. 2020;5:1.2. Chen SW, Hsieh TC, Yen KY, Yang SN, Wang YC, Chien CR, et al. Interim FDG PET/CT for predicting the outcome in patients with head and neck cancer. Laryngoscope. 2014;124(12):2732-8.3. King AD, Mo FK, Yu KH, Yeung DK, Zhou H, Bhatia KS, et al. Squamous cell carcinoma of the head and neck: diffusion-weighted MR imaging for prediction and monitoring of treatment response. Eur Radiol. 2010;20(9):2213-20.4. Kim S, Loevner L, Quon H, Sherman E, Weinstein G, Kilger A, et al. Diffusion-weighted magnetic resonance imaging for predicting and detecting early response to chemoradiation therapy of squamous cell carcinomas of the head and neck. Clin Cancer Res. 2009;15(3):986-94.5. Wong KH, Panek R, Dunlop A, McQuaid D, Riddell A, Welsh LC, et al. Changes in multimodality functional imaging parameters early during chemoradiation predict treatment response in patients with locally advanced head and neck cancer. Eur J Nucl Med Mol Imaging. 2018;45(5):759-67.6. Paudyal R, Oh JH, Riaz N, Venigalla P, Li J, Hatzoglou V, et al. Intravoxel incoherent motion diffusion-weighted MRI during chemoradiation therapy to characterize and monitor treatment response in human papillomavirus head and neck squamous cell carcinoma. J Magn Reson Imaging. 2017;45(4):1013-23.7. Matoba M, Tuji H, Shimode Y, Toyoda I, Kuginuki Y, Miwa K, et al. Fractional change in apparent diffusion coefficient as an imaging biomarker for predicting treatment response in head and neck cancer treated with chemoradiotherapy. AJNR Am J Neuroradiol. 2014;35(2):379-85.8. Rumley CN, Lee MT, Holloway L, Rai R, Min M, Forstner D, et al. Multiparametric magnetic resonance imaging in mucosal primary head and neck cancer: a prospective imaging biomarker study. BMC Cancer. 2017;17(1):475.9. Padhani AR, Liu G, Koh DM, Chenevert TL, Thoeny HC, Takahara T, et al. Diffusion-weighted magnetic resonance imaging as a cancer biomarker: consensus and recommendations. Neoplasia. 2009;11(2):102-25.10. Ghany HS, M.; El-Saieed,M.; Gerges, A.; Hasan, E.; Rahman, A.; Toni, N.;. Role of DW-MRI and ADC value in monitoring therapy of head and neck squamous cell carcinoma. Journal of Radiology and Nuclear Medicine. 2018;49(4):1030-5.11. Cao Y, Tseng CL, Balter JM, Teng F, Parmar HA, Sahgal A. MR-guided radiation therapy: transformative technology and its role in the central nervous system. Neuro Oncol. 2017;19(suppl_2):ii16-ii29.12. Vandecaveye V, Dirix P, De Keyzer F, Op de Beeck K, Vander Poorten V, Hauben E, et al. Diffusion-weighted magnetic resonance imaging early after chemoradiotherapy to monitor treatment response in head-and-neck squamous cell carcinoma. Int J Radiat Oncol Biol Phys. 2012;82(3):1098-107.Figures
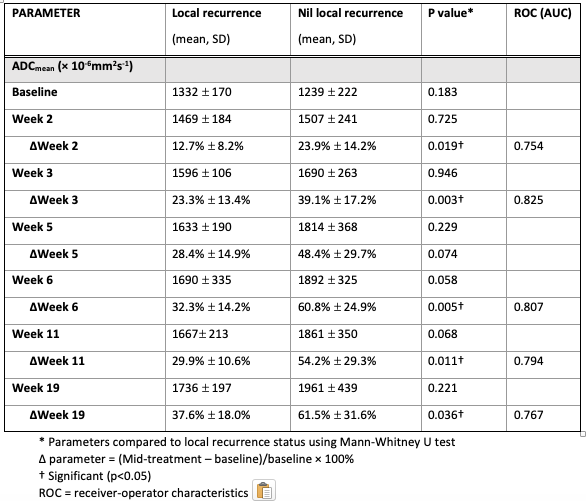
Table 1: Comparison of primary tumour DWI parameters between patients with local recurrence vs nil local recurrence at 1 year
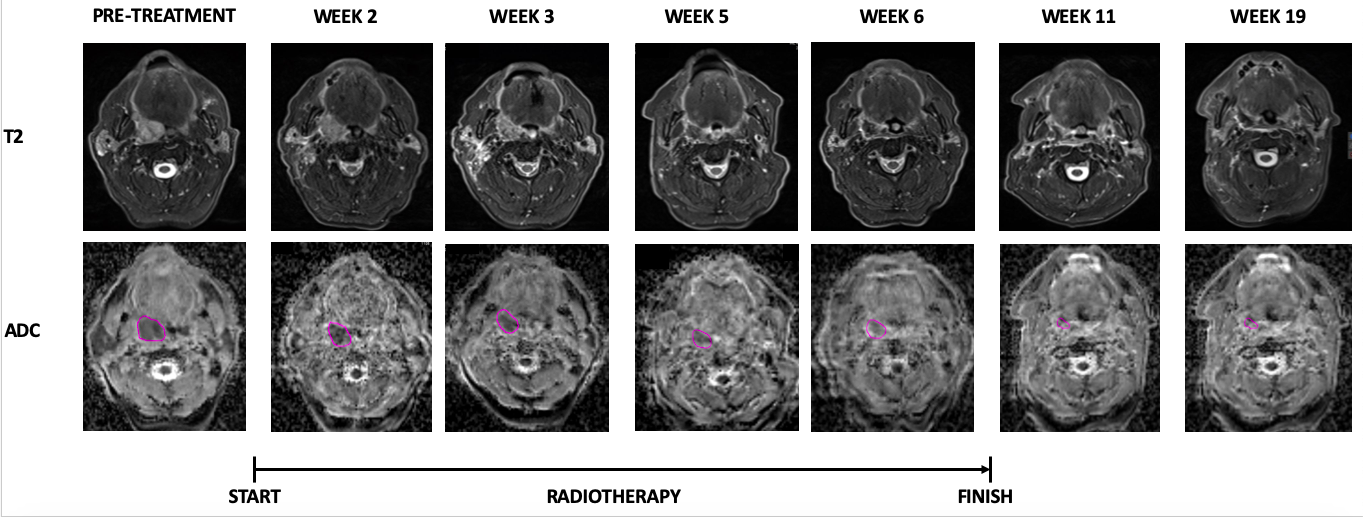
Figure 1: Serial MRI images for a patient with right tonsil cancer. T2, T2 weighted images; ADC, apparent diffusion coefficient
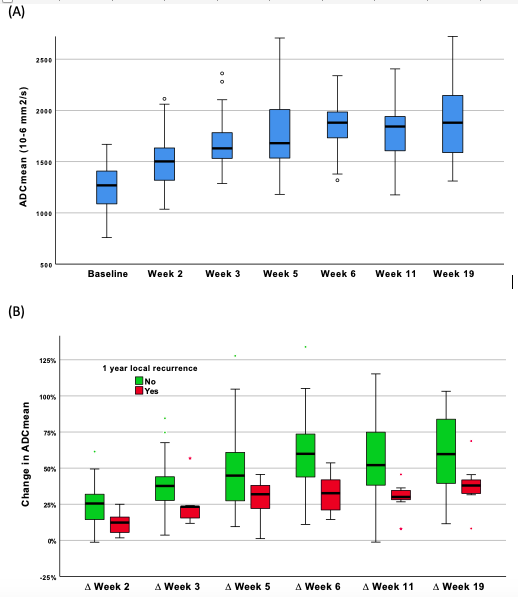
Figure 2: Primary tumour ADCmean values before, during and following completion of radiotherapy. Absolute values (A). Percentage change relative to baseline stratified by local recurrence status (B)
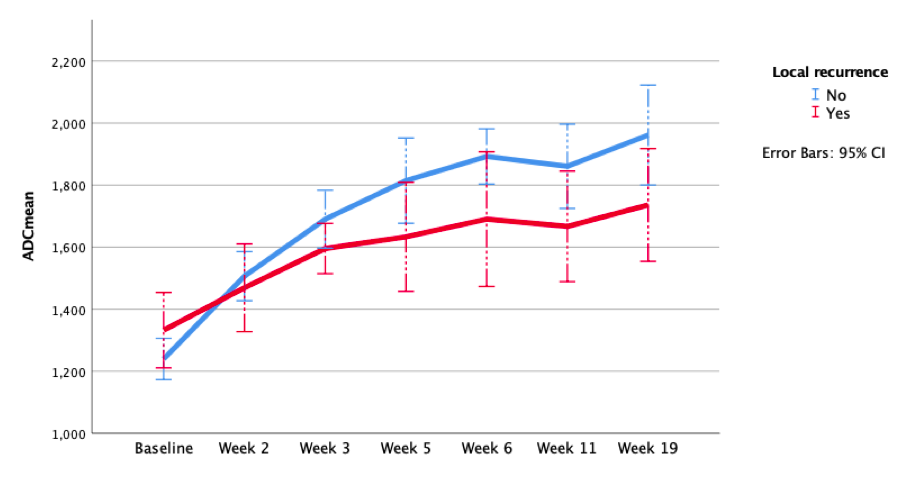
Figure 3: Trend of primary tumour ADCmean value before, during and following radiotherapy stratified by 1 year local recurrence status
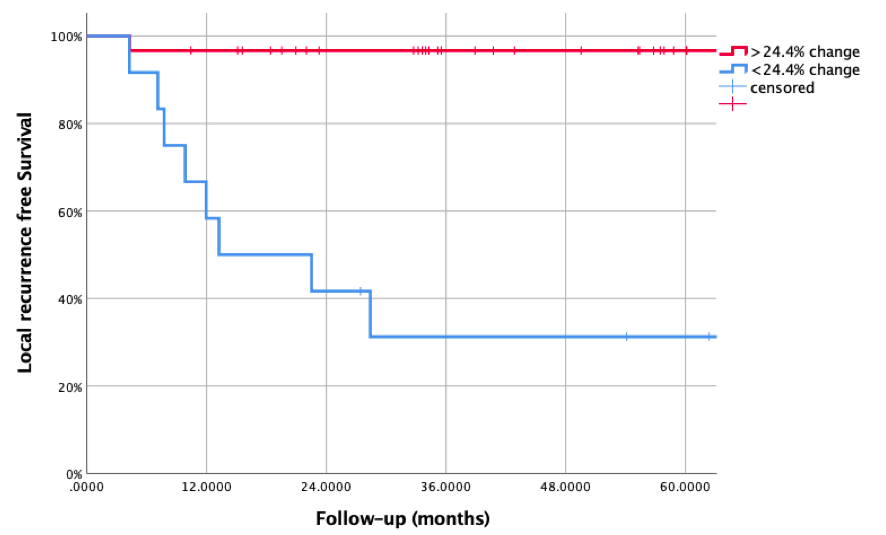
Figure 4: Kaplan Meier curve for local recurrence free survival stratified by change in primary tumour ADCmean (>24.4%) at week 3 from baseline during radiotherapy
DOI: https://doi.org/10.58530/2022/3128