3124
The T1mapping, T2mapping findings in patients with minimal hepatic encephalopathy and their impact on cognition value1Ningxia Medical University, Yinchuan, China, 2General Hospital of Ningxia Medical University, Yinchuan, China, 3GE Healthcare, Beijing, China
Synopsis
In this study, we aim to investigate whether T1mapping and T2mapping can be used as diagnostic tools for screening MHE, and strive earlier time for diagnosis and treatment for these patients. It was concluded that T1 values of bilateral putamen, right globus pallidus and bilateral frontal lobe in MHE group were statistically significant compared with HC group and NMHE group and the T2 values of right putamen and right frontal lobe were statistically significant. In addition, the T2 values of the HC group in this study were highly correlated with Hallgren and Sourander’s autopsy results.
Introduction
Minimal hepatic encephalopathy (MHE) is a neuropsychiatric disorder, about 30-84% patients in the cirrhotic group were diagnosed to have underlying MHE1. The onset of MHE is insidious and patients are prone to develop into severe neuropsychiatric syndrome2. Confirmed by the North American Alliance for the Study of End-Stage Liver Diseases (NACSELD), MHE is an independent risk factor for death in patients with cirrhosis3. Early diagnosis of MHE is particularly important to improve the survival rate and quality of life of patients. Impact of iron deposition in cognitive is widely recognized. Smith et al.4 found that iron deposits in the cerebral cortex and cerebellum of patients with preclinical Alzheimer's disease or mild cognitive impairment increased compared with controls in the normal age group, and tended to increase with gradually impaired cognitive ability. Xia et al. 5also reported that the time phase reduction of frontal white matter and basal ganglia in MHE patients was related to iron deposition. At present, there are many imaging methods for the diagnosis of hepatic encephalopathy, such as fMRI, SWI, QSM, etc.. However these methods generally take a long time and rely on the supplementary information from other routine sequence to make a diagnosis. Recently proposed synthetic MRI using the magnetic resonance image compilation (MAGiC) with a multiecho and multidelay acquisition method can simultaneously quantify tissues’ intrinsic magnetic properties (T1, T2) and investigate all of the measures in a practically acceptable scan time. The purpose of this study is to explore the feasibility of quantitative measurement of iron content in bilateral prefrontal region and basal ganglia - thalamus in MHE patients by using synthetic MRI quantitative maps, and to explore the correlation between quantitative values of T1 and T2 in bilateral prefrontal region and basal ganglia - thalamus connection circuit and neurocognitive ability of MHE.Methods
Our Institutional Review Board approved the protocol and written informed consent was obtained from each subject. Inpatients with post-hepatitis B cirrhosis diagnosed clinically and radiologically from August 2020 to June 2021 were enrolled, all patients are right-handed. All subjects underwent Number Connection Test-A(NCT-A)and Digit Substitution Test(DST) Neuropsychiatric Scale, and twenty-three patients with cirrhosis with MHE (MHE group) and 22 patients with non minimal hepatic encephalopathy(NMHE) (NMHE group) were screened. In addition, 21 healthy control (HC )subjects (HC group) with similar age, sex and education level were recruited. All patients underwent MR exams on a 3.0T MR scanner, with a 48 channel head coil (Signa Architect, GE Healthcare).The scan sequences included routine brain MRI scan and MAGiC sequence. The MAGIC parameters were as follows: FOV: 240x240mm; matrix size: 320x256; slice thickness: 6; spacing: 1.5; slices: 20; echo train length: 16; Bandwidth: 22.73, total time :3.38mins. The maximum layer ROI of bilateral prefrontal lobe and bilateral deep basal ganglia was extracted by GE Healthcare post-processing workstation. One-way ANOVA was used to compare T1 and T2 quantitative values of ROI between MHE, cirrhosis and HC groups. Spearman correlation analysis was used to evaluate the relationship between quantitative values of T1 and T2 in different brain regions and NCT-A and DST scores in MHE group.Results
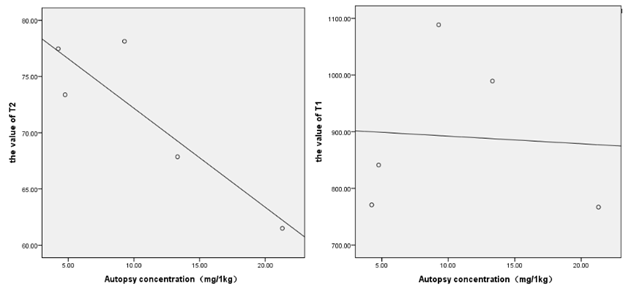
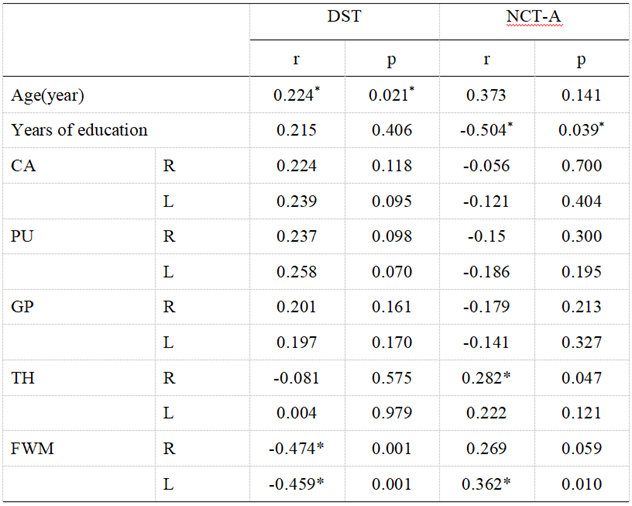
Compared to the HC and NMHE groups, we found a significantly differences in bilateral putamen, right globus pallidus and bilateral frontal lobe of T1 value and right putamen and right frontal lobe of T2 value (Figure 2). T1 values of the right thalamus and left frontal lobe were positively correlated with NCT-A time, while T1 values of bilateral frontal lobes were negatively correlated with DST scores (Table 1). And T2 values of bilateral caudate nucleus and bilateral putamen were negatively correlated with NCT-A time; T2 values in the right caudate nucleus were positively correlated with DST scores, while T2 values in bilateral frontal lobes were negatively correlated with DST scores (Table 2). A high correlation (r=-0.885,p=0.046) was found between the T2 value of HC group and Hallgren and Sourander’s autopsy results of iron concentration(Figure 3).Discussion and Conclusion
Our study demonstrated clinical value of T1 and T2 in screening MHE. Compared with the HC and NMHE groups, the T1 values of bilateral putamen, right globus pallidus and bilateral frontal lobe and the T2 values of right putamen and right frontal lobe in MHE group were significantly different. What’s more, our study also found that the T2 values of each brain area in the HC group were highly correlated with Hallgren and Sourander’s autopsy results of brain iron concentration. Meanwhile, in MHE group, T2 values of bilateral caudate lobe were negatively correlated with NCT-A time and T2 value of bilateral frontal lobe were negatively correlated with DST score, while the T2 values of right caudate lobe were positively correlated with DST score. Therefore, it is reasonable to believe that the change of T2 value in MHE group is related to the change of brain iron deposition, and the change of brain iron deposition is one of the factors leading to the brain cognitive dysfunction in MHE patients. To conclude,relaxometry metrics from synthetic MRI, especially the T2, has clinical value in early screening of MHE.Acknowledgements
References
1. Groeneweg M, Quero J C, De Bruijn I, et al. Subclinical hepatic encephalopathy impairs daily functioning[J]. Hepatology,1998,28(1):45-49.
2. Weissenborn K, Bokemeyer M, Ahl B, et al. Functional Imaging of the Brain in Patients with Liver Cirrhosis[J]. Metabolic brain disease,2004,19(3):269-280.
3. Bajaj J S, O Leary J G, Tandon P, et al. Hepatic Encephalopathy Is Associated With Mortality in Patients With Cirrhosis Independent of Other Extrahepatic Organ Failures[J]. Clinical gastroenterology and hepatology,2016,15(4):565-574.
4. Smith M A, Zhu X, Tabaton M, et al. Increased Iron and Free Radical Generation in Preclinical Alzheimer Disease and Mild Cognitive Impairment[J]. Journal of Alzheimer's Disease,2010,19(1):363-372.
5. Xia S, Zheng G, Shen W, et al. Quantitative measurements of brain iron deposition in cirrhotic patients using susceptibility mapping[J]. Acta Radiologica,2015,56(3):339-346.
Figures
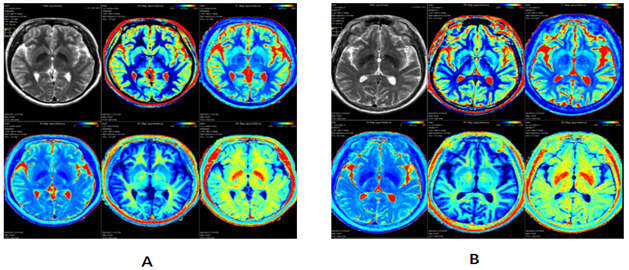
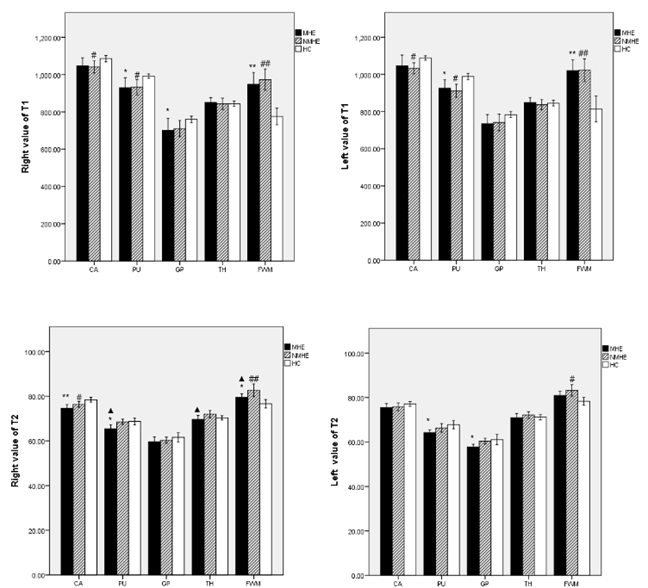
Figure 2 Quantitative values of T1 and T2 in the prefrontal region and basal ganglion-thalamus circuit in MHE, NMHE and HC groups.
CA= caudate;PU= putamen; GP= globus pallidus; TH= thalamus; FWM= frontal white matter
*:P<0.05 compared to HC; **:P<0.001 compared to HC;
#:P<0.05 compared to NMHE;##:P<0.001 compared to NMHE
▲:P<0.05 NMHE compared to HC