3123
Regional comparison of brain standardized uptake values in FBPA PET-MR with FBPA PET-CT1Department of Nuclear Medicine, Taipei Veterans General Hospital, Taipei, Taiwan, 2Department of Biomedical Imaging and Radiological Sciences, National Yang-Ming University, Taipei, Taiwan, 3GE Healthcare, Taipei, Taiwan, 4Department of Nuclear Medicine, Taipei Medical University Hospital, Taipei, Taiwan
Synopsis
18F-fluoro-Boronophenylalanine (FBPA) Positron emission tomography (PET) plays a crucial role for patient selection prior to boron neutron capture therapy. As integrated PET-MR is being used frequently in clinical research and routine, this study aimed to compare regional difference of brain standard uptake values on the PET quantification accuracy in FBPA PET-CT and PET-MR among lesions and normal tissues. Compared to SUVR in PET-CT, PET-MR data showed significant lower SUVR in lesion regions, while no significance was observed in the normal tissue regions. The result of this study may accelerate the routine use of PET-MR in tumoral quantification before BNCT.
INTRODUCTION
Boron neutron capture therapy (BNCT) is a cellular-level particle radiation therapy, and it delivers high and specific radiation to the tumor and damages little to the normal tissue. BNCT requires accurate estimation of 10B concentration not only in target lesion to accelerate therapeutic effect but also and particularly in neighbouring normal tissue to avoid its adverse effect. 18F-fluoro-Boronophenylalanine (FBPA) Positron emission tomography (PET) is the primary simulating method of the boron-carrier “boronophenylalanine (BPA)” which required prior to neutron irradiation. PET-MR is getting popular in molecular imaging due to rich anatomic information from MR and no ionizing radiation exposure. To reliably measure the standardized FBPA uptake values (SUV) in PET-MR, it is necessary to quantify and correct for photon attenuation mainly caused by soft tissue and bone as well as MRI hardware components[1-3]. Apparently, the question remained whether there would be good agreement in SUV between PET-CT and PET-MR. The previous FDG-PET literature had compared SUVs in abdomen imaging by PET-CT and PET-MR and showed that MR-based AC is accurate in most tissue types, with SUV deviations generally of less than 10% [4]. No literature focusing on the brain imaging was found, and thus, this study aimed to evaluate and compare the effect of SUVs on the PET quantification accuracy in FBPA PET-CT and PET-MR brain imaging using regional comparison.Methods
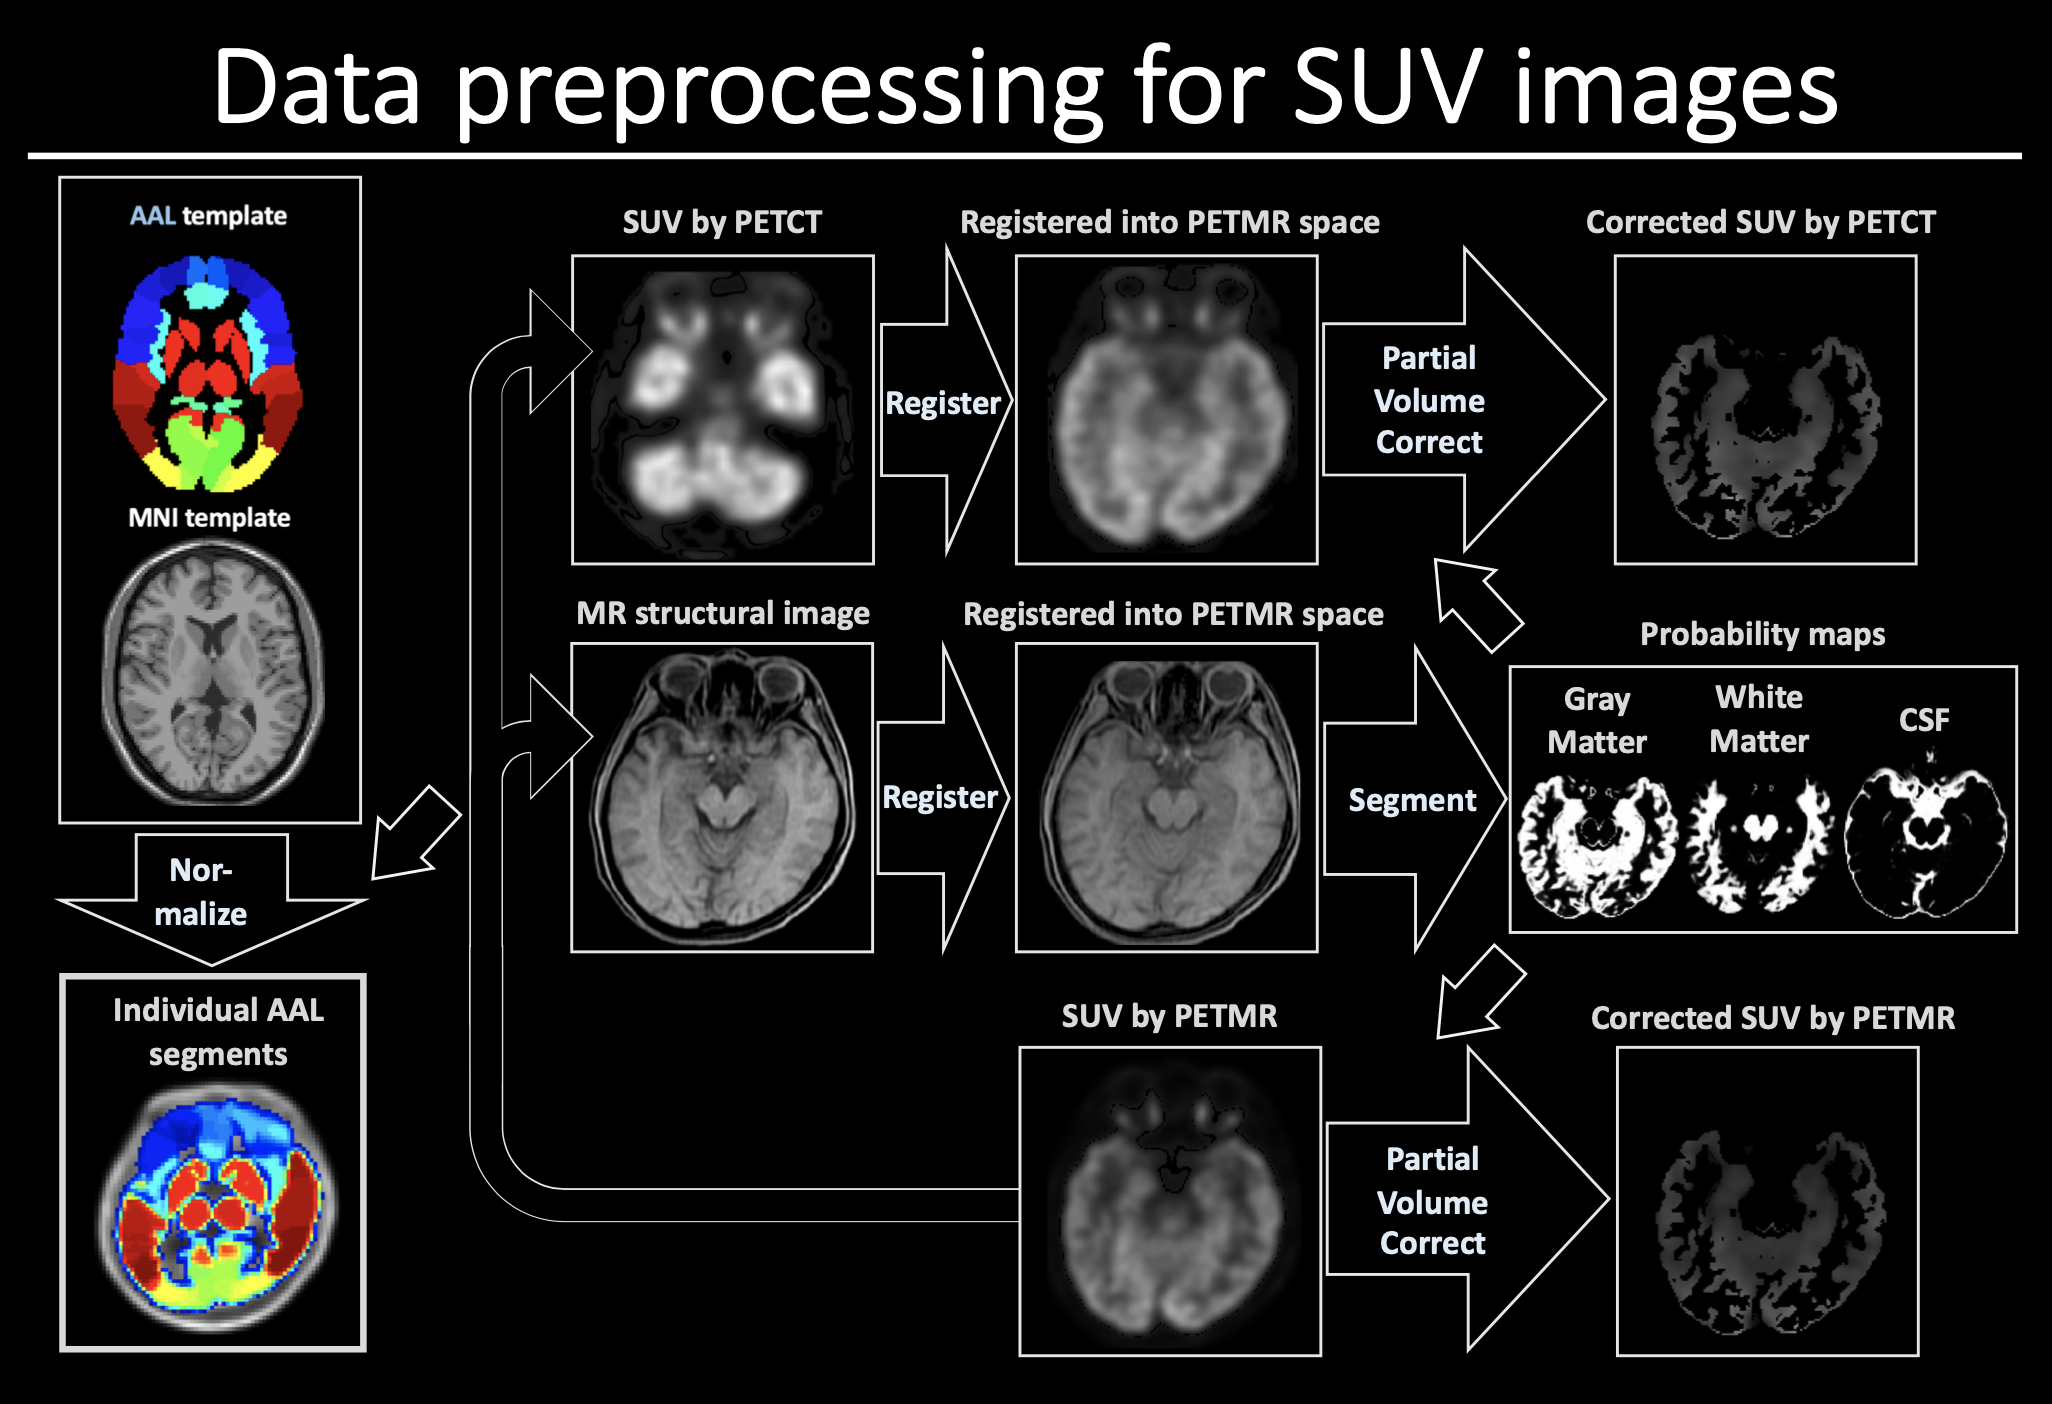
Eighteen participants (12 females, 6 men; mean age, 57years; age range, 29-81) were enrolled in this study. Data were acquired using a PET-CT scanner (Discovery MI DR; GE Healthcare, Milwaukee, WI, USA) and a 3T PET-MR scanner (SIGNA PET/MR; GE Healthcare, Milwaukee, WI, USA) using a geometry-embracing method (GEM) head-and-neck unit for signal detection and a whole-body coil for radio-frequency excitation. In PET-MR imaging, Zero-TE sequence was employed for attenuation correction (AC), and one structural imaging dataset (LAVA Flex; TR/TE=5.35/1.936 ms; FOV: 40 x 40 cm; matrix size: 512 x 512; slice thickness: 2 mm) were acquired for the spatial normalization for PET images by PET-MR and PET-CT. The PET-CT and PET-MR scans were acquired at 61.1±2.92 min and 104.1 22.7 min after tracer injection, respectively. For each patient, 2 AC maps were generated on the basis of each of the ZTE-AC, and CT-AC methods. In both modalities, PET data were accumulated 2 minutes to reconstruct the FDG SUV images. All data preprocessing steps were performed in the SPM12 software. First, the SUV images and structural images by PET-MR were co-registered into the spatial orientation of SUV images by PET-CT. Second, the spatial segmentation was applied in the registered structural images for extraction of white matter (WM), gray matter (GM), and cerebrospinal fluid (CSF). Third, all image data were normalized into MNI space, and then the partial volume effect was corrected by PETPVE12 toolbox (Figure 1). The lesion regions were selected manually by an experienced radiology, and the significant SUV levels among lesion sites were tested using paired t-test. Moreover, to evaluate the regional difference between SUVs by PET-MR and PET-CT, ROI-wised analyses were used in this study. And Automated Anatomical Labeling (AAL) template was used for the ROI-wised analysis. To normalize the variation among patients, all the SUV of ROIs were divided into the average level of the SUV of bilateral cerebellar lobule Crus I-II. In group-leveled data analysis, paired t-test was applied for both the voxel-wised and ROI-wised analyses.RESULTS and DISCUSSION
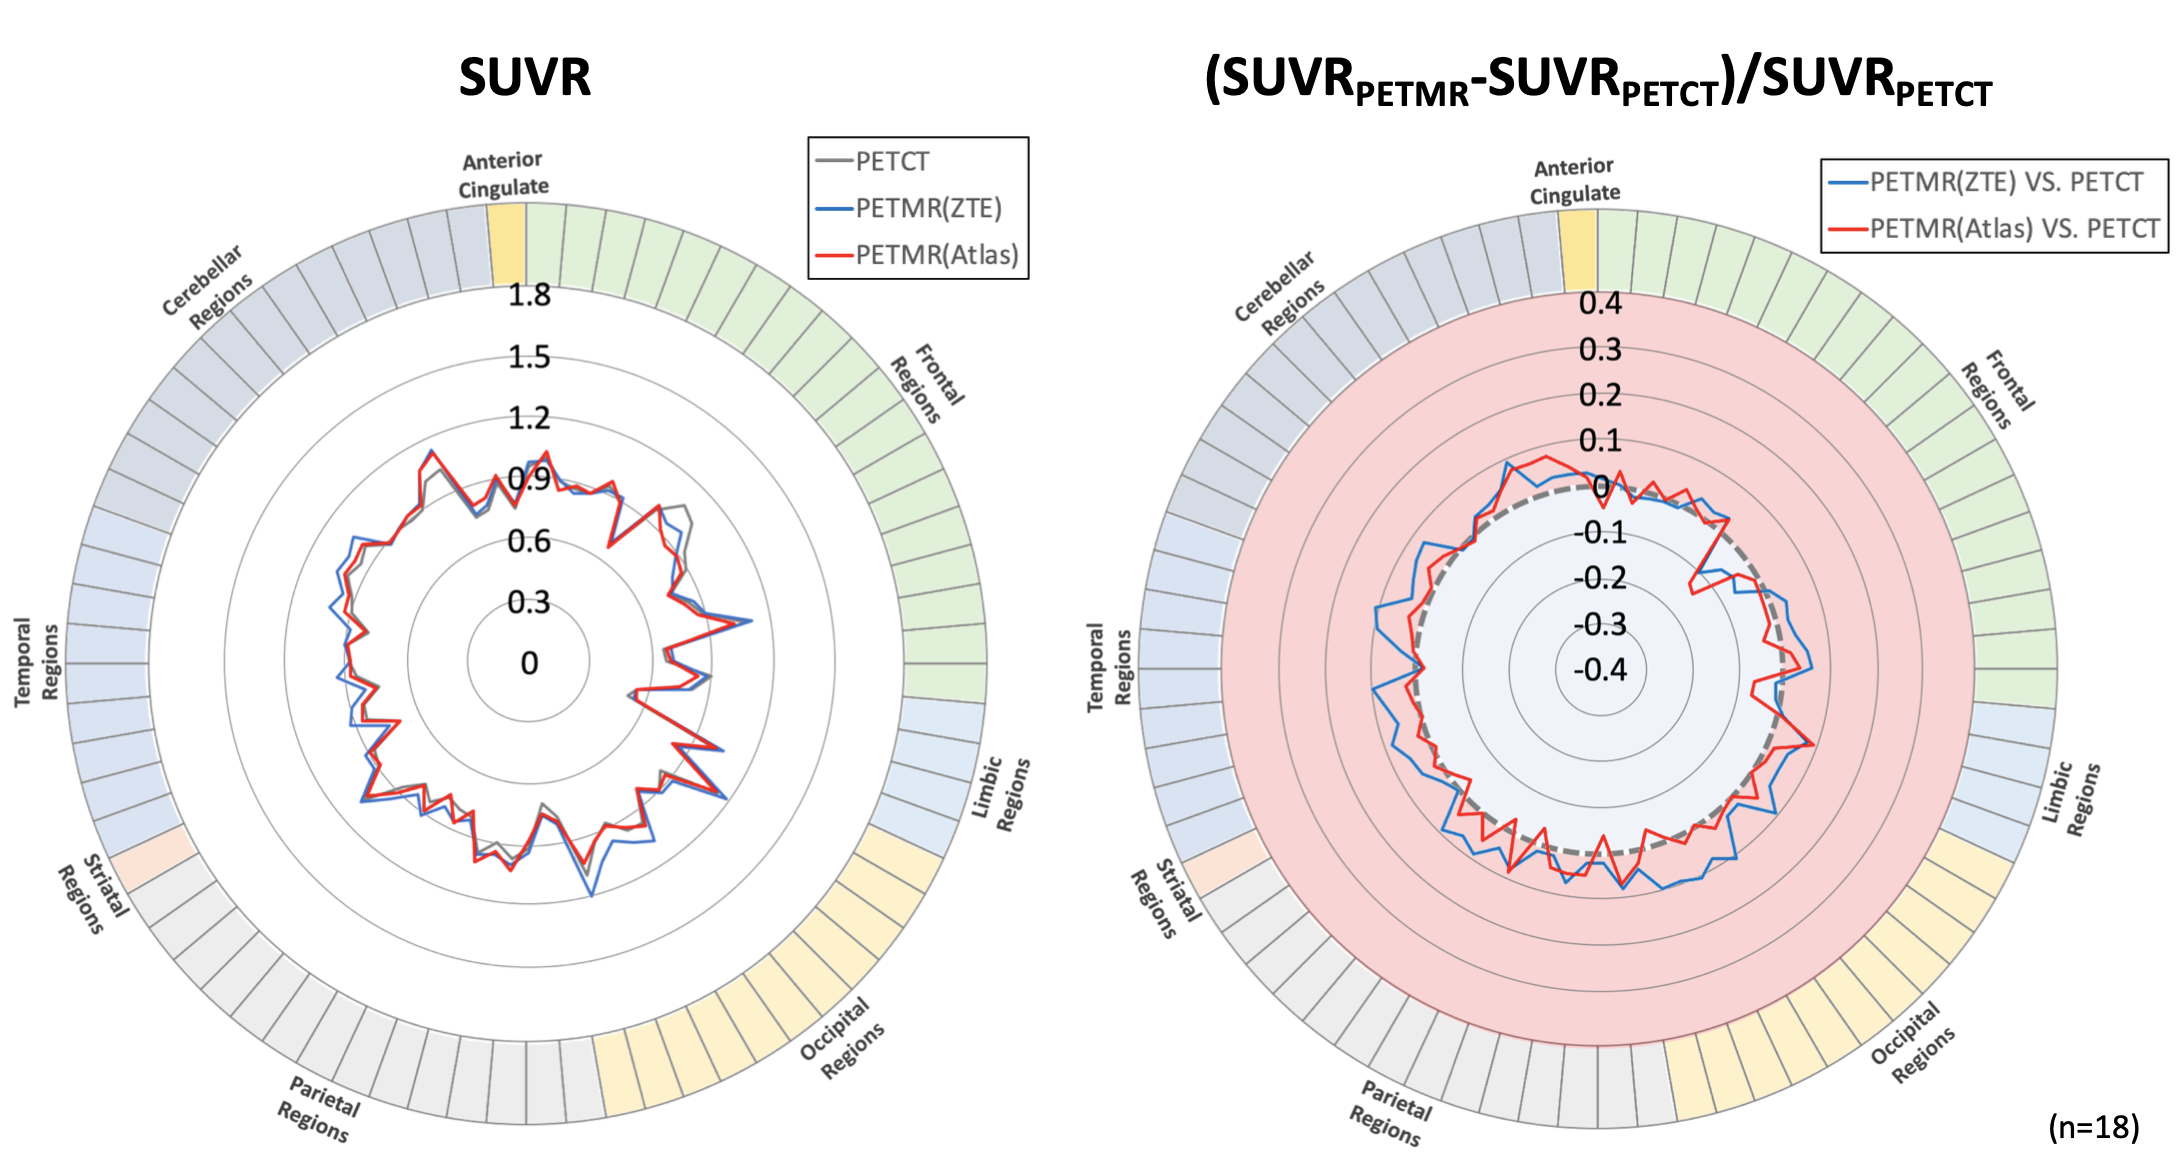
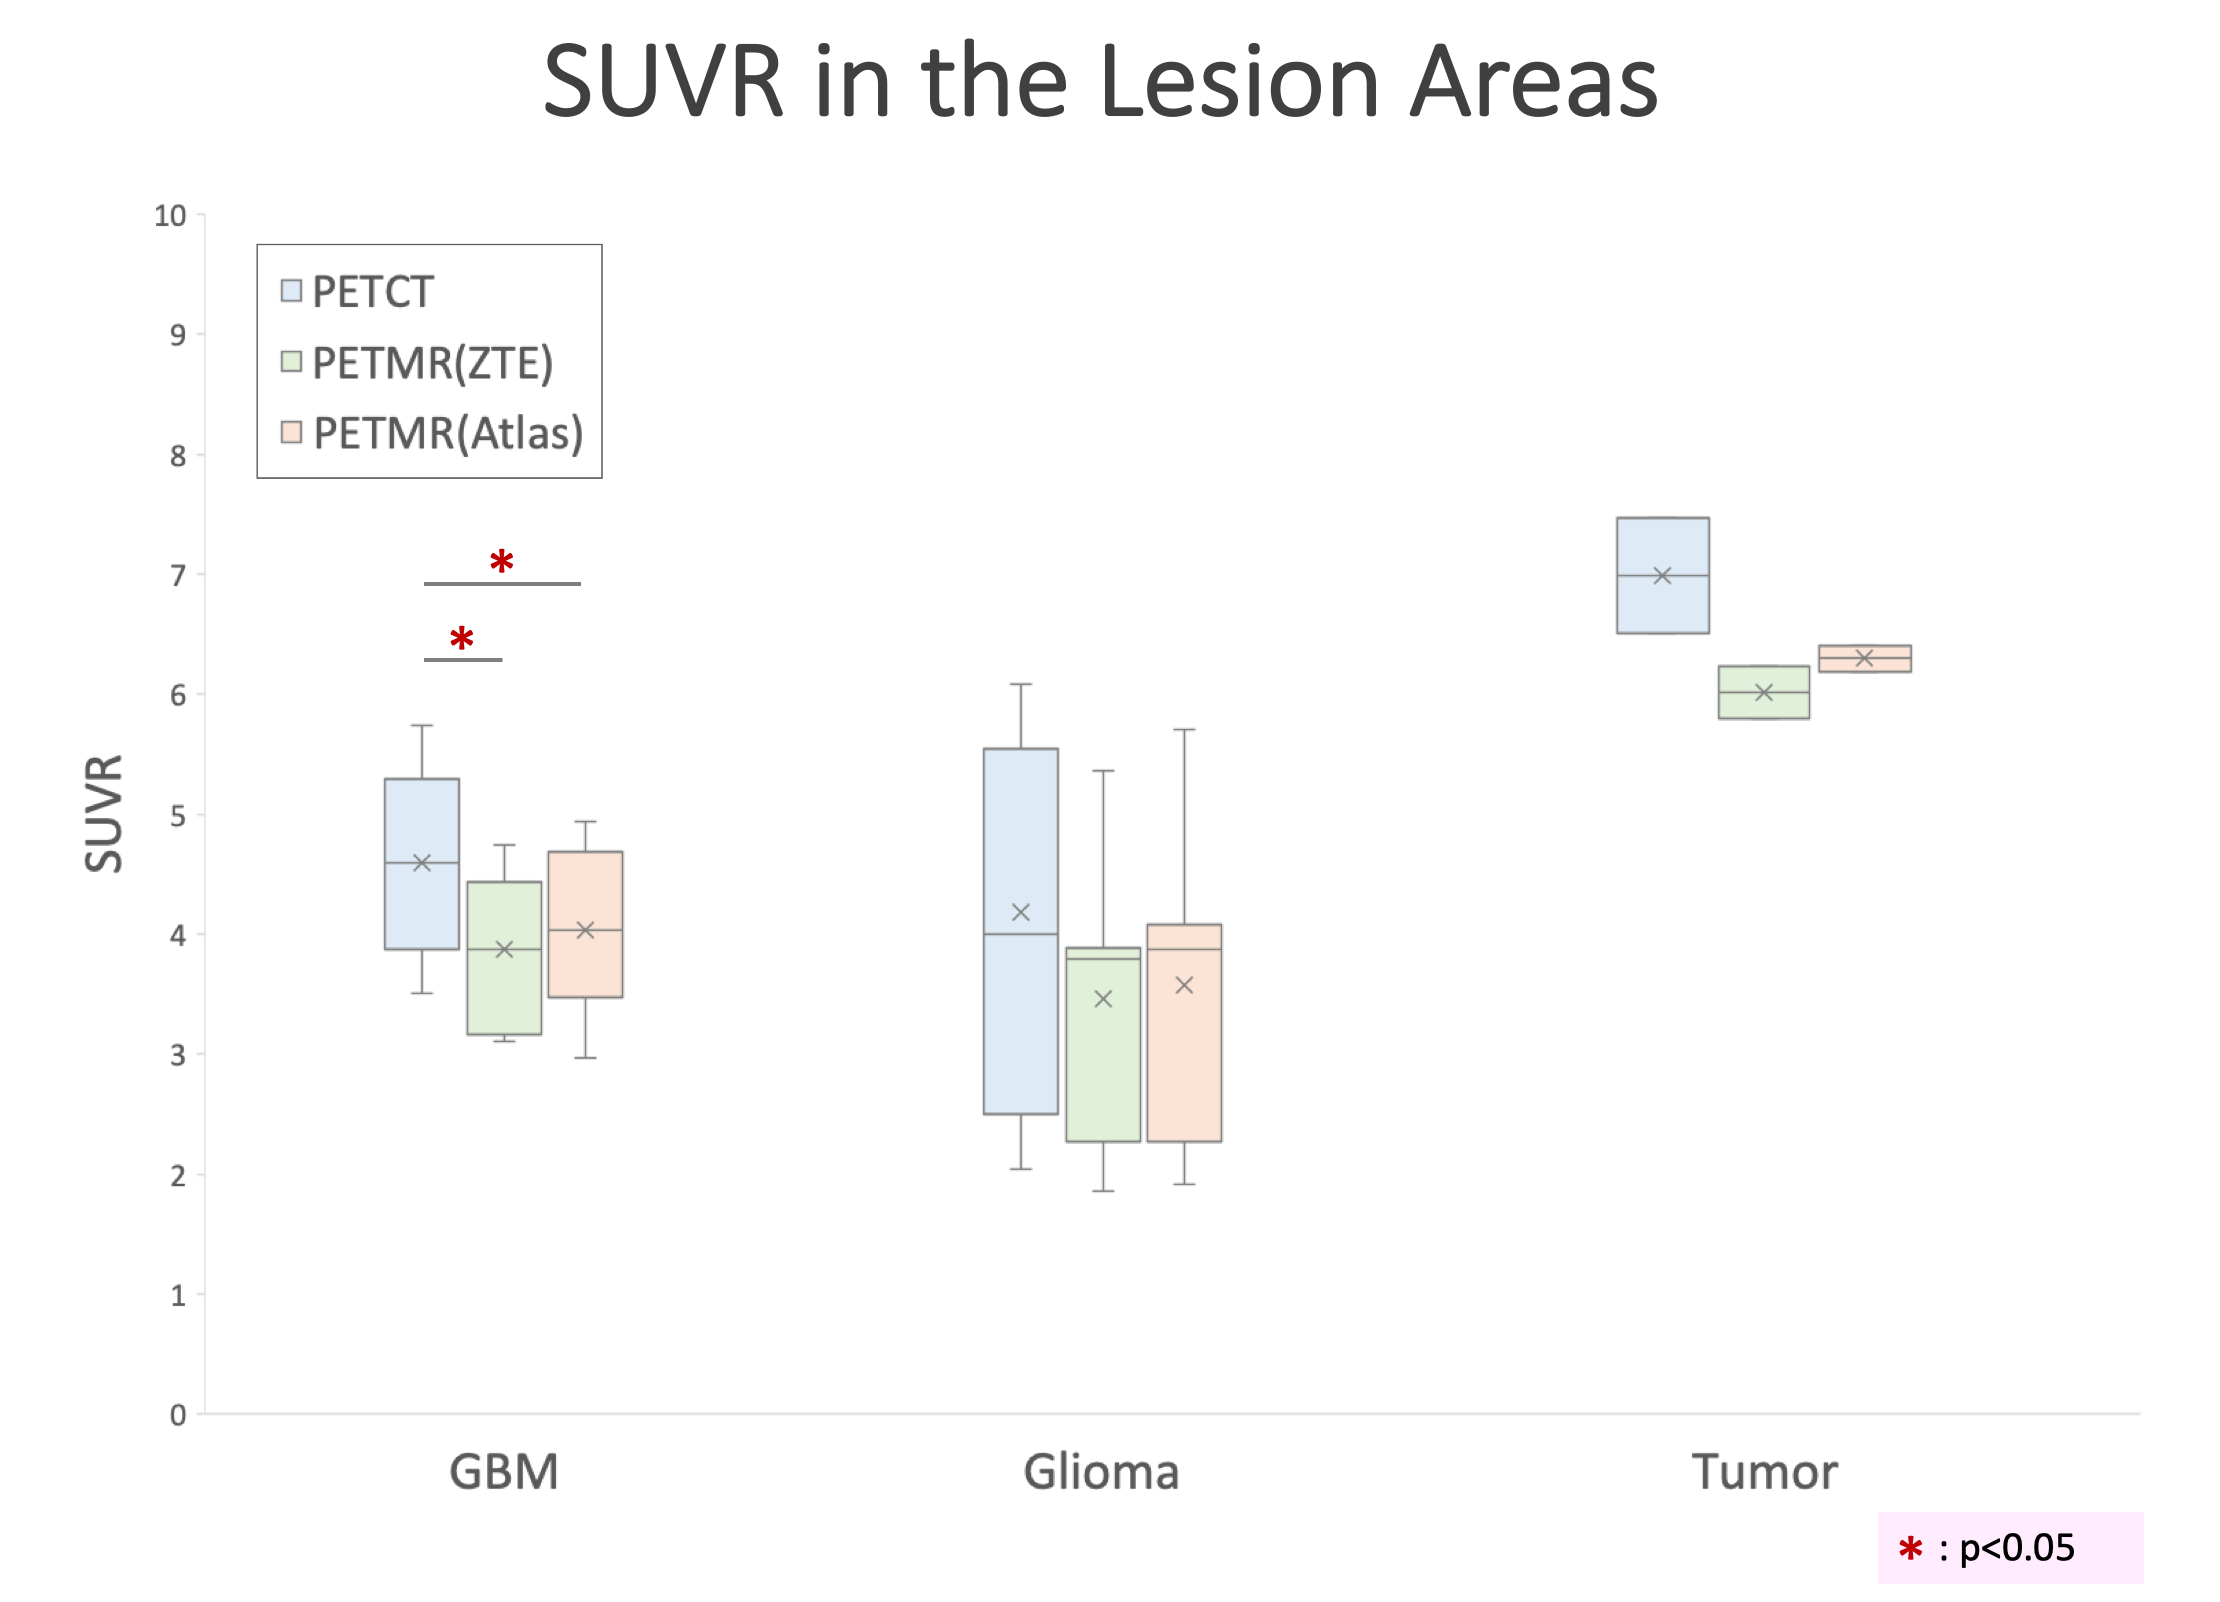
In the result of the normal tissues (Figure 2), the difference of SUVRs between PETCT and PETMR ranged from -15% to +10% (no significance). In the result of lesions’ SUVR, compared with the SUVR by PET-CT, the values of GBM regions showed significant lower level as measured on PET-MR (Bonferonni corrected p<0.05) (Figure 3).CONCLUSION
In the ROIs of normal tissues, the SUVRs by PET-MR (with ZTE/atlas-corrected) show no significance with the SUVR by PET-CT. Compared with SUV by PET-CT, GBM regions showed significant lower SUVR value in that by PET-MR while no significance was observed in the normal tissue sites. This regional difference has to be considered when applying PET-MR derived brain SUVs in clinical use.Acknowledgements
No acknowledgement found.References
1. Mehranian A, Arabi H, Zaidi H. Quantitative analysis of MRI-guided attenuation correction techniques in time-of-flight brain PET/MRI. Neuroimage. 2016;130:123–33.
2. Eldib M, Bini J, Calcagno C, Robson PM, Mani V, Fayad ZA. Attenuation correction for flexible magnetic resonance coils in combined magnetic resonance/positron emission tomography imaging. Invest Radiol. 2014;49:63–9.
3. Paulus DH, Tellmann L, Quick HH. Towards improved hardware component attenuation correction in PET/MR hybrid imaging. Phys Med Biol. 2013;58:8021–40.
4. Seith F, Gatidis S, Schmidt H, Bezrukov I, la Fougère C, Nikolaou K, et al. Comparison of Positron Emission Tomography Quantification Using Magnetic Resonance- and Computed Tomography-Based Attenuation Correction in Physiological Tissues and Lesions: A Whole-Body Positron Emission Tomography/Magnetic Resonance Study in 66 Patients. Invest Radiol. 2016;51:66–71.
Figures